Top-view trajectory data of pedestrians in groups under vehicle influence in controlled experiments
- Last updated on 04/19/2019
- E-mail: yang.3455@osu.edu
![]()
- Control and Intelligent Transportation Research (CITR) Lab
- Department of Electrical and Computer Engineering
- Center for Automotive Research (CAR)
A major update was done on Apr 19, 2019. An extended Kalman filter was applied for refining the vehicle trajectory, so that the output vehicle state contains (x, y, heading, speed), which is in accordance with a vehicle model (bicycle model).
A sister dataset of pedestrian trajectories, DUT dataset, which consists of everyday scenarios in university campus, can be accessed at here.
The detailed description of both datasets can be accessed at arXiv preprint: Top-view Trajectories: A Pedestrian Dataset of Vehicle-Crowd Interaction from Controlled Experiments and Crowded Campus.
This paper was accepted to The 30th IEEE Intelligent Vehicles Symposium in Paris.
If you find the dataset useful, please consider citing the above paper. 😀
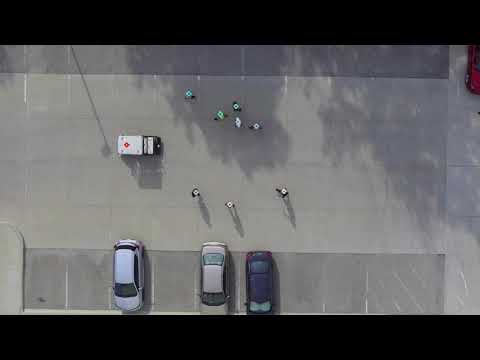
The CITR dataset was collected in the controlled experiments that were conducted in a parking lot near the facility of Control and Intelligent Transportation Research (CITR) Lab at The Ohio State University (OSU). The controlled experiments consist of a series of fundamental vehicle-crowd interactions in the hope of analyzing interactive pedestrian motion under the vehicle influence. A DJI Phamton 3 SE Drone with a down-facing camera on a gimbal system was used as the recording equipment. Participants are members of CITR Lab at OSU. During the experiments, they were instructed to walk from one small area (starting points) to another small area (destinations). The employed vehicle was an EZ-GO Golf Cart mannualy driven by a participant. 3 markers were put on top of the vehicle to help vehicle motion tracking, of which the vehicle center position is calculated by geometry.
Below is a figure showing the configuration of the controlled experiment area (a parking lot near CITR Lab at OSU). The vehicle (a golf cart) moves back and forth between two blue areas. Pedestrians move back and forth between two green areas. The interaction happens in the orange area, which is also the central area of the recording.

A video clip with both the pedestrains and the vehicle labeled is shown below:
Or you can download it here
The stabilized raw videos of CITR dataset can be downloaded at following links:
- Google Drive Download.
- Baidu Yun Download. Code: h5kj
There 6 diffrerent sceanrios in the controlled experiments desigend for the purpose of detailed camparison and analysis. They are shown below:

- 340 pedestrian trajectoreis in total
- 38 video clips, with each clip of about 20 seconds
Inside this folder, there are raw \trajectories and \trajectories_filtered. The above 6 secnearios are grouped by folers.
We recommend you to use data in \trajectories_filtered.
.txt is the ratio/scale file that converts between pixel coordinates (1920x1080) and coordinates in meters. All the recorded trajectories have already been converted in meters. If you want to convert back to pixels for visulization, you can simply multiply the numerical value in this file.
.pdf is a plot giving you an overview of the trajectories (colored is raw, and black is filtered).
There are two .csv files, one for all pedestrians, one for all vehicles. Below is the header descriptio
For pedestrian .csv:
id: pedestrian id
frame: frame number of the video clip
label: 'ped' means pedestrian
x_est: estiamted x position
y_est: estimated y position
xv_est: estiamted velocity in x axis
yv_est: estimated velocity in y axis
For vehicle .csv:
id: vehicle id
frame: frame number of the video clip
label: 'veh' means vehicle
x_est: estiamted x position
y_est: estimated y position
psi_est: orientation (heading angle) of the vehicle (in rad)
vel_est: longitudinal velocity of the vehicle
If you would like to use raw \trajectories, be careful that they are stored in a different format:
Each .csv file corresponds to only 1 object, with the ID on the file name, for example, p3.csv means pedestrian with ID 3, v1.csv means vehicle with ID 1.
For pedestrian .csv:
frame: frame number of the video clip
id: pedestrian id
x: tracked x position
y: tracked y position
For vehicle .csv:
frame: frame number from the video clip
id: vehicle id
x_c: x position of P_c
y_c: y position of P_c
x_1: x position of P_1
y_1: y position of P_1
x_2: x position of P_2
y_2: y position of P_2
For the definition of P_1, P_2, P_c, see the following picture:

Below is a rough measure of the vehicle shape. If you need precision, you can measure it yourself by using the above figure.
                   right side
                       |
                      0.6m
                       |
front bumper -- 1m -- P_c -- 1.2m -- rear bumper
                       |
                      0.6m
                       |
                   left side
Again, there is a .txt ratio/scale file that converts between pixel coordinates (1920x1080) and coordinates in meters
The data has already been filtered, so you don't have to do it again. We just provide them for your refernce.
These are python codes for filtering the raw data filter_trajectories.py and generating statistics statistics.py. The Kalman filters were implemented in tools\kalman_filters.py.
- If you find any errors, please contact the author.