Using custom scheduling in React.
Within scopes known to React - such as a useEffect() hook body or an event handler function - all synchronous function calls that
manipulate state (using the useState() hook) will be batched up automatically, thus leading to only a single scheduled re-render instead
of potentially multiple ones. [1,
2,
3]
For instance:
// State
const [value, setValue] = useState('');
const [otherValue, setOtherValue] = useState('');
const [thisValue, setThisValue] = useState('');
const [thatValue, setThatValue] = useState('');

// Side effects
useEffect(() => {
  setOtherValue(`other ${value}.`);
  setThisValue(`this ${value}.`);
  setThatValue(`that ${value}.`);
}, [value]);
Let's assume we update the value, e.g. within an event handler. For instance:
setValue('cool value');Now, the following re-renderings happen:
| Render | Description |
|---|---|
| 1 |
Calling setValue('cool value') will lead to the value state variable being updated by the
useState() hook. Because updating state via the useState() hook will always trigger a re-render - at least
if the value has actually changed, which in our case it did - React triggers a re-render.
|
| 2 |
Our useEffect() hook lists the value state variable as a dependency. Thus, changing the value
state variable value will always lead to the useEffect() hook being executed. Within our useEffect() hook,
we update three other state variables (again, based on `useState()`). Now: React has enough context for optimization: It knows what
useEffect() is and does, and it has full control over / executes useEffect(). Thus, React intelligently
batches up all three state changes instead of executing them directly, thus scheduling a single re-render instead of three separate
ones.
|
Now, things are different when asynchronous operations (e.g. promises, timeouts, RxJS, ...) come into play.
For instance:
// State
const [value, setValue] = useState('');
const [otherValue, setOtherValue] = useState('');
const [thisValue, setThisValue] = useState('');
const [thatValue, setThatValue] = useState('');

// Side effects
useEffect(() => {
  Promise.resolve().then(() => {
    setOtherValue(`other ${value}.`);
    setThisValue(`this ${value}.`);
    setThatValue(`that ${value}.`);
  });
}, [value]);
Let's assume we update the value, e.g. within an event handler. For instance:
setValue('cool value');Now, the following re-renderings happen:
| Render | Description |
|---|---|
| 1 |
Calling setValue('cool value') will lead to the value state variable being updated by the
useState() hook. Because updating state via the useState() hook will always trigger a re-render - at least
if the value has actually changed, which in our case it did - React triggers a re-render.
|
| 2, 3, 4 |
Our useEffect() hook lists the value state variable as a dependency. Thus, changing the value
state variable value will always lead to the useEffect() hook being executed. Within our useEffect() hook,
we update three other state variables (again, based on useState()) once our promise resolves. Now: Due to our side
effects being executed asynchronously (once the promise resolves), React does no longer have enough context for optimizations. Thus,
in order to ensure that nothing breaks, React has no other choice than executing all state changes as per usual, leading to three
separate re-renders.
|
Also: Automatic batching / scheduling only works within each useEffect() body, not across multiple useEffect()s. If you have side
effects leading to new state that then triggers side effects - basically a chain of useEffects() - React is not able to optimize this as
it is too unpredicable.
For instance:
// State
const [value, setValue] = useState('');
const [otherValue, setOtherValue] = useState('');
const [thisValue, setThisValue] = useState('');

// Side effects
useEffect(() => {
  setOtherValue(`other ${value}.`);
}, [value]);
useEffect(() => {
  setThisValue(`this ${value}.`);
}, [otherValue]);
Let's assume we update the value, e.g. within an event handler. For instance:
setValue('cool value');Now, the following re-renderings happen:
| Render | Description |
|---|---|
| 1 |
Calling setValue('cool value') will lead to the value state variable being updated by the
useState() hook. Because updating state via the useState() hook will always trigger a re-render - at least
if the value has actually changed, which in our case it did - React triggers a re-render.
|
| 2 |
Our first useEffect() hook lists the value state variable as a dependency. Thus, changing the
value state variable value will always lead to the useEffect() hook being executed. Within our
useEffect() hook, we update the otherValue state variables (again, based on useState()). This
will lead to a re-render.
|
| 3 |
Our second useEffect() hook has the otherValue state variable as its dependency. Thus, the first
useEffect() changing the otherValue state variable value will always lead to the second
useEffect() hook being executed. Within our second useEffect() hook, we update the other two state
variables (again, based on `useState()`). This will, again, lead to a re-render.
|
When managing and distributing state outside of scopes known to React, e.g. when using RxJS (instead of a React Context), React has no way of knowing how to optimize here. Even though the original data source (here our Observable) only emits data once - at the same time, to all components subscribed to it - React will re-render every single component separately.
For instance:
const [value, setValue] = useState('');
const dataStream = useMyObservable();

useEffect(() => {
  // Update value when it changes
  const subscription = dataStream.subscribe((newValue) => {
    setValue(newValue);
  });

  // Cleanup
  return () => {
    subscription.unsubscribe();
  };
});React itself (like many frontend frameworks) hides most of its implementation details and low-level APIs from us, so that we can concentrate on building applications rather than deep diving into React internals. This also applies to the render pipeline and its scheduling mechanisms.
Luckily for us, though, React actually does expose one API that enables us to group / batch renderings: unstable_batchedUpdates.
However, this API, like a few others React exposes, is prefixed with unstable - meaning it this AP not part of the public
React API and thus might change or even break with any future release. But, the unstable_batchedUpdates API is the most "stable unstable"
React APIs out there (see this tweet), and many popular projects rely upon it
(e.g. React Redux). So it's pretty safe to use.
So, it's pretty safe to use? For now, yes. Should it get removed at some point (e.g. React 17) we just need to remove the
unstable_batchedUpdates optimzations and - while performance might worsen - our code continues to work just fine. With the upcoming
Concurrent Mode, chances are good that the unstable_batchedUpdates API might
actually become useless anyways as React will be intelligent enough to do most of the optimizations on its own. Until then,
unstable_batchedUpdates is the way to go.
In the rather simple use cases, we can use unstable_batchedUpdates right away. A common scenario is running asynchronous code in a
useEffect() hook, and in that situation we can wrap all state change function calls in a single unstable_batchedUpdates. This scheduling
is synchronous, as React will render changes right away instead of sometimes later in the current task.
For instance:
  useEffect(() => {
    Promise.resolve().then(() => {
+     unstable_batchedUpdates(() => {
        setOtherValue(`other ${value}.`);
        setThisValue(`this ${value}.`);
        setThatValue(`that ${value}.`);
+     });
    });
}, [value]);Sometimes, for example if all state lives in the same component, it's just easier to combine multiple useState()s into a single
useState(), e.g. by combining state into an object.
For instance:
  useEffect(() => {
    Promise.resolve().then(() => {
+     unstable_batchedUpdates(() => {
-       setOtherValue(`other ${value}.`);
-       setThisValue(`this ${value}.`);
-       setThatValue(`that ${value}.`);
+       setAdditionalValues({
+         otherValue: `other ${value}.`,
+         thisValue: `this ${value}.`,
+         thatValue: `that ${value}.`
+       });
+     });
    });
}, [value]);In more complex situations - e.g. when we want to schedule renderings across multiple components, perhaps even across multiple state
changes - we need to be a bit more creative. A custom scheduling solution could exist globally, allowing every component to schedule state
changes, and then either we (synchronously) or the browser (asynchronously) will run the state changes wrapped in unstable_batchedUpdates.
The performance analysis below explores those custom scheduling solutions, and if / how they affect performance.
Of course, we want to get meaningful and consistent results when performance analysis each use case implementation. The following has been done to ensure this:
- All use case implementations are completely separated from each other.
Sure, it's a lot of duplicate code and tons of storage used bynode_modulesfolders, but it keeps things clean. In particular:- Each use case implementation exists within a separete folder, and no code gets shared between use cases. This way, we can ensure that the implementation is kept to the absolute minimum, e.g. only the relevant scheduler, no unnecessary logic or "pages".
- Each use case defines and installs its own dependencies, and thus has its own
node_modulesfolder. This way, we can easily run our performance analysis tests using different dependencies per use case, e.g. using a newer / experimental version of React.
- Performance analysis happens on a production build of the application.
That's the version our users will see, so that's the version we should test. In particular:- Production builds might perform better (or at least different) than development builds due things like tree shaking, dead code elimination and minification.
- React itself actually does additional things in development mode that do affect performance, e.g. running additional checks or showing development warnings.
- Performance analysis happens with the exact same clean browser.
Let's keep variations to a minimum. In particular:- We use the exact same version of Chrome for all tests, ensuring consistent results.
- We use a clean version of Chrome so that things like user profiles, settings or extensions / plugins don't affect the results.
While all this certainly helps getting solid test results, there will always be things out of our control, such as:
- Browser stuff (e.g. garbage collection, any internal delays)
- Software stuff (Windows, software running in the background)
- Hardware stuff (CPU, GPU, RAM, storage)
All the performance profiling results documented below ran on the following system:
| Area | Details |
|---|---|
| CPU | Intel Core i7 8700K 6x 3.70Ghz |
| RAM | 32GB DDR4-3200 DIMM CL16 |
| GPU | NVIDIA GeForce GTX 1070 8GB |
| Storage | System: 512GB NVMe M.2 SSD, Project: 2TB 7.200rpm HDD |
| Operating System | Windows 10 Pro, Version 1909, Build 18363.778 |
Within each test case implementation, the start-analysis.bin.ts script is responsible for executing the performance analysis and writing
the results onto the disk.
In particular, it follows these steps:
| Step | Description |
|---|---|
| 1 | Start the server that serves the frontend application build locally |
| 2 | Start the browser, and navigate to the URL serving the frontend application |
| 3 | Start the browser performance profiler recording |
| - | Wait for the test to finish |
| 4 | Stop the browser performance profiler recording |
| 5 | Write results to disk |
| 6 | Close browser |
| 7 | Close server |
Internally, we use Puppeteer to control a browser, and use the native NodeJS server API to serve the fronted to that browser.
To run a performance analysis on a use case, follow these steps:
- Install dependencies by running
npm run install - Create a production build by running
npm run build - Run the performance analysis by running
npm run start:analysis
The script will create the following two files within the results folder:
profiler-logs.jsoncontains the React profiler results
The root project is a React app that offers a visualization of this file in the form of charts. Simply runnpm startand select aprofiler-logs.jsonfile.tracing-profile.jsoncontains the browser performance tracing timeline
This file can be loaded into the "Performance" tab of the Chrome Dev Tools, or can be uploaded to and viewed online using the DevTools Timeline Viewer
We are running the performance analysis with the following parameters:
- We render once every second
- We render 200 components
- We render 30 times
The following table shows a short test summary. See further chapters for more details.
| Test case | Render time | Comparison (render time) |
|---|---|---|
| No scheduling | ~9.69ms | 100% (baseline) |
| Synchronous scheduling by manual flush | ~1.88ms | 19.40% |
| Asynchronous scheduling using Microtasks | ~1.81ms | 18.68% |
| Asynchronous scheduling using Macrotasks | ~1.84ms | 18.99% |
| Asynchronous scheduling using based on render cycle | ~1.84ms | 18.99% |
| Concurrent Mode (experimental!) | ~1.85ms | 19.09% |
It should be noted that actual numbers are not that important, mainly because they will never be 100% exact and realisistic, partially also because the Chrome performance tracing profiler and the React profiler have a hard-to-measure impact on the performance. What's way more interesting here is how faster or slower something got in comparison.
- Using scheduling (either manually or by switching to Concurrent Mode) generally improves render speeds by a factor of 5.
- There is no identifyable difference between different render scheduler mechanisms in regards to the render speed. Thus, the decision on which scheduling technique to use just depends on the specific use case. Different scheduling mechanisms may even be combined if useful.
- Concurrent Mode is not yet ready
Ideally, we want to use features that come with React itself. But as the React Concurrent Mode is still very experimental and requires the App to be stict-mode compatible (which many popular and widely used React libraries are still not yet), it's not a solution for most apps and people (except maybe for people like me who like to live on the edge and break things all the freakin' time). - Synchronous scheduling is doable but not easy
Synchronous scheduling by manual flush comes the closest to not using scheduling, but it requires us to handle the flush by ourselves, probably at the place where state gets managed - seems that this is not the best idea from an architecture point of view? - Asynchronous scheduling is the easiest solution
Asynchronous scheduling using Microtasks is probably the easiest and most stable solution. Other asynchronous scheduling techniques may be used depending on the specific use case.
This test case shows how performance takes a hit when state is managed and propagated to components outside of scopes known to React, here by RxJS observables. React will re-render each component separately.
The test results of this scenario represent the baseline for any further performance improvements.
The following chart shows how each state change leads a render step (re-rendering all components) that consists of multiple updates (re-rendering one component).
A single update (one component re-renders) is very quick (about 0.05ms).
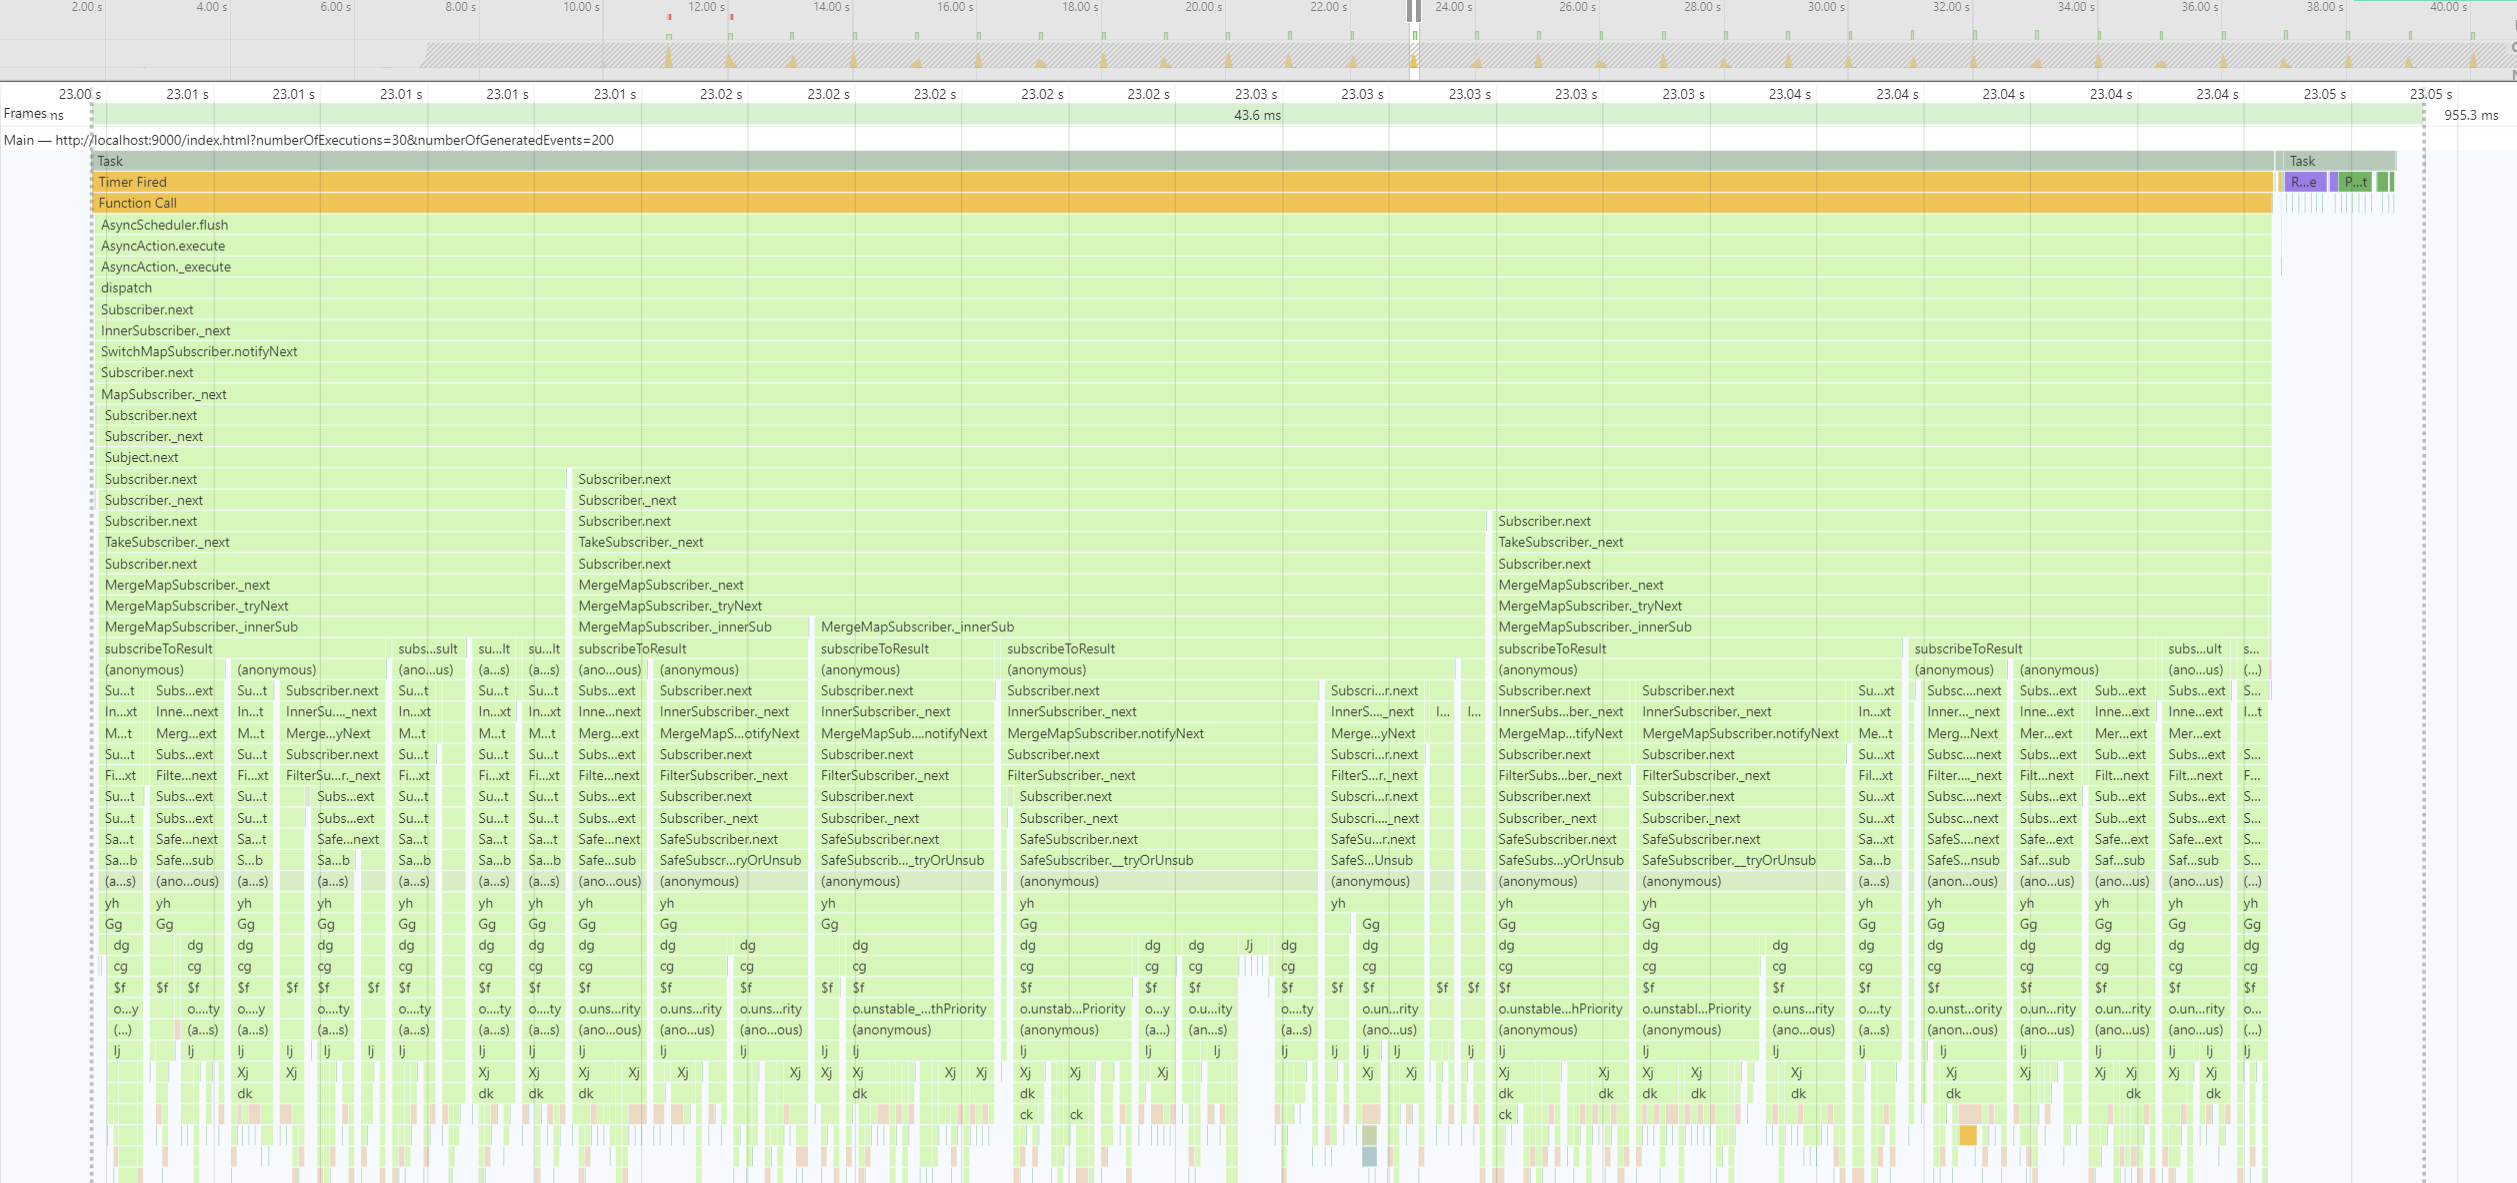
Although each single update (one component re-renders) is very quick, running all those updates separetely - with React being unable to optimize across those updates - takes time. On average, we are talking about 9.5ms to 10ms, which is way too much when considering a common frame budget (16.66ms).
Wow, that is one busy tracing profile! We can see lots of fragmentation, the lower parts representing the function calls of React re-rendering components separately.
In this test case, we schedule state changes instead of executing them right away, and then flush them manually (batched up) once all state changes are propagated to components. In particular, we flush all tasks after every observable subscriber has processed the new value.
Implementation pointers:
The following chart shows that now each render step (re-rendering all components) contains only one update that now re-renders all components at once instead of separately.
A single update equals a single render. On average, all component re-render at 1.8ms to 1.9ms time, which breaks down to a theoratical component re-render time of 0.01ms.
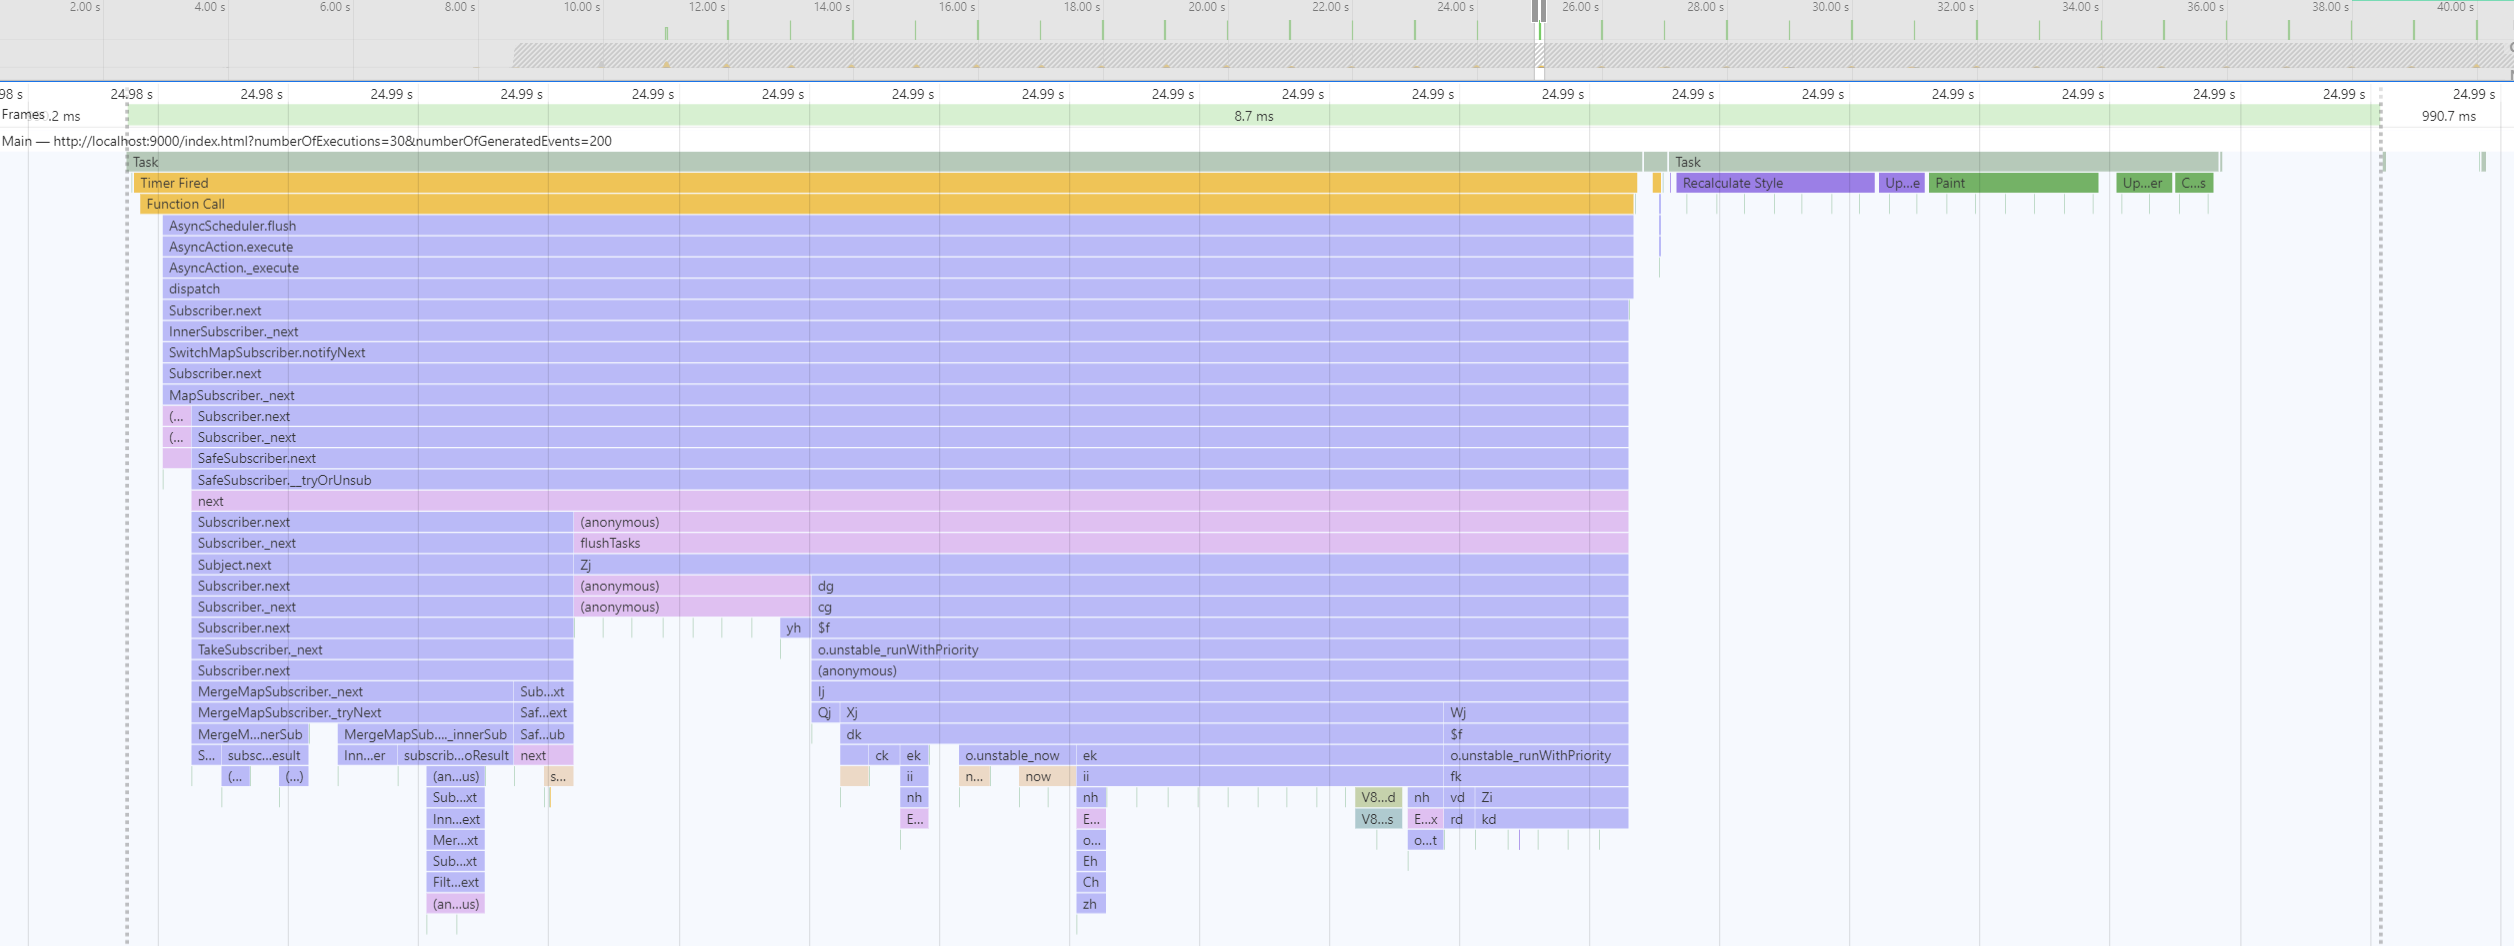
This tracing profile looks very clean, very few function calls compared to the not-scheduled test case.Everything is executed within one synchronous block of code, even scheduled renderings.
In this test case, we schedule state changes instead of executing them right away in the form of Microtasks, meaning that the browser will automatically flush all tasks once the currently running synchronous code has been completed and previsouly scheduled Microtasks have been executed.
In order to schedule a Microtask, we use the
queueMicrotask() API:
queueMicrotask(callbackFn);As a fallback / polyfill (e.g. for older browsers), we could also use Promises to schedule a Microtask:
Promise.resolve().then(callbackFn);Implementation pointers:
The following chart shows that now each render step (re-rendering all components) contains only one update that now re-renders all components at once instead of separately.
A single update equals a single render. On average, all component re-render at 1.8ms to 1.9ms time, which breaks down to a theoratical component re-render time of 0.01ms.
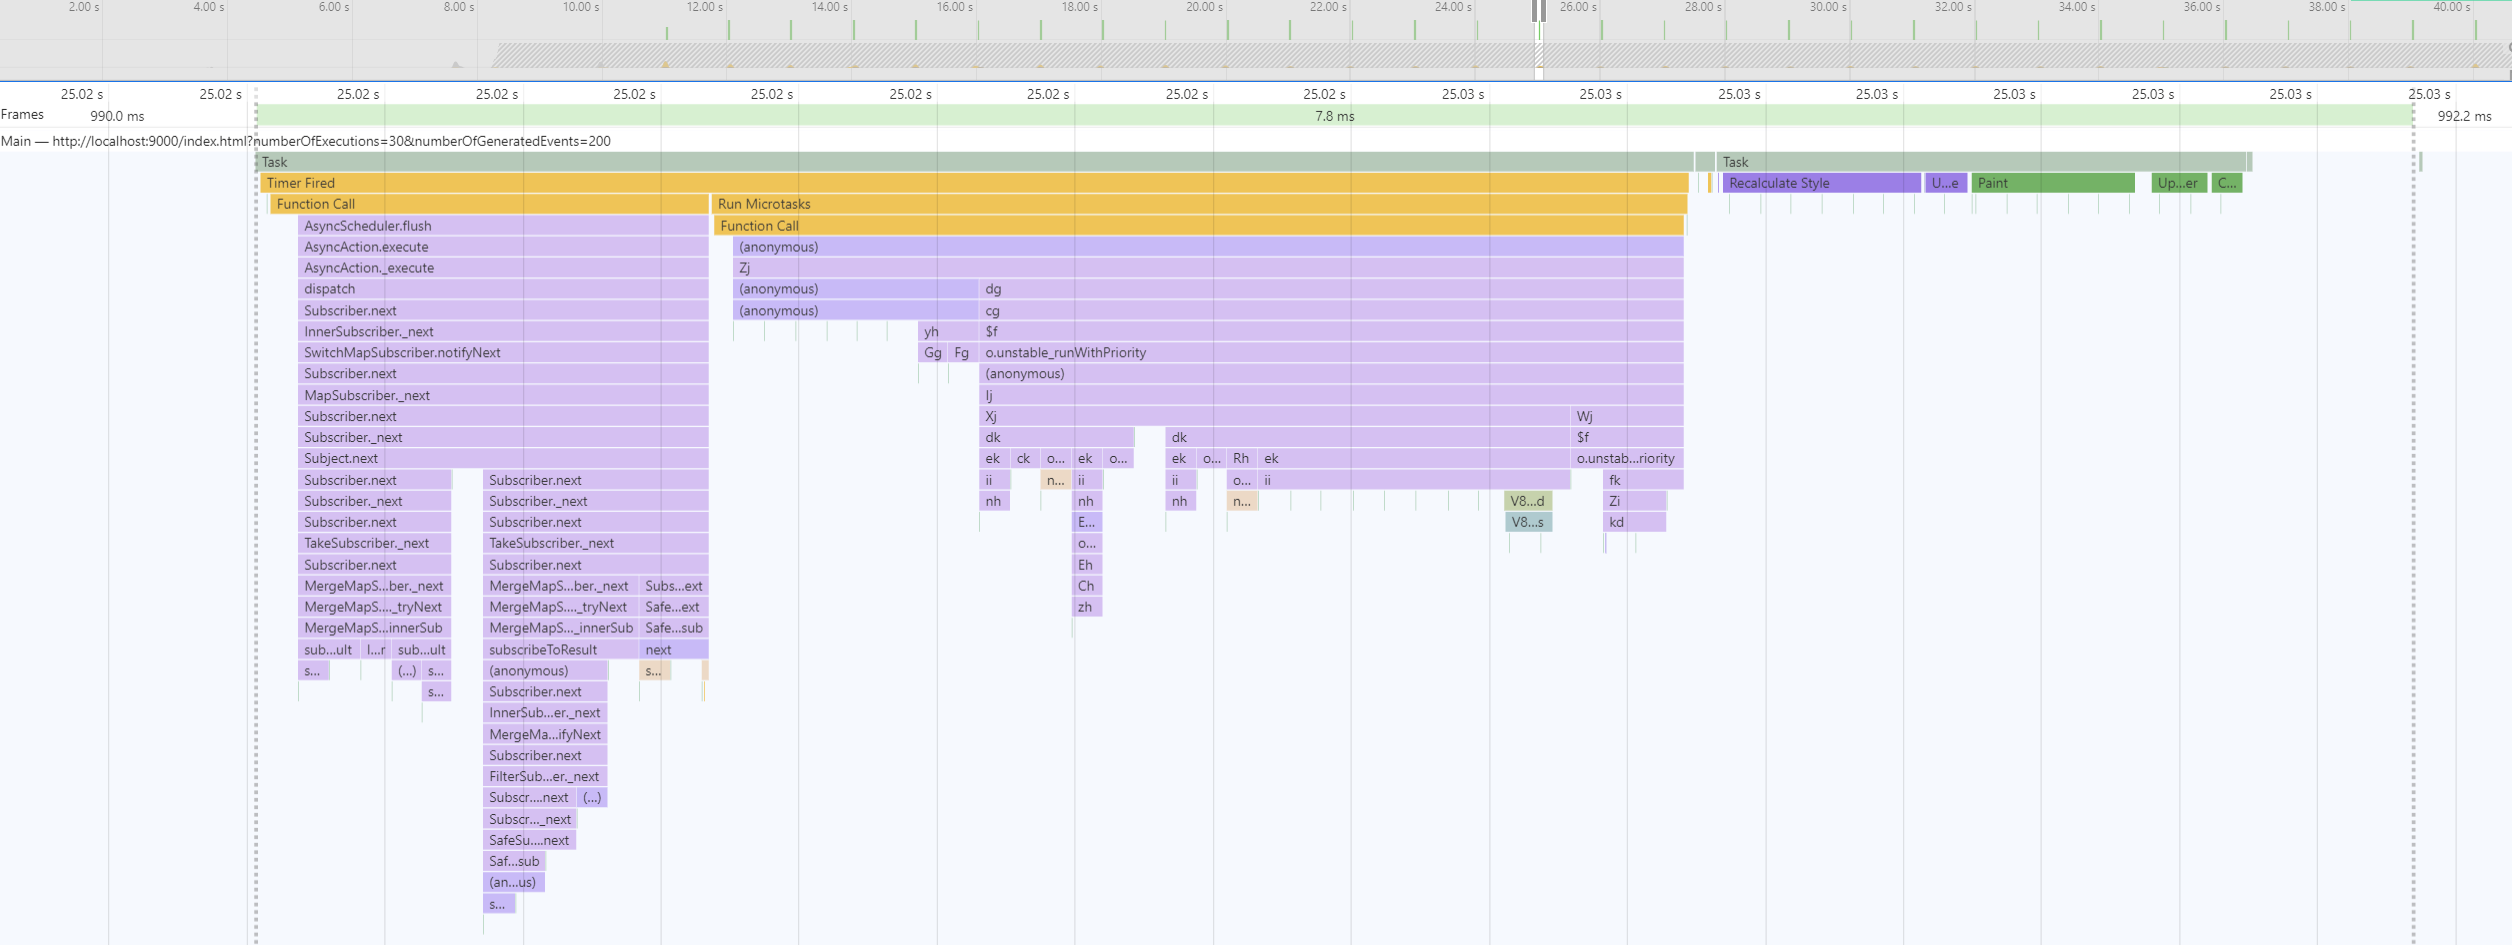
This tracing profile looks very clean, very few function calls compared to the not-scheduled test case. Everything is executed within the same Macrotask, the first synchronous block containing the state change and its propagation to the components, the second Microtask block being the execution of all scheduled renderings right after.
In this test case, we schedule state changes instead of executing them right away in the form of Macrotasks, meaning that the browser will automatically flush all tasks once the currently running synchronous code has been completed and all scheduled Microtasks have been executed. It's important to note that the browser might render an update on screen before our scheduled code executes.
In order to schedule a Macrotask, we use the
setTimeout() API with a timeout of zero:
setTimeout(callbackFn, 0);Implementation pointers:
The following chart shows that now each render step (re-rendering all components) contains only one update that now re-renders all components at once instead of separately.
A single update equals a single render. On average, all component re-render at 1.8ms to 1.9ms time, which breaks down to a theoratical component re-render time of 0.01ms.
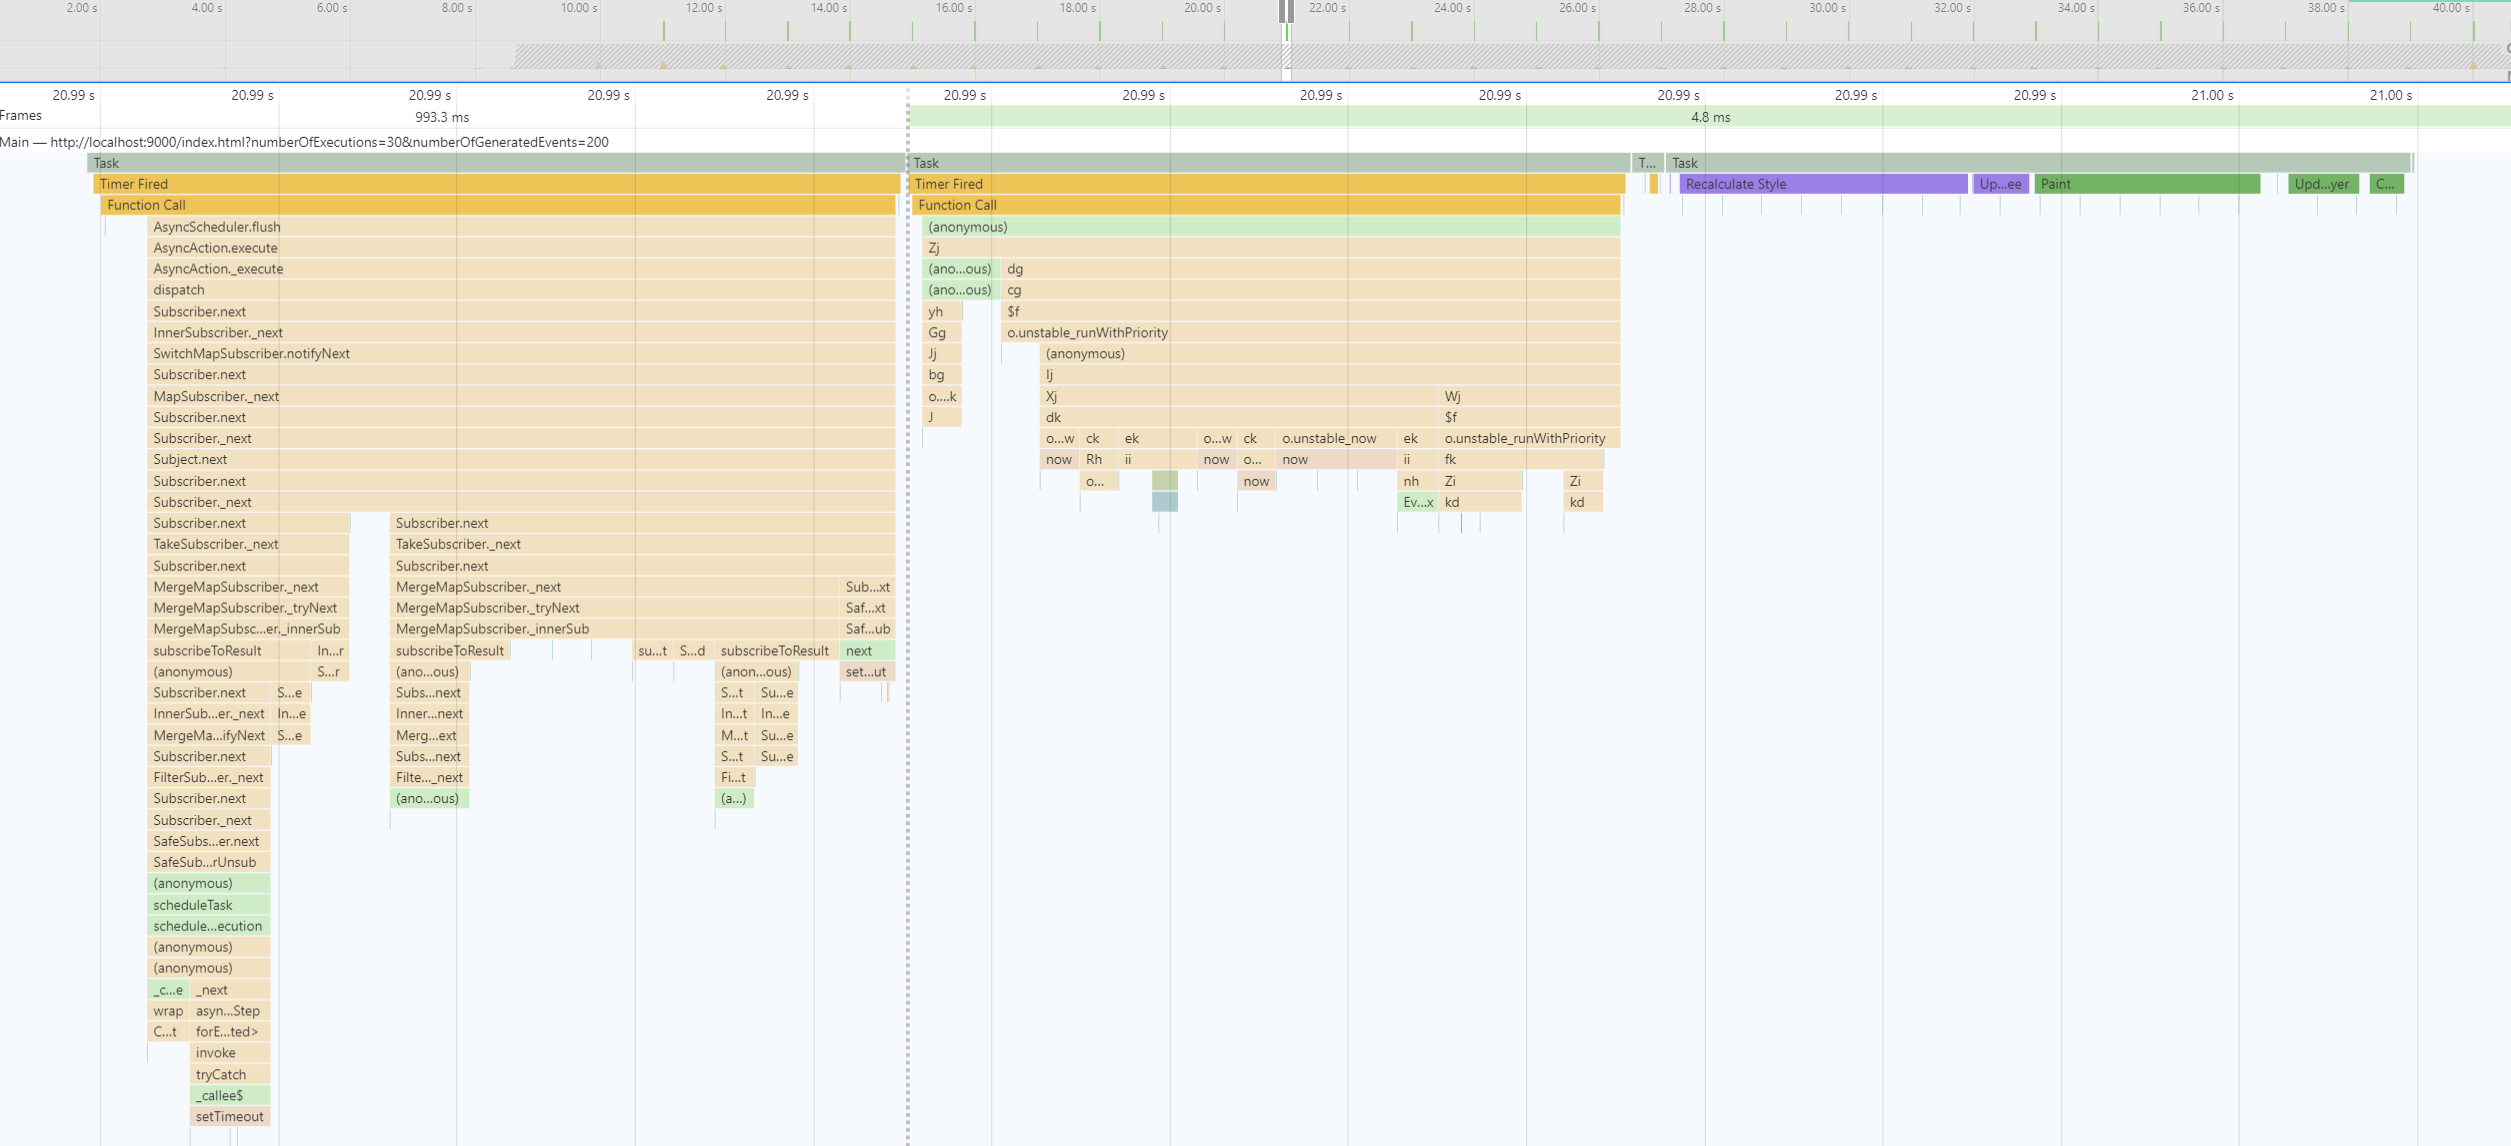
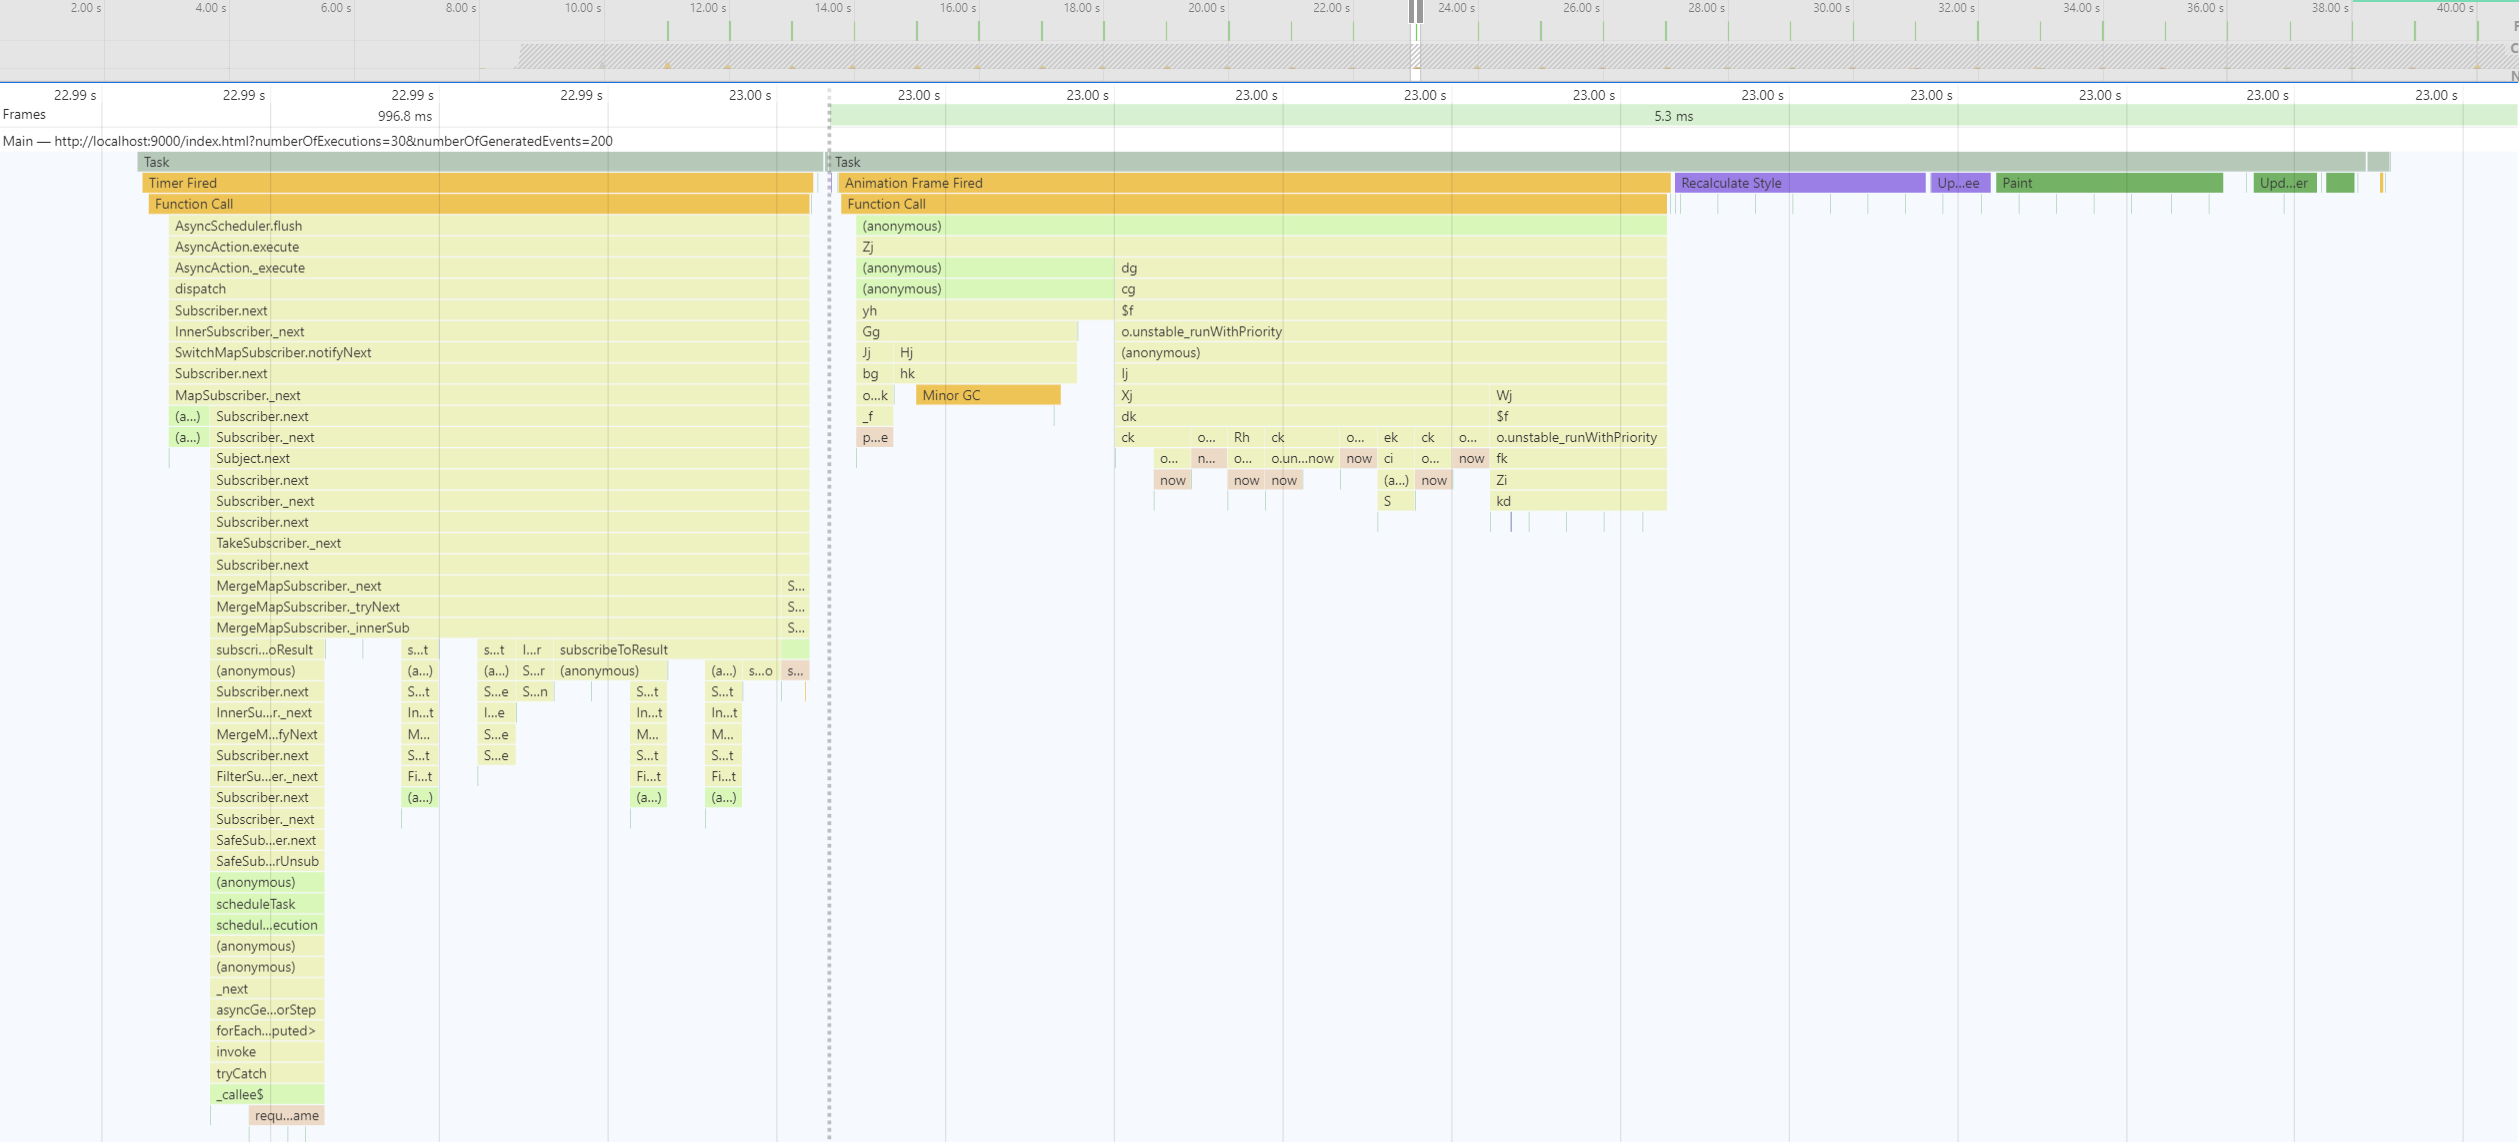
This tracing profile looks very clean, very few function calls compared to the not-scheduled test case. The first Macrotask contains the state change and its propagation to the components, the second Macrotask runs all scheduled renderings. We can also clearly see how the browser decided to render a frame in between, which might happen when using Macrotasks for scheduling purposes.
In this test case, we schedule state changes instead of executing them right away by deffering them to the render cycle, meaning that the browser will automatically flush all tasks right before it renders on screen.
In order to schedule based on the render cycle, we use the
requestAnimationFrame() API:
requestAnimationFrame(callbackFn);Implementation pointers:
The following chart shows that now each render step (re-rendering all components) contains only one update that now re-renders all components at once instead of separately.
A single update equals a single render. On average, all component re-render at 1.8ms to 1.9ms time, which breaks down to a theoratical component re-render time of 0.01ms.
This tracing profile looks very clean, very few function calls compared to the not-scheduled test case. The first Macrotask contains the state change and its propagation to the components, the second block runs all scheduled renderings right before the browser renders on screen.
Bonus time: Let's test that fancy cool new React concurrent mode. Here, we don't have
a manual scheduler in place. Instead, we use the new ReactDOM.createRoot() function to instantiate our application, thus enabling
concurrent mode, and otherwhise develop our application like we are used to.
Note: React concurrent mode is still highly experimental, and requires the application to run properly in strict mode!
The following chart shows that now each render step (re-rendering all components) contains only one update that now re-renders all components at once instead of separately.
A single update equals a single render. On average, all component re-render at 1.8ms to 1.9ms time, which breaks down to a theoratical component re-render time of 0.01ms.
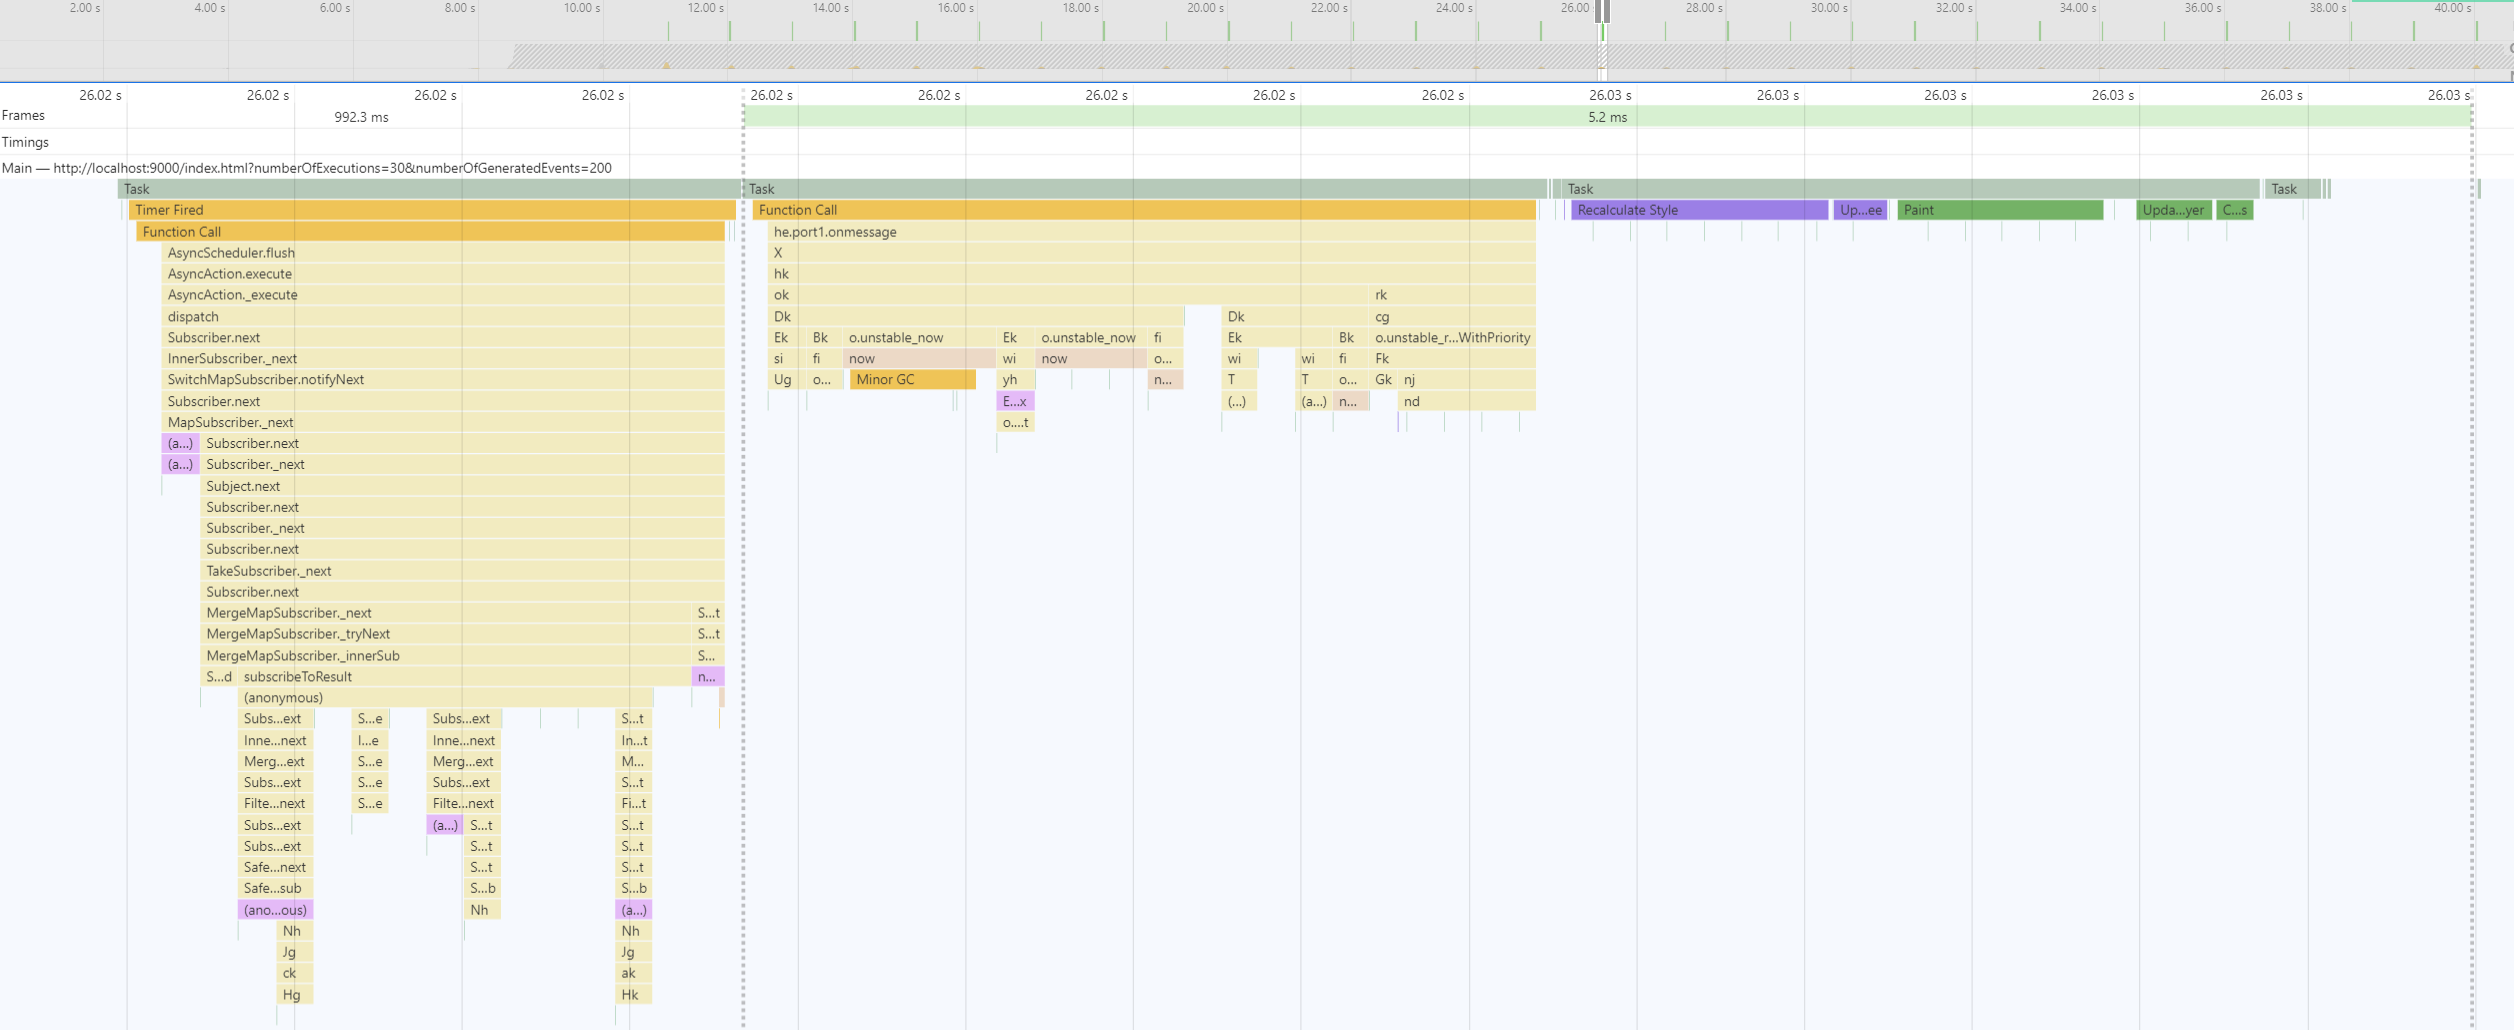
This tracing profile looks very clean, very few function calls compared to the not-scheduled test case. The first Macrotask contains the state change and its propagation to the components. It seems that the React Concurrent Mode decided to schedule re-renderings into a separate Macrotask, using setTimeout(callbackFn, 0) - interesting!


