🎟Using Plotly to visualize data
This project uses Plotly to build interactive charts for the web using Pyhton.
Motivation
D3.js is an awesome Javascript library but often times our goal is just to build a visualization with some well-known charts. Plotly is a great tool for that
Charts
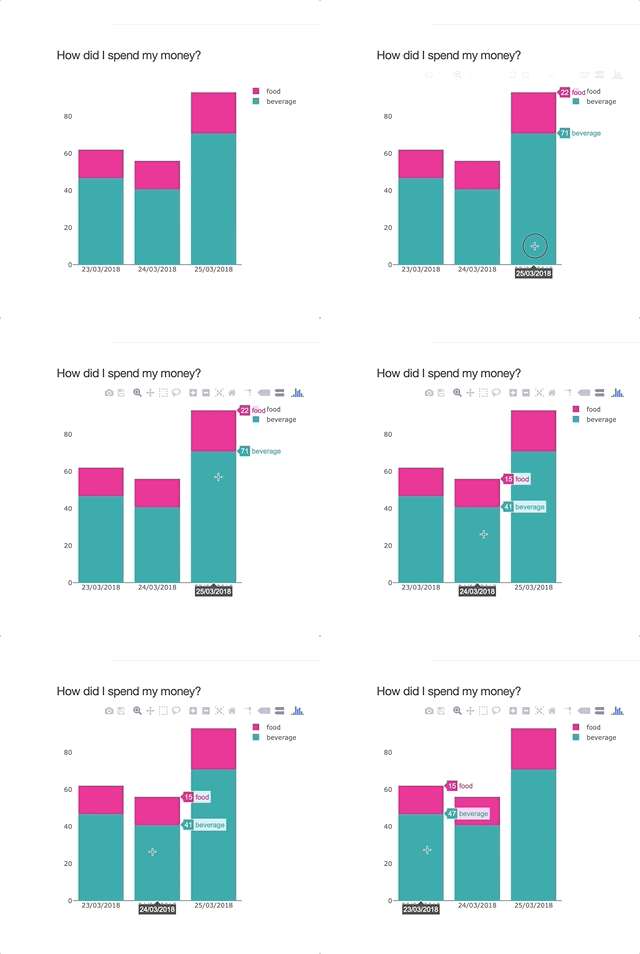
Stacked bar chart
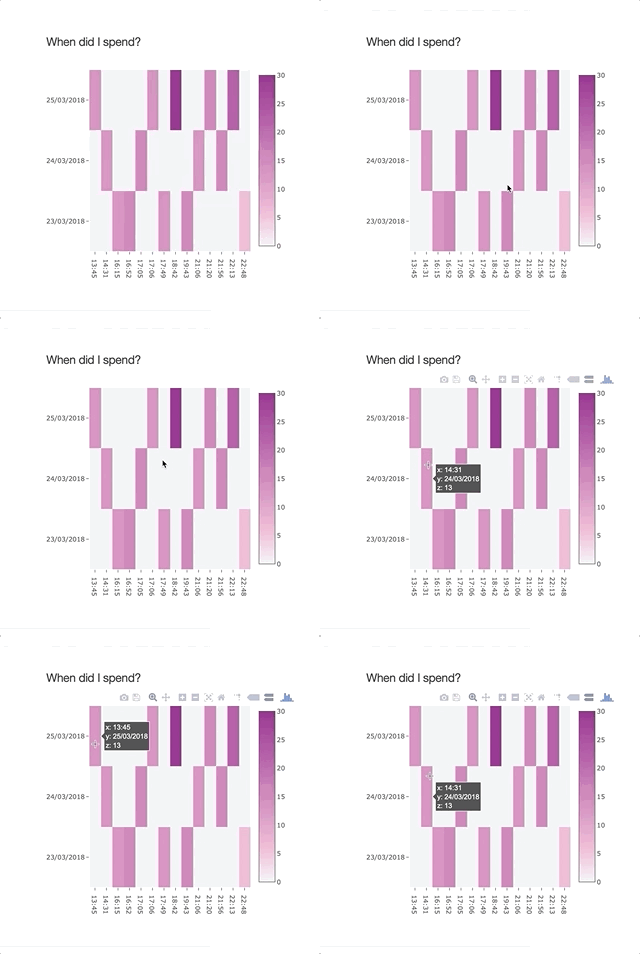
Heatmap
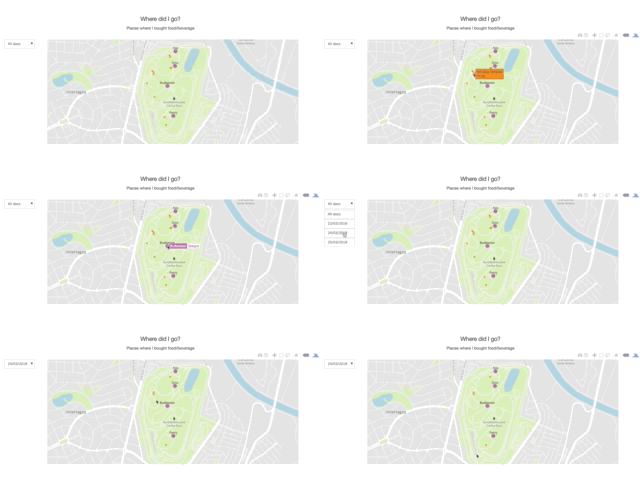
Map
Table
How to use?
Run python3 name_of_the_chart.py


