This is a Python package to write GRF files, a format readable by DPLOT - a visual graphing software developed by Hydesoft Computing. This package and its developers currently have no relationship with the DPLOT team or Hydesoft.
It can also write data directly into an open DPlot window using Dynamic-Data Exchange (DDE), which DPlot maintains to work with VBA scripts. If DPlot is open, 2-D curves can be written to a new plot inside DPlot.
This package was developed after constant requests of my boss to input data into DPLOT for their use. Instead of processing in Python, exporting as a csv, and then importing into DPLOT, I developed this package to expedite the process.
The package runs on Python 3.7 and requires the CSV and win32ui packages as a dependency.
Create a curve:
import dplotpy as dp
import numpy as np

# Create some data
x = np.linspace(0, 2*np.pi, 100)
y_sin = np.sin(x)

# Create a Curve
sin_curve = dp.curve(x, y_sin)

# Add a title to curve
sin_curve.title = 'Sine Wave'
Create a XY Plot and with a curve:
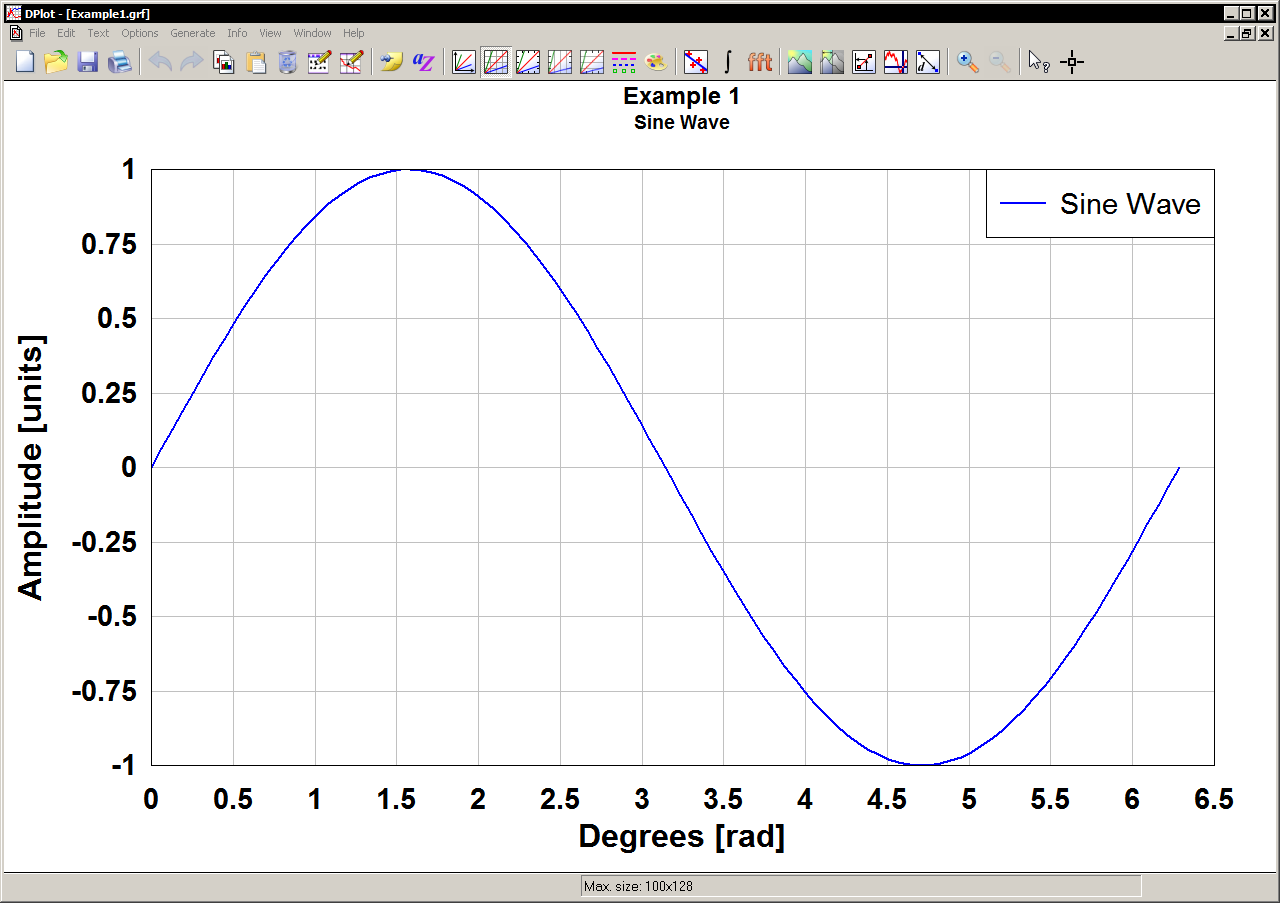
sin_plot = dp.xyplot(sin_curve, title='Example 1', subtitle='Sine Wave', xlabel='Degrees [rad]', ylabel='Amplitude [units]')

# Save the file
sin_plot.save('Example1')
Create a new plot. Add curve to plot:
y_cos = np.cos(x)
cos_plot = dp.xyplot()
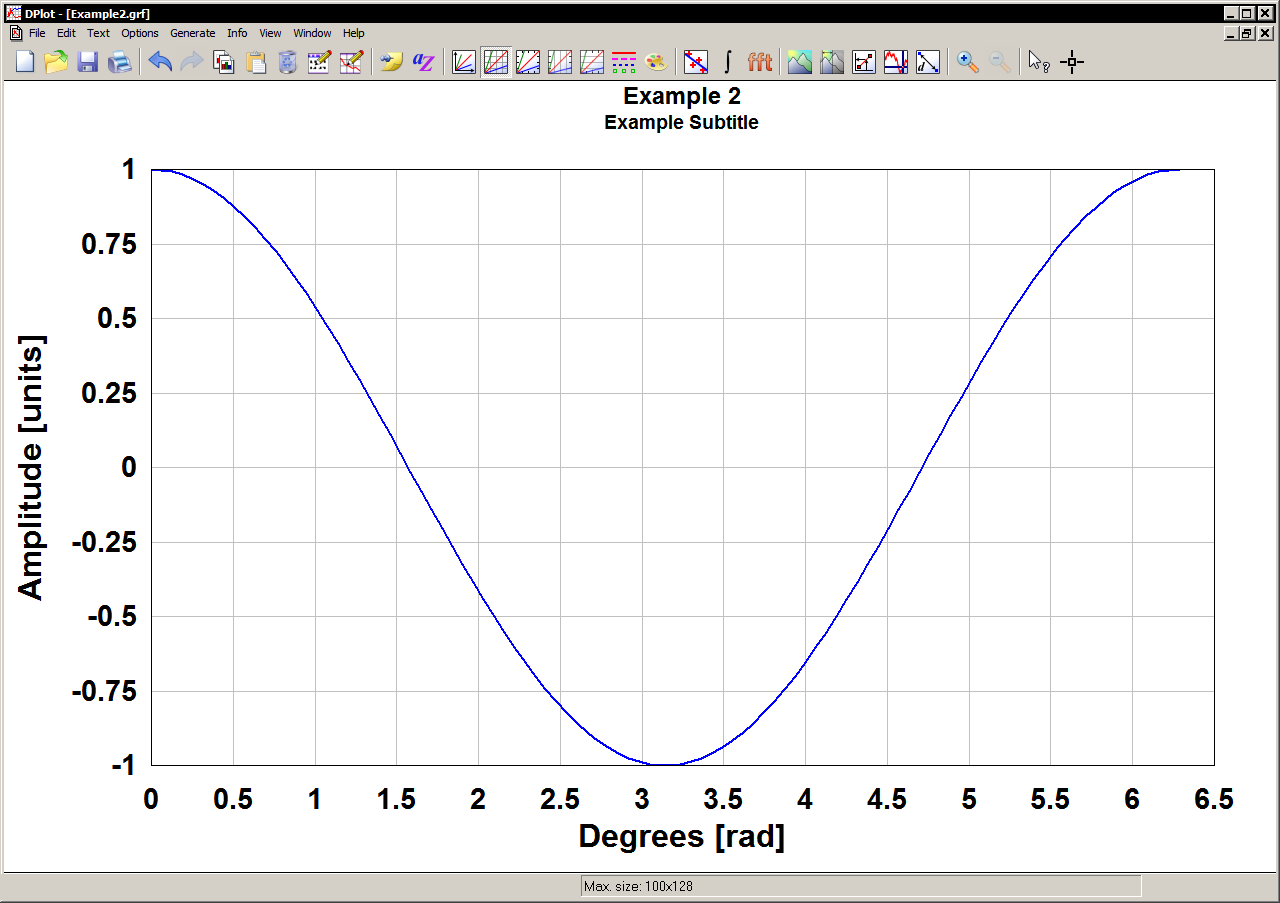
cos_plot.add_curve(cos_curve)
cos_plot.title = 'Example 2'
cos_plot.subtitle = 'Example Subtitle'
cos_plot.xlabel = 'Degrees [rad]'
cos_plot.ylabel = 'Amplitude [units]'
cos_plot.legend = False
cos_plot.save('Example2')
Add multiple curves to a plot:
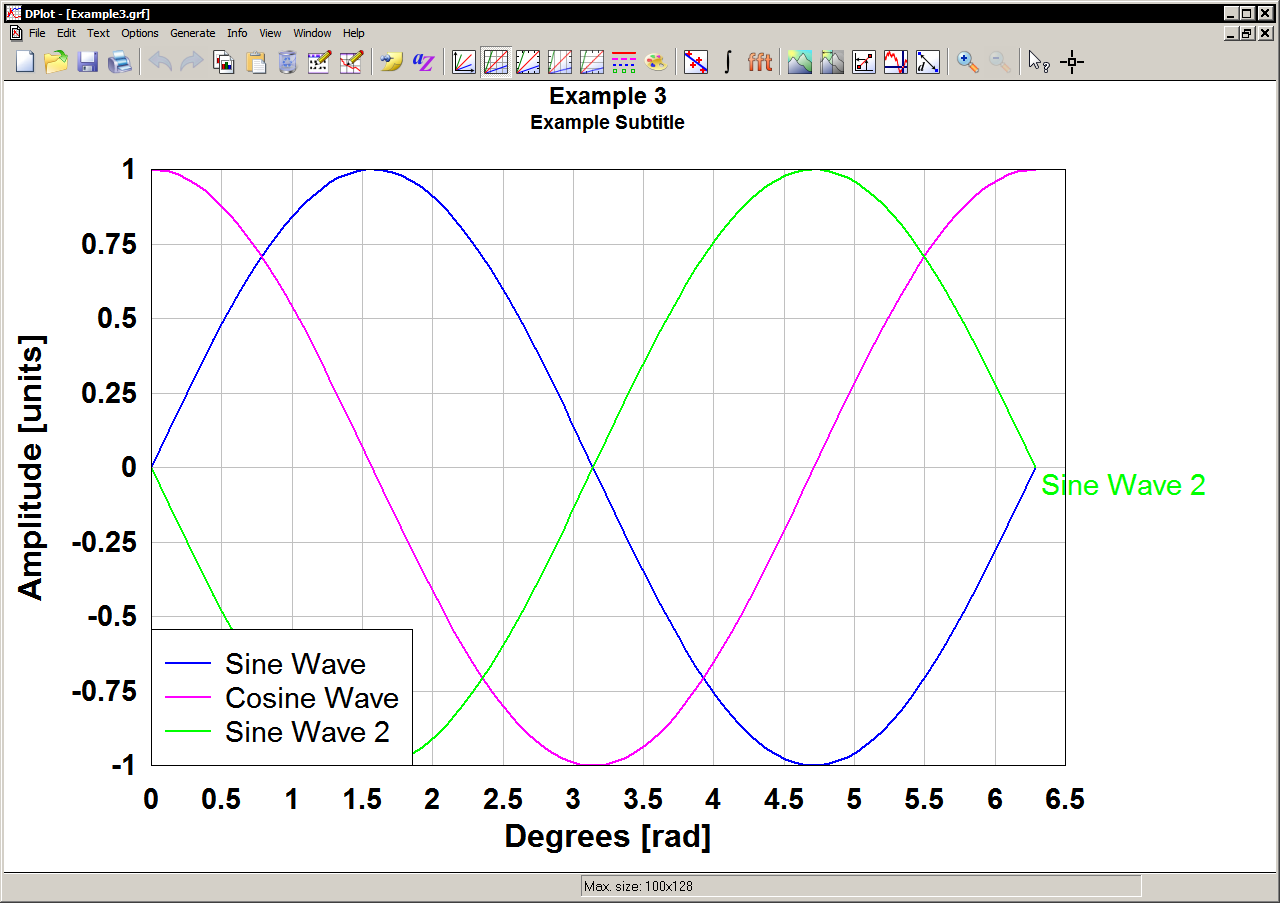
all_plot = dp.xyplot(sin_curve)
all_plot.add_curve(cos_curve)
all_plot.add_curve(sin2_curve)
all_plot.title = 'Example 3'
all_plot.subtitle = 'Example Subtitle'
all_plot.xlabel = 'Degrees [rad]'
all_plot.ylabel = 'Amplitude [units]'
all_plot.legend = [0,1]
all_plot.legendalight = [0,2]
all_plot.save('Example3')
Show plots in an active DPlot instance:
all_plot.show()

