Integrate time tracking app aTimeLogger, note taking app Evernote and Mac productivity app Alfred to easily generate self time analysis report.
Early. In latest update, transform developing environment from Jupyter Notebook to PyCharm. Making it more like a program.
It is highly customized, so currently only myself.
- Design: This program is full of functions, without Object-Oriented Design. Next step is to learn and practice how to design this program in OOD.
- Edit: The whole database is based on data in aTimeLogger. Changes in local database will not affect remote data, and each time I change historical entries or types settings in aTimeLogger, I have to rebuild my local database.
- Depth: The analysis stays on descriptive level, need to dig deeper for more useful and hidden relations.
My final goal is to build a webapp to replace aTimeLogger as my customized time tracking tool, for more flexibility to edit data and better integration with task management system. But this will not happen very soon, both my knowledge and time are not enough.
After retrieving all history data from aTimeLogger, building MySQL database, for each day/week/month, simply use Alfred to choose an action:
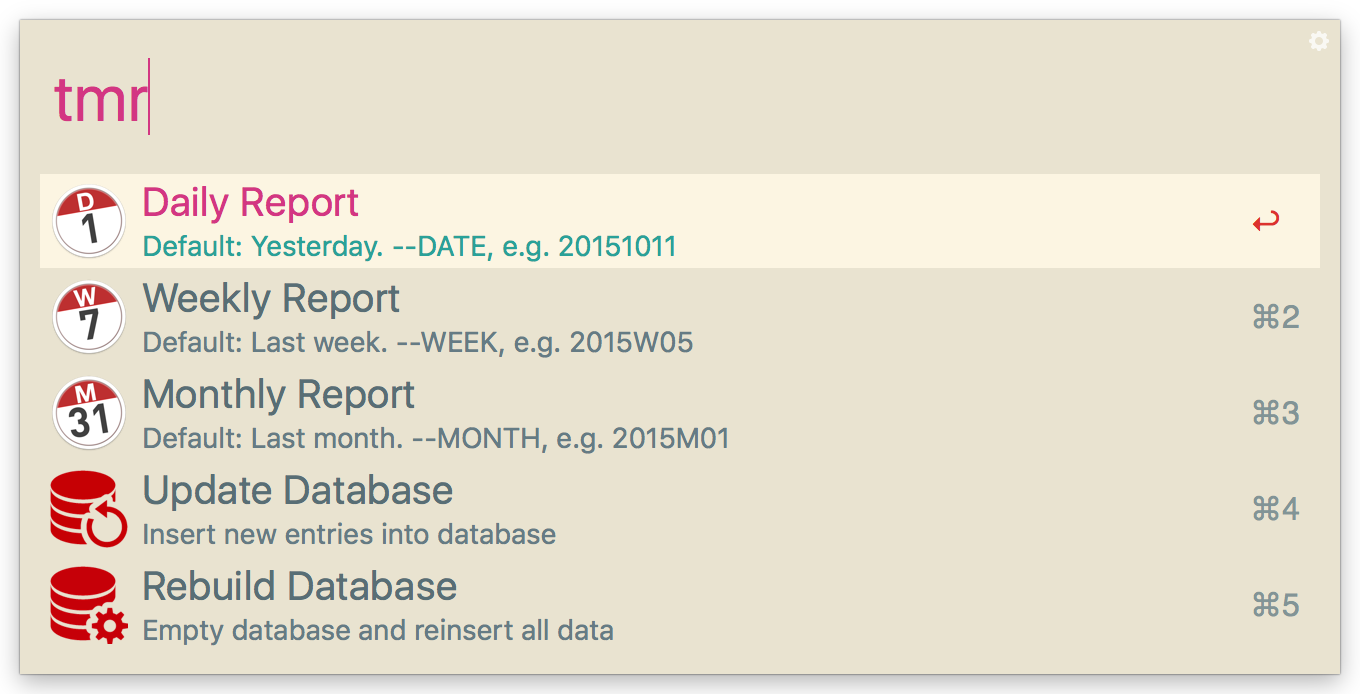
Underlying procedures:
- Get new data from aTimeLogger API, update database.
- Utilize pandas, numpy to transform, aggregate, analyze data according to different time frame.
- Draw plots and tables in matplotlib, save in files. See 'Gallery' for examples.
- Create note via Evernote API, add images and headings, push to my Evernote account.
I use 'Comment' filed in aTimeLogger as Task or some activity I want to highlight, then aggregate its statistics everyday for morning review.
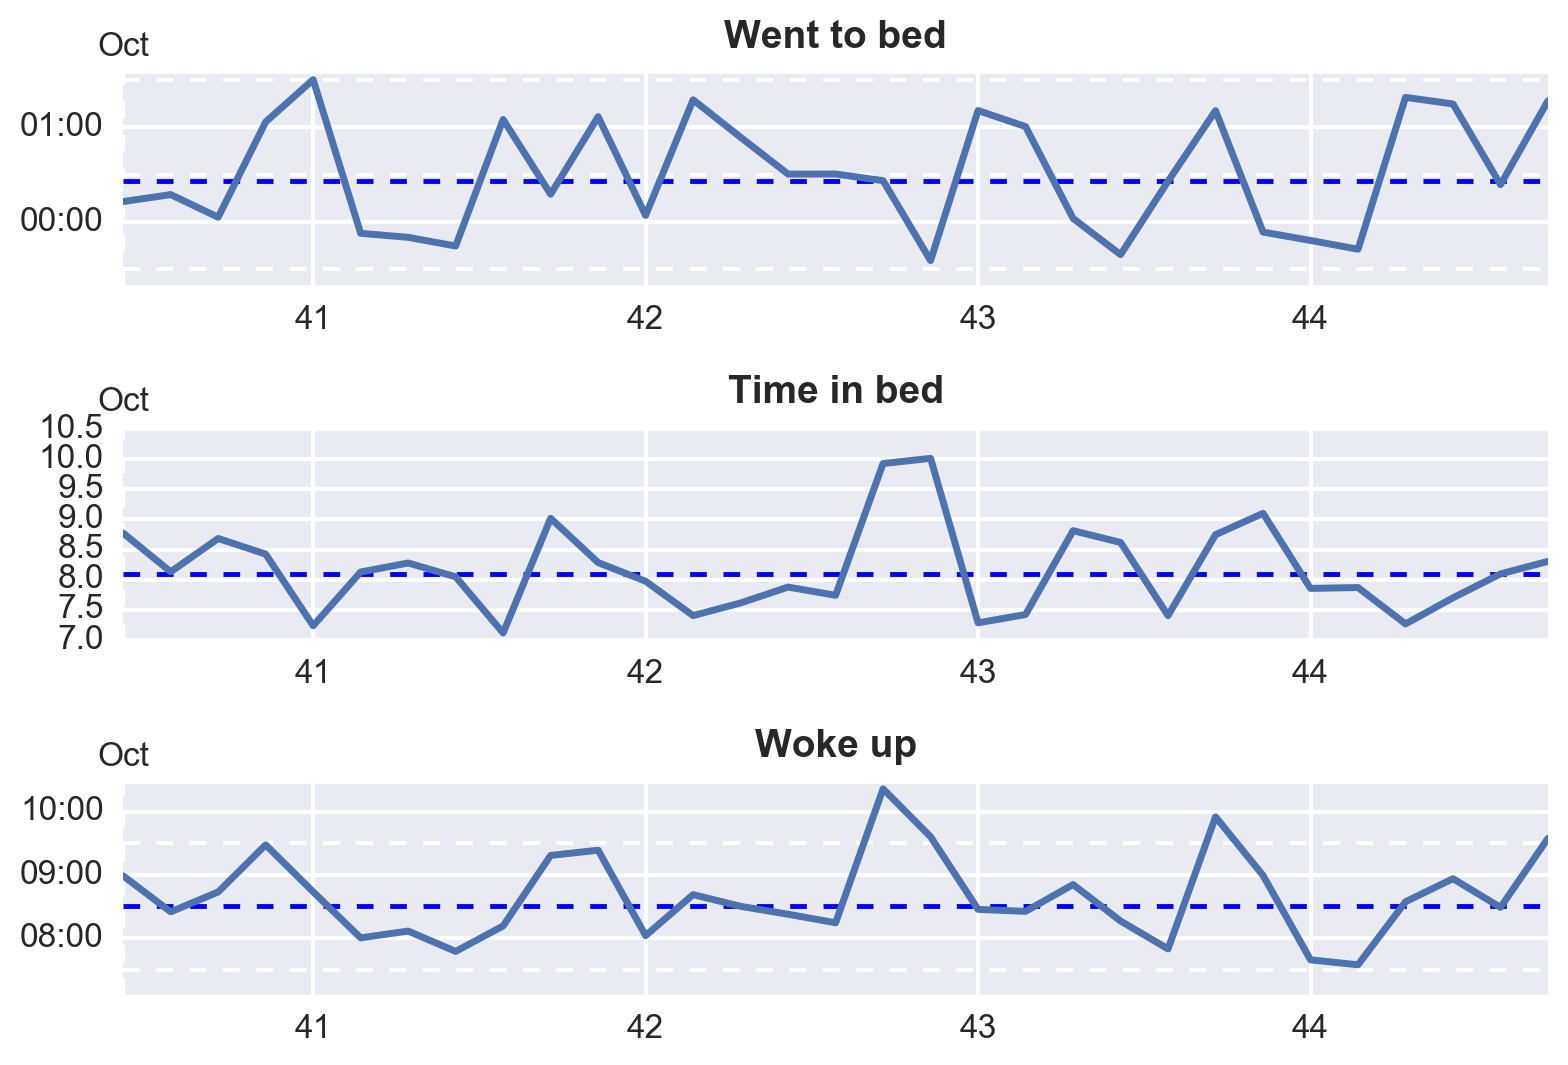
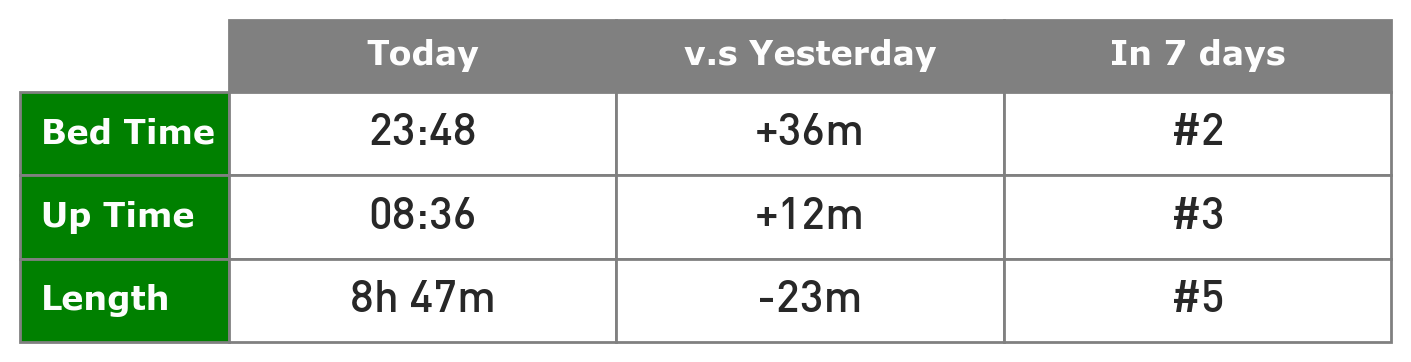
Analyze sleep conditions for weekly or monthly review. Inspired by app Sleep Cycle. In this picture (monthly report), X axis bottom is week number, top is month abbreviation.
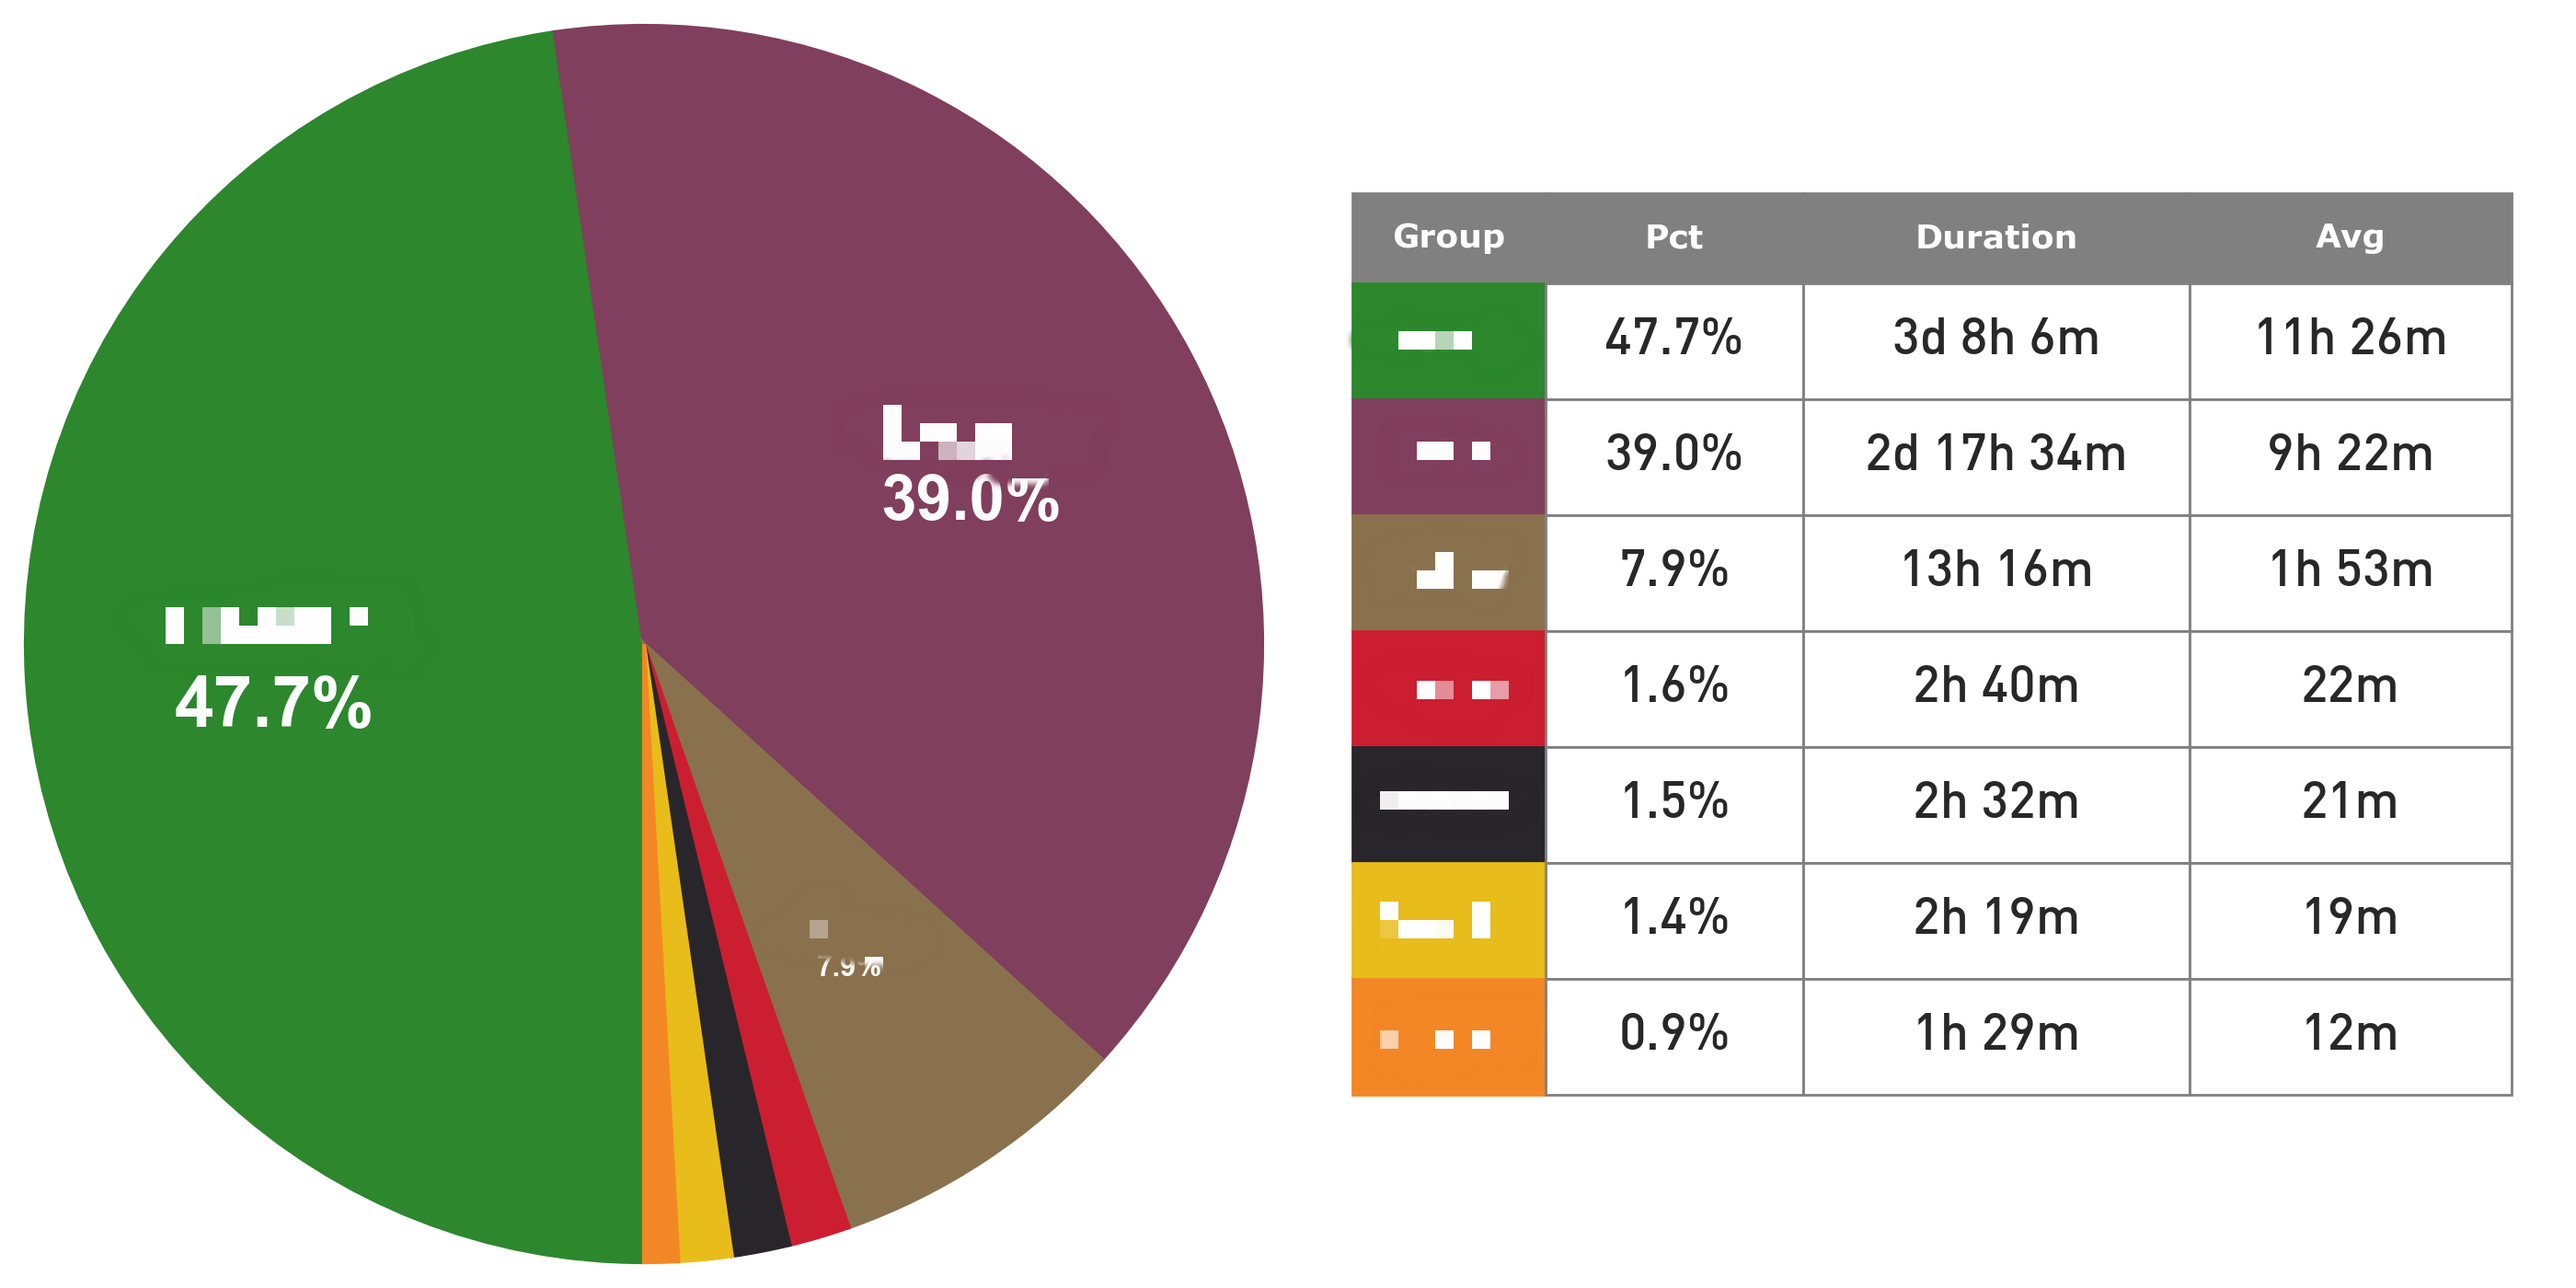
Pie chart for each group to see total conditions. Mimic the pie chart in aTimeLogger, but add Average statistic.
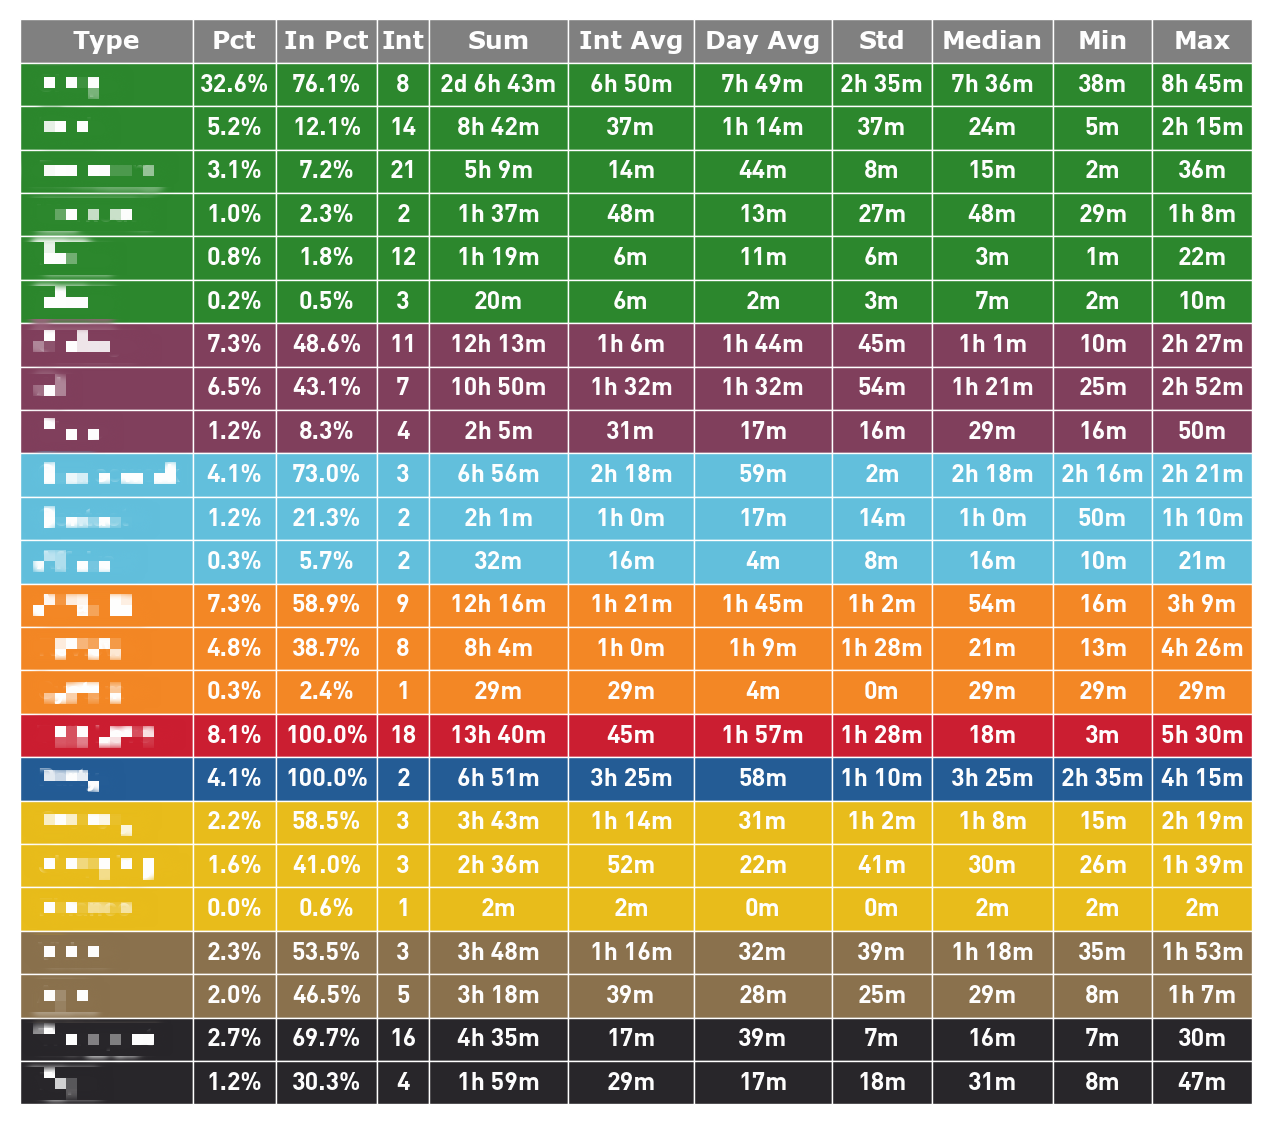
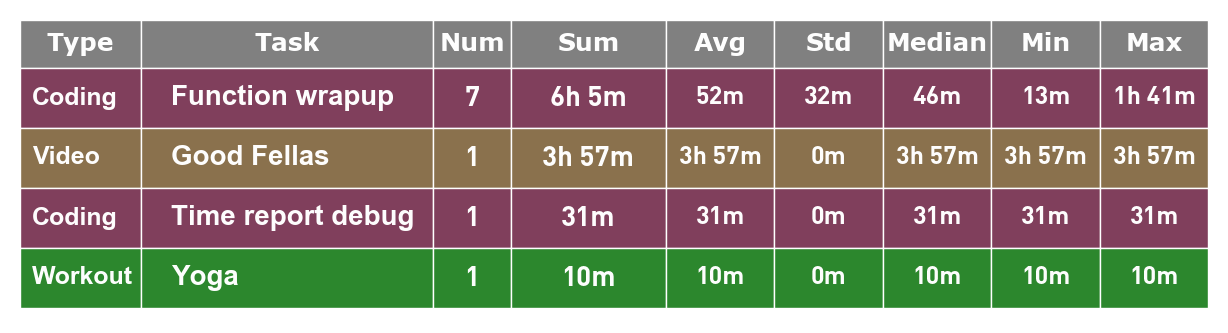
Type detailed table replicate the 'Detail' function in aTimeLogger with a lot more statistics.
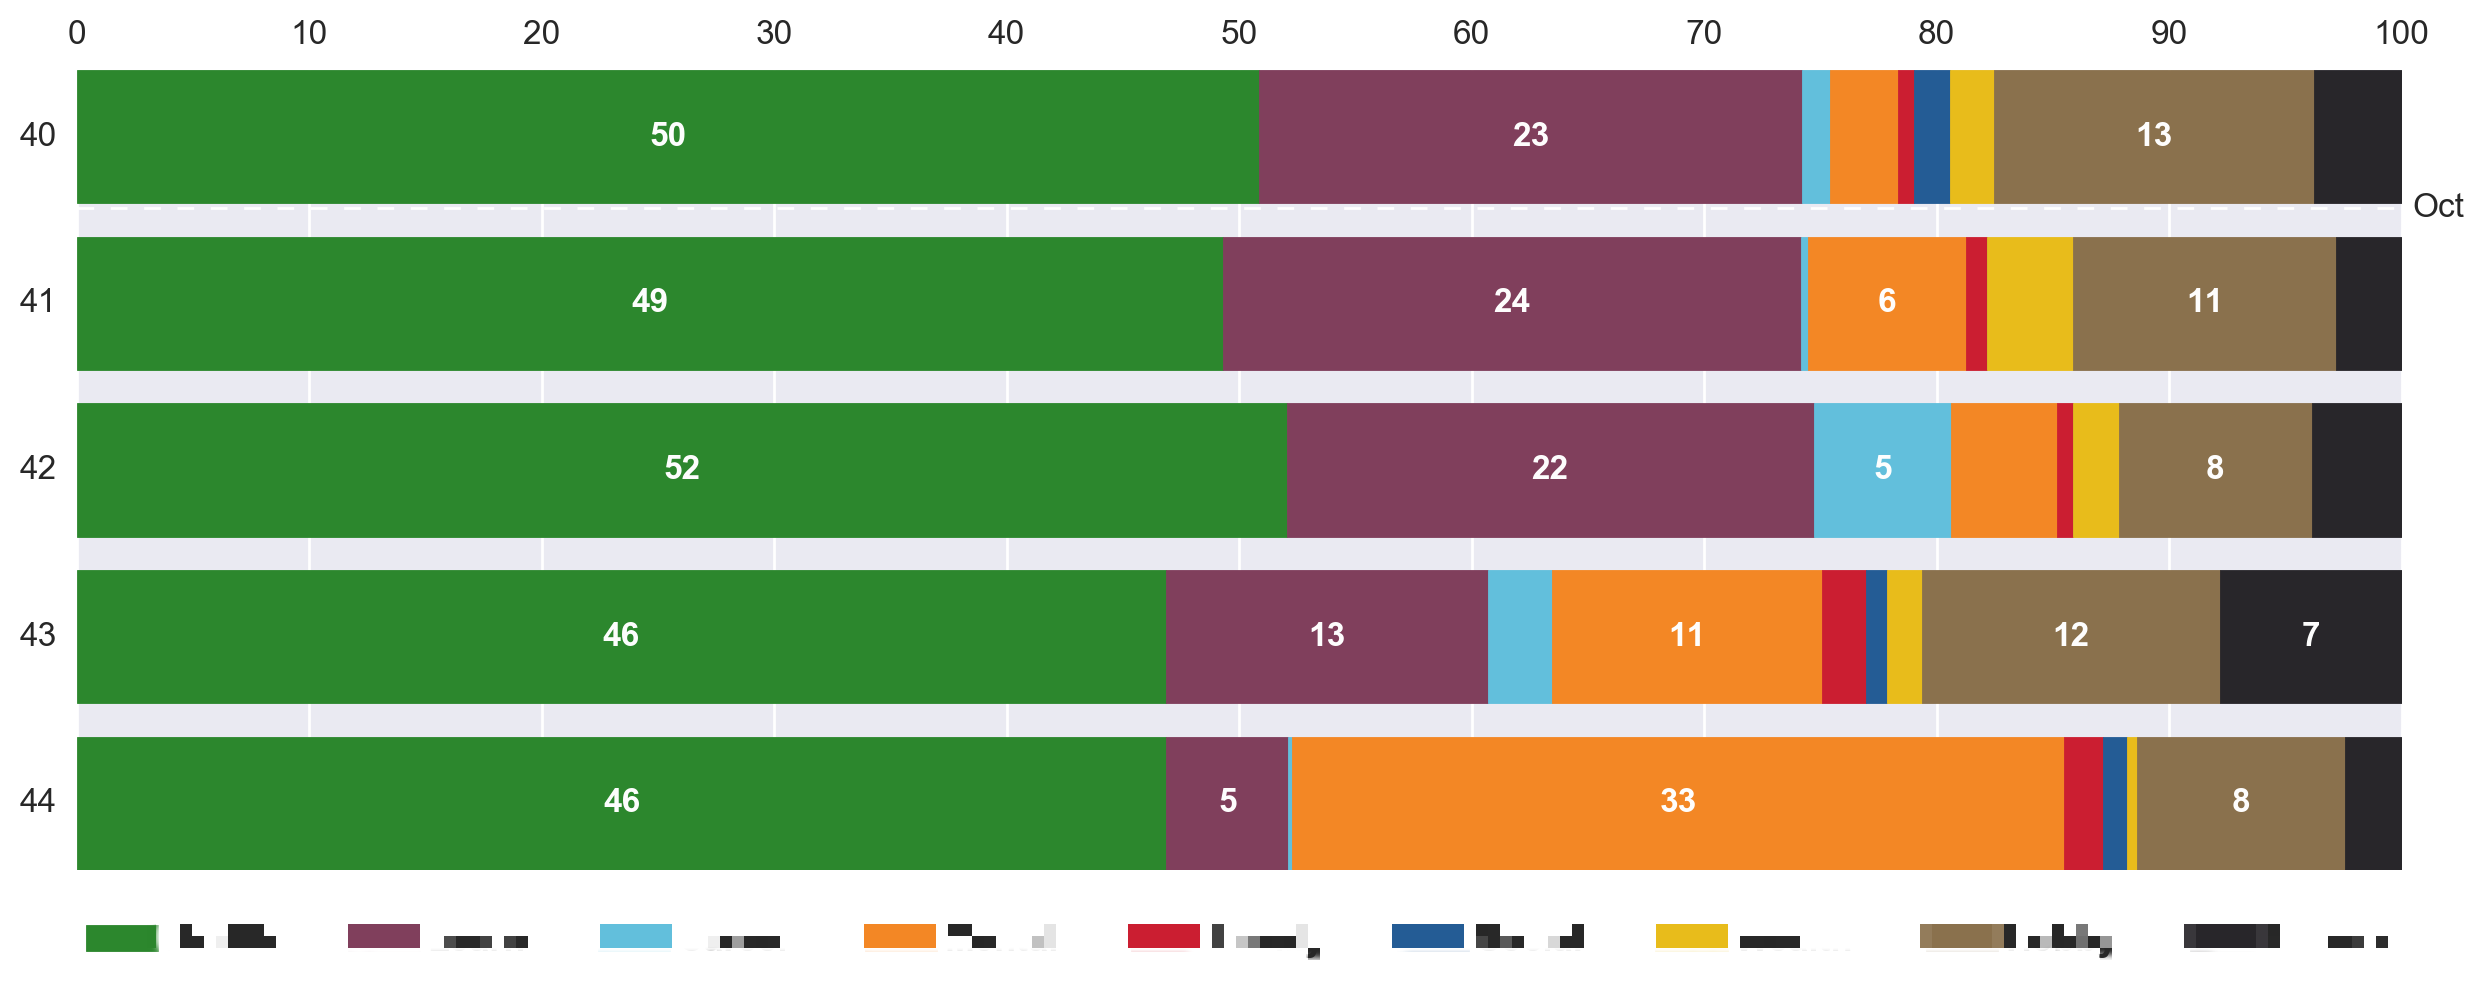
Stacked bar chart (horizontal) to see group trends inside a month or a week. Numbers in bar represents its percentage.
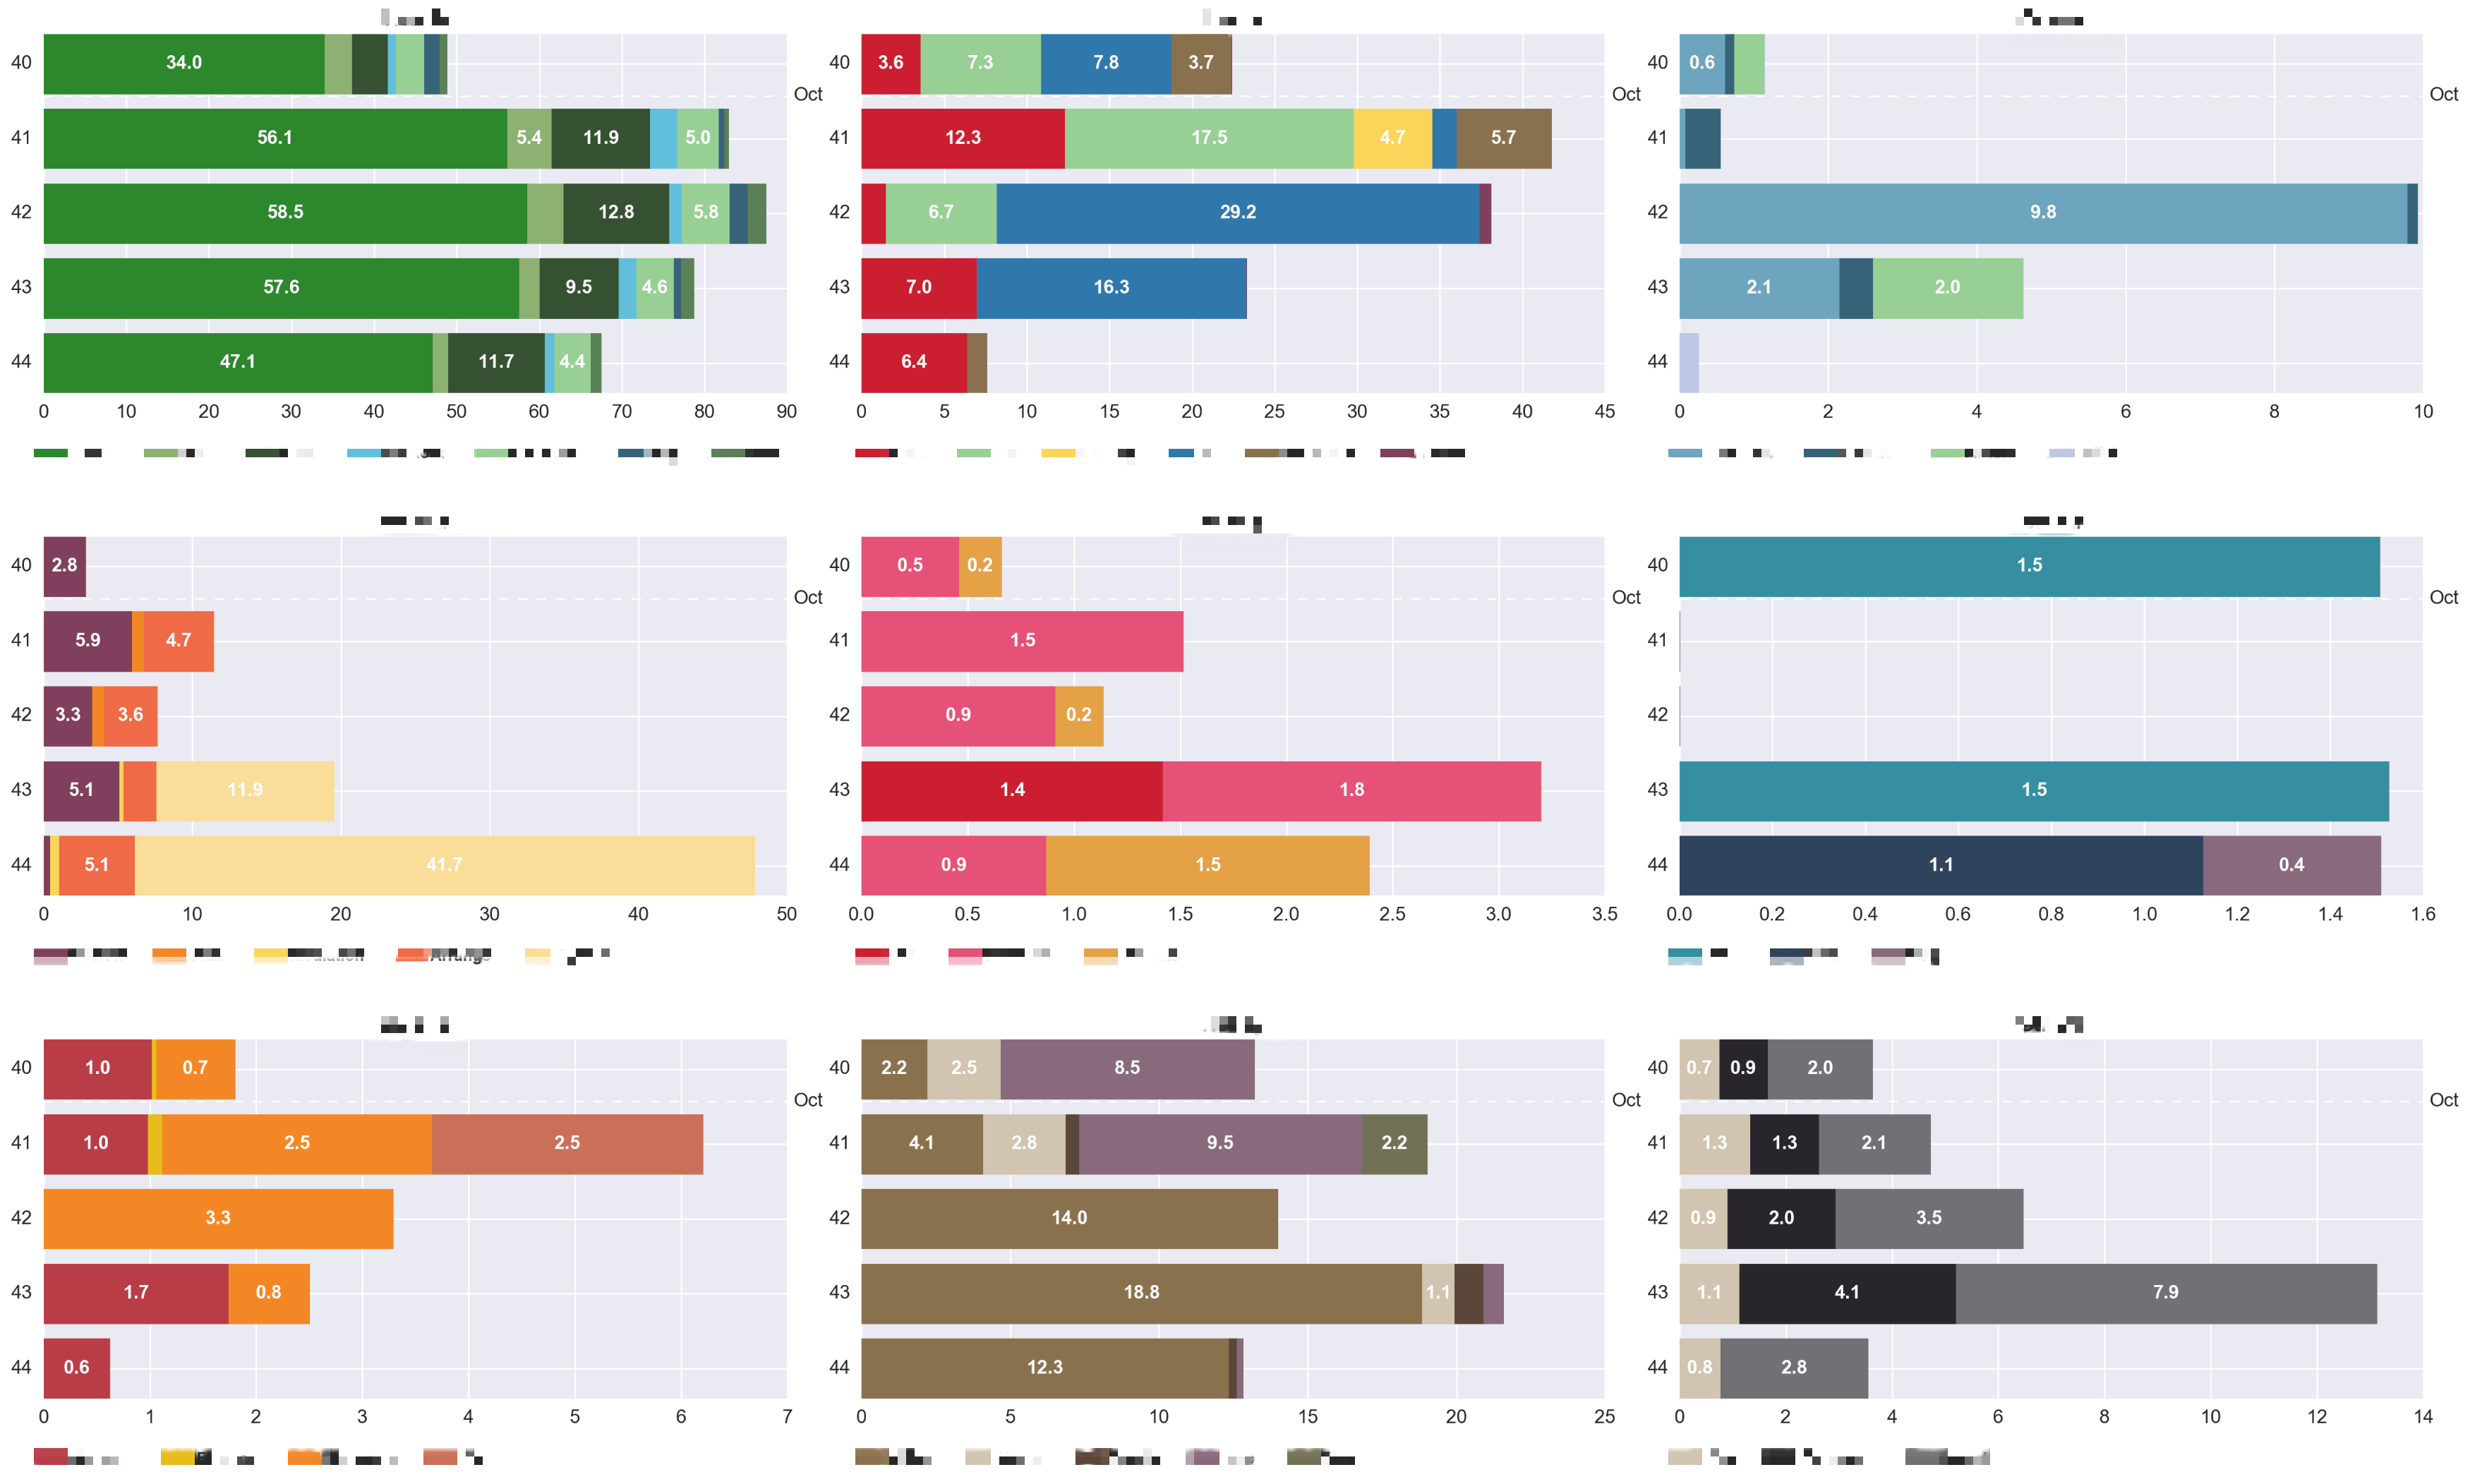
This 3x3 grid stacked bar chart (horizontal) to get the trends of each types in given time frame. Numbers in bar represents its hours.
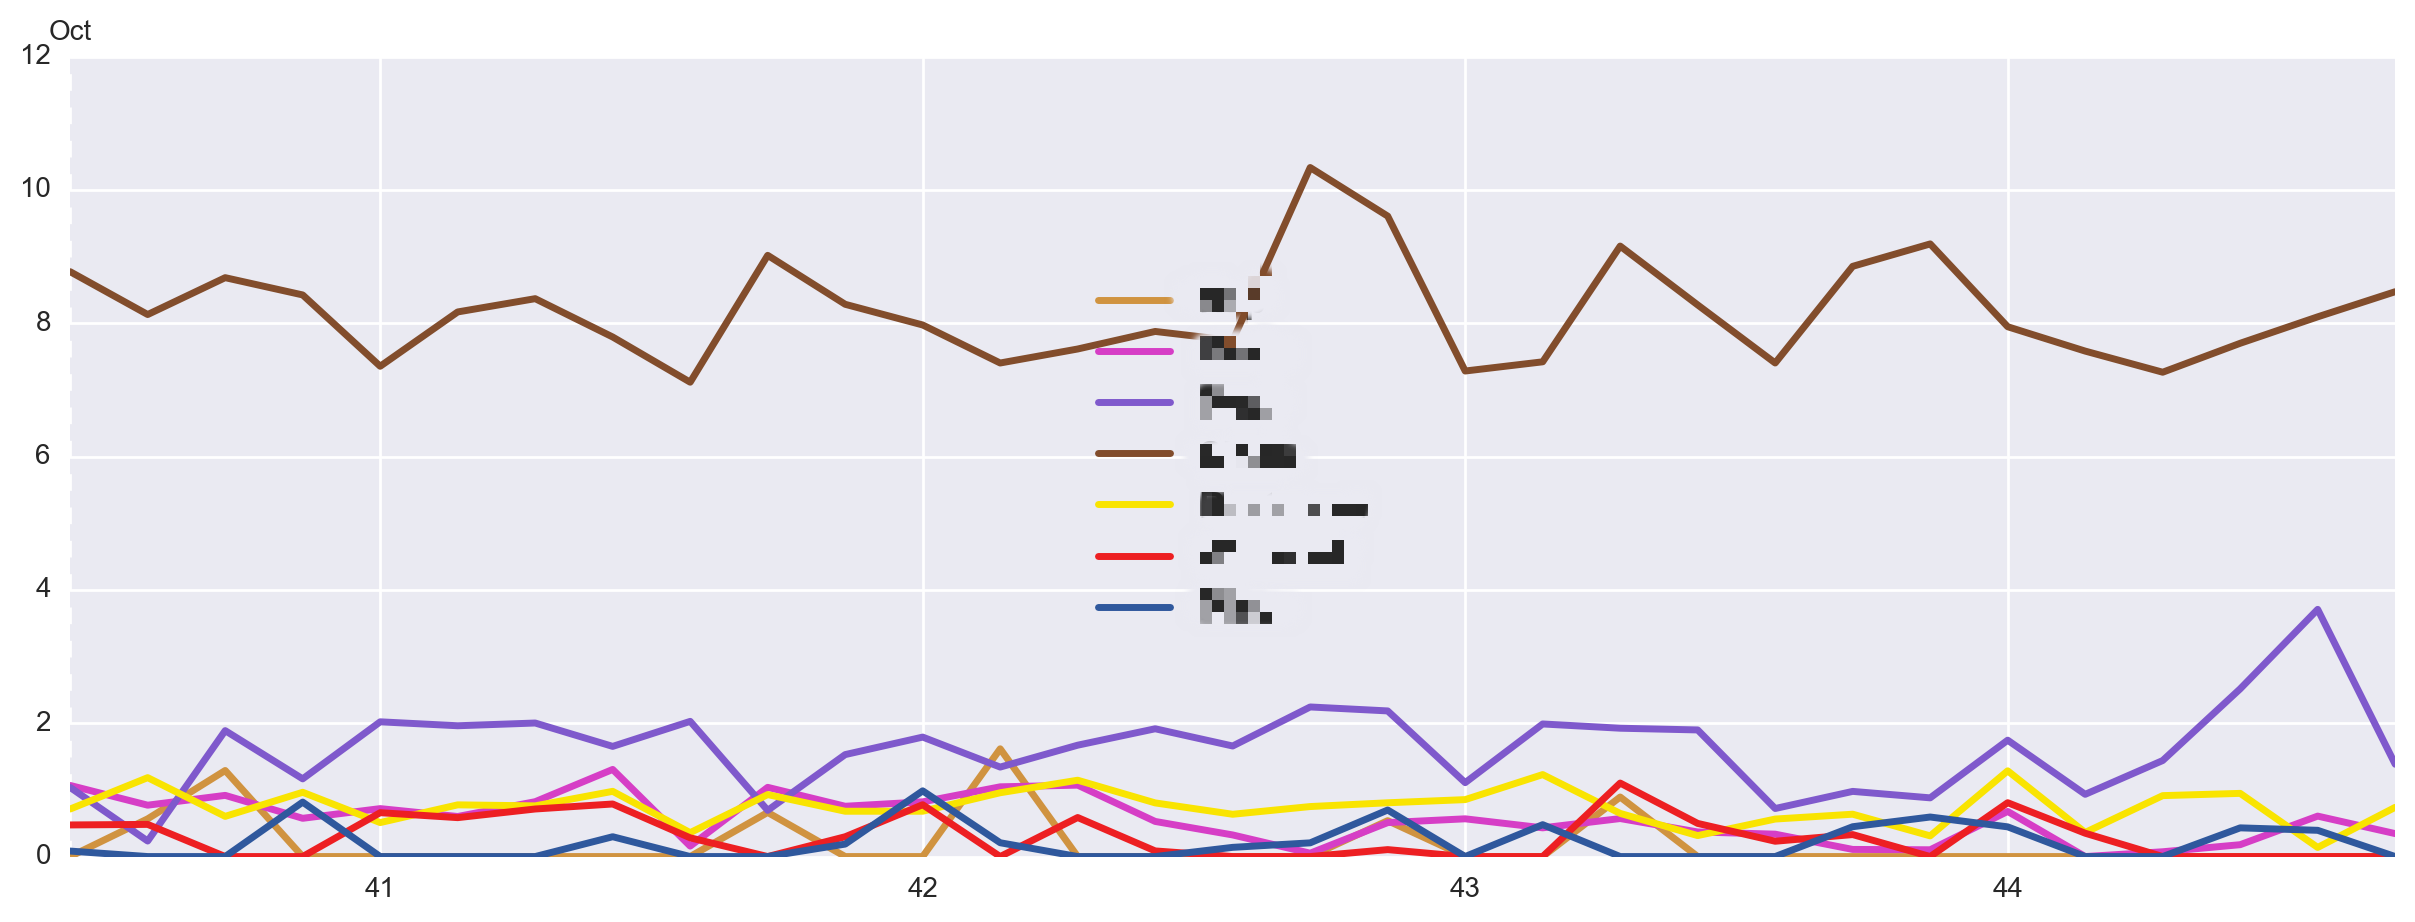
A flexible plot to compare given types or groups in line plot.