A small module that simplifies the processing of Auth0 logs.
The amount of days logs are available depends on your Auth0 plan.
npm install auth0-logs-processorIf you want to count how many logs you have
var processor = require('auth0-logs-processor').create({
    domain: 'MY_AUTH0_DOMAIN',
    clientId: 'MY_AUTH0_CLIENT',
    clientSecret: 'MY_AUTH0_SECRET',
});

var count = 0;

processor.each(function(log){
    count++;
});

processor.done(function(){
    console.log(count);
});

processor.start();
Available in the samples folder, monthly signup per app:
var processor = require('auth0-logs-processor').create({
  domain: 'MY_AUTH0_DOMAIN',
  clientId: 'MY_AUTH0_CLIENT',
  clientSecret: 'MY_AUTH0_SECRET',
});

var months = {};

processor.each(function(entry){
  // discard non signup events
  if (entry.type !== 'ss') { return; }

  var date = new Date(entry.date);

  var monthKey = date.getUTCFullYear() + '-' + date.getUTCMonth();

  if (!months[monthKey]){
    months[monthKey] = {};
  }

  if (!months[monthKey][entry.client_id]){
    months[monthKey][entry.client_id] = 0;
  }

  months[monthKey][entry.client_id]++;
});

processor.done(function(){
  Object.keys(months).forEach(function(m){
    console.log('Month:' + m);
    Object.keys(months[m]).forEach(function(c){
      console.log('Client ' + c + ':' + months[m][c]);
    });
  })
});

processor.start();
And the same as above assuming your logs fit into memory (dedicated to @woloski):
var _ = require('lodash');

var processor = require('auth0-logs-processor').create({
  domain: 'MY_AUTH0_DOMAIN',
  clientId: 'MY_AUTH0_CLIENT',
  clientSecret: 'MY_AUTH0_SECRET',
});

var entries = [];

processor.each(function(entry){
  entries.push(entry);
});

processor.done(function(){
  var groups = _.chain(entries)
    .filter(function(e){
      return e.type === 'ss'
    })
    .groupBy(function(e){
      var date = new Date(e.date);

      return date.getUTCFullYear() + '-' + date.getUTCMonth() + ' ' + e.client_id;
    })
    .value();

  _.forOwn(groups, function(value, key) {
    console.log(key + ': ' + value.length);
  });
});

processor.start();
Charts are cool, and you can use the data to create your own 😃.
See samples/charts for a pie chart displaying logins per identity provider. It looks like this:
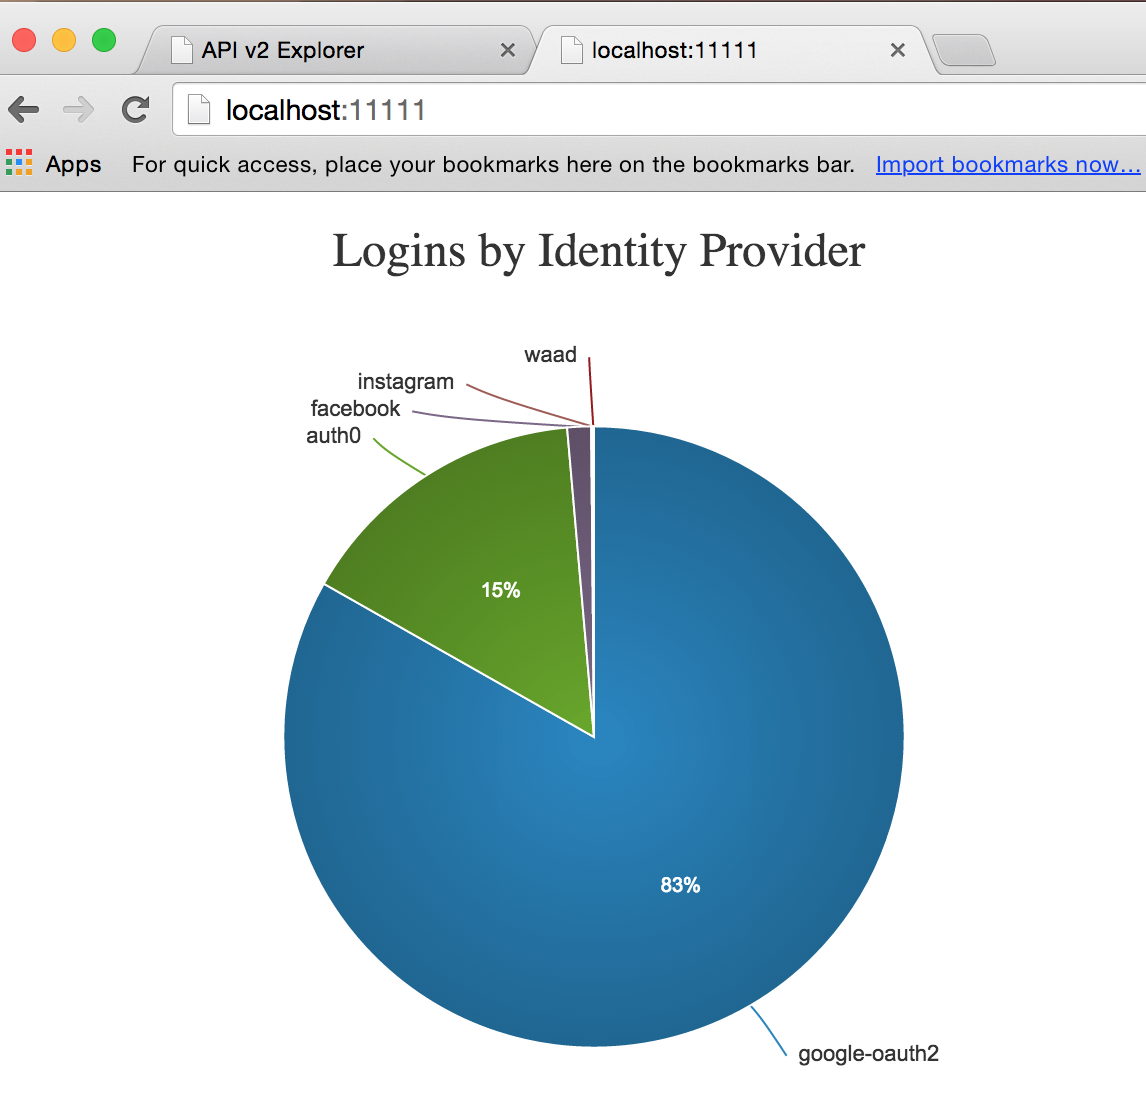
Shoutout to d3pie.
Put some of these together and create custom dashboards 🎆 💥 ⚡.
Feel free to add new samples by sending PRs.
If you have found a bug or if you have a feature request, please report them at this repository issues section. Please do not report security vulnerabilities on the public GitHub issue tracker. The Responsible Disclosure Program details the procedure for disclosing security issues.
This project is licensed under the MIT license. See the LICENSE file for more info.