Hasil dibawah juga dapat dilihat pada situs https://www.datawizart.com/covid-19-tracker-indonesia.html
Yang diperlukan untuk mereplikasi hasil dibawah: covid_19.Rmd download data
- https://github.com/dioariadi/covid-19/blob/master/df_indo.rds
- https://github.com/dioariadi/covid-19/blob/master/df_worldmeter_analysis.rds
- https://ig.ft.com/coronavirus-chart/?areas=usa&areas=idn&cumulative=1&logScale=1&perMillion=0&values=cases
- https://github.com/VictimOfMaths/COVID-19/blob/master/LAHeatmaps.R
- https://mobile.twitter.com/jburnmurdoch/status/1256711433829703683
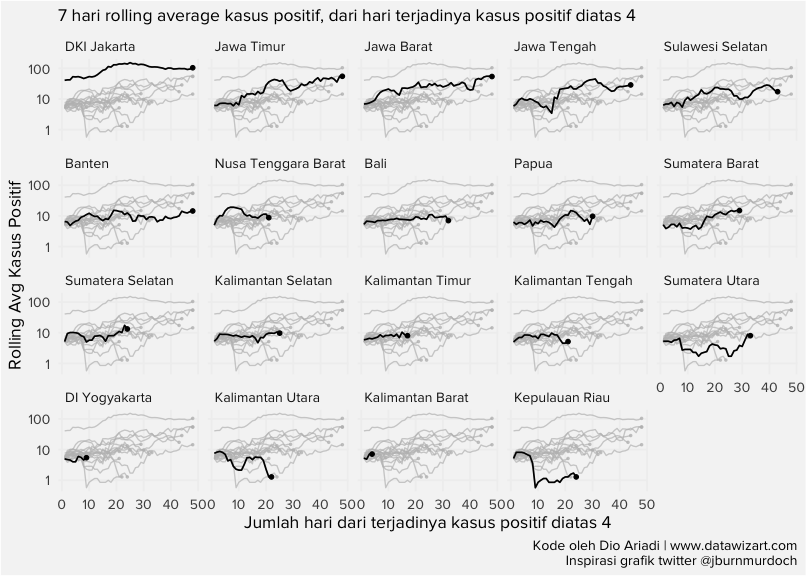
heatmap_daily_indo %>% group_by(province) %>%
  mutate(dott_y = if_else(seq_==max(seq_),casesroll_avg,NaN)) %>%
  ungroup() %>%
  ggplot(aes(x=seq_ ,group=province ))+
  geom_line(aes( y = casesroll_avg))+
  geom_point(aes(y = dott_y),size=1)+
  gghighlight(use_direct_label = FALSE,unhighlighted_params = list(size=0.4))+
  scale_y_continuous(trans='log2',
                     breaks=c(1,10,100,500,1000,5000,10000,25000,80000,120000))+
  facet_wrap(~province)+
  labs(subtitle = "7 hari rolling average kasus positif, dari hari terjadinya kasus positif diatas 4",
       y = "Rolling Avg Kasus Positif",
       x = "Jumlah hari dari terjadinya kasus positif diatas 4",
       caption = "Kode oleh Dio Ariadi | www.datawizart.com\nInspirasi grafik twitter @jburnmurdoch")+
  theme(panel.background = element_rect(fill = "#f5f5f5"),
        text = element_text(family = "Proxima Nova"),
        panel.grid.major = element_line(colour = "#f0f0f0"),
        panel.grid.minor = element_blank(),
        axis.ticks = element_blank(),
        strip.background = element_rect(fill = "#f5f5f5"),
        plot.background = element_rect(fill = "#f5f5f5"),
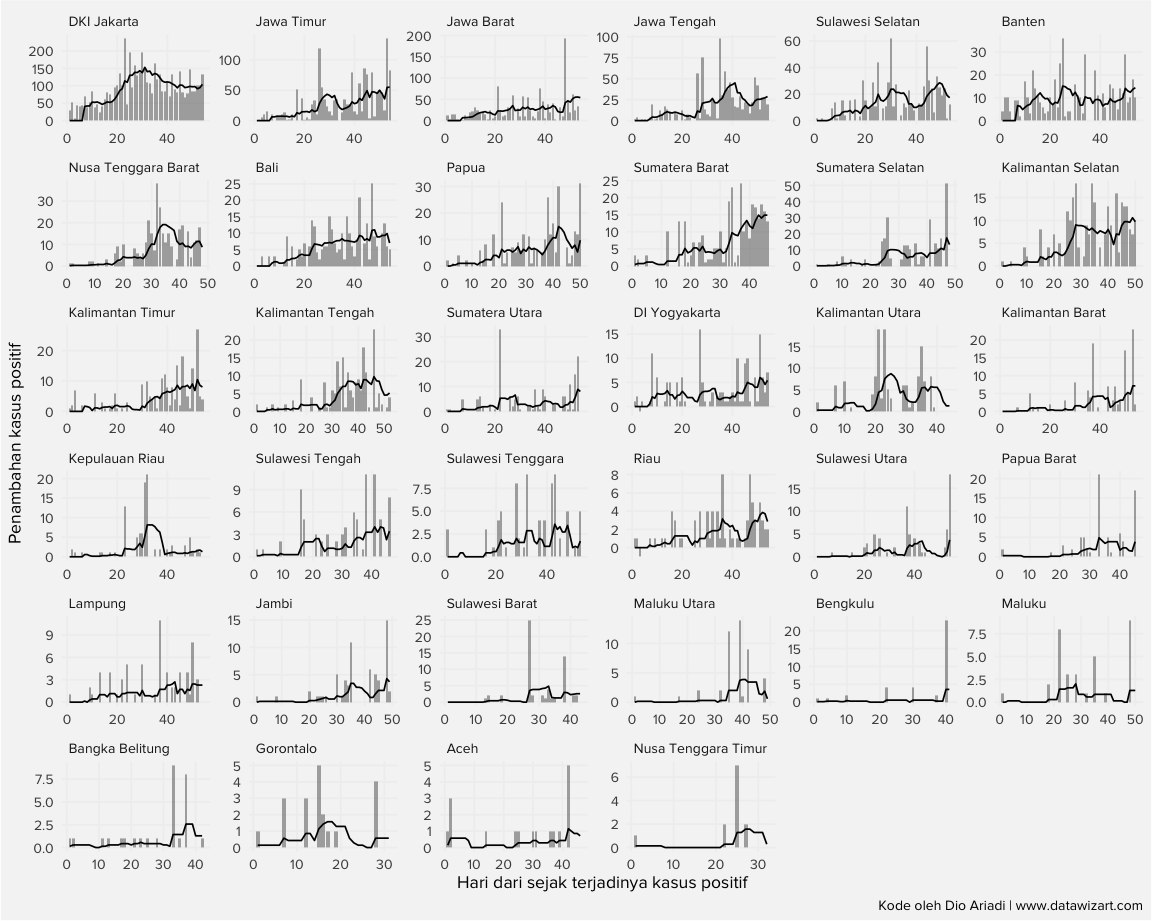
strip.text.x = element_text(hjust = 0))heatmap_indo %>% filter(total_case>0 & province!="no_define") %>%
group_by(province) %>%
mutate(seq_=row_number()) %>%
ungroup() %>%
ggplot(aes(x=seq_))+
geom_col(aes(y = daily_case),alpha=0.5)+
geom_line(aes(y = casesroll_avg))+
labs(x = "Hari dari sejak terjadinya kasus positif",
y = "Penambahan kasus positif",
caption = "Kode oleh Dio Ariadi | www.datawizart.com")+
facet_wrap(~province,scales = "free")+
theme(panel.background = element_rect(fill = "#f5f5f5"),
text = element_text(family = "Proxima Nova"),
panel.grid.major = element_line(colour = "#f0f0f0"),
panel.grid.minor = element_blank(),
axis.ticks = element_blank(),
strip.background = element_rect(fill = "#f5f5f5"),
plot.background = element_rect(fill = "#f5f5f5"),
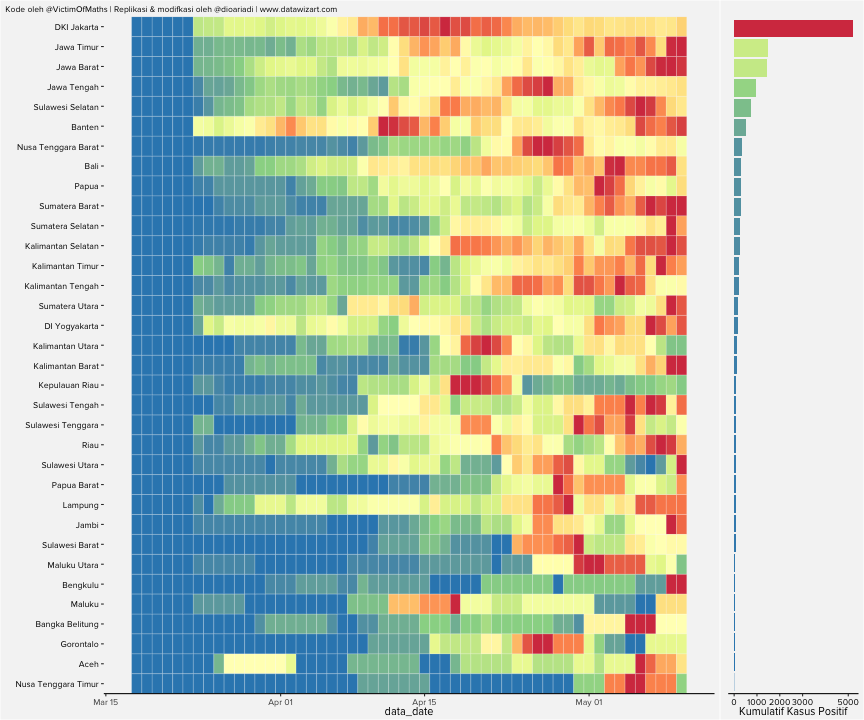
strip.text.x = element_text(hjust = 0))Heatmap ini menjelaskan 7 hari rolling average dari kasus positif baru, di lakukan normalisasi berdasarkan nilai kasus positif terbesar di tiap provinsi. Semakin hijau semakin jauh dari nilai maksimal yang terjadi pada suatu provinsi. Atau dapat diinterpretasikan telah melalui peak dari jumlah pertambahan kasus harian tertinggi.
heatmap_indo_2 <- heatmap_indo %>% filter(province!="no_define")
heatmap_indo_2$province <- fct_reorder(heatmap_indo_2$province, heatmap_indo_2$total_case,max)

#https://github.com/VictimOfMaths/COVID-19
heatmap_indo_2$maxcaseprop <- heatmap_indo_2$casesroll_avg/heatmap_indo_2$maxcaserate
casetiles <- ggplot(heatmap_indo_2, aes(x=data_date, y=(province), fill=maxcaseprop))+
  geom_tile(colour="White", show.legend=FALSE)+
  theme_classic()+
  scale_fill_distiller(palette="Spectral")+
  scale_y_discrete(name="", expand=c(0,0))+
  labs(
       subtitle="Kode oleh @VictimOfMaths | Replikasi & modifkasi oleh @dioariadi | www.datawizart.com")+
  theme(
    axis.line.y=element_blank(),
    plot.subtitle=element_text(size=rel(0.78)),
    plot.title.position="plot",
    axis.text.y=element_text(colour="Black"),
    text = element_text(family = "Proxima Nova"),
    plot.background = element_rect(fill = "#f5f5f5"),
    panel.background = element_rect(fill = "#f5f5f5")
    )

casebar <- ggplot(subset(heatmap_indo_2, data_date==max(data_date)), aes(x=total_case, y=(province), fill=total_case))+
  geom_col(show.legend=FALSE)+
  theme_classic()+
  scale_fill_distiller(palette="Spectral")+
  scale_x_continuous(name="Kumulatif Kasus Positif", breaks=c(0,1000,2000,3000,5000))+
  theme(axis.title.y=element_blank(),
        axis.line.y=element_blank(),
        axis.text.y=element_blank(),
        axis.ticks.y=element_blank(),
        axis.text.x=element_text(colour="Black"),
        text = element_text(family = "Proxima Nova"),
        plot.background = element_rect(fill = "#f5f5f5"),
        panel.background = element_rect(fill = "#f5f5f5"))

plot_grid(casetiles, casebar, align="h", rel_widths=c(1,0.2))
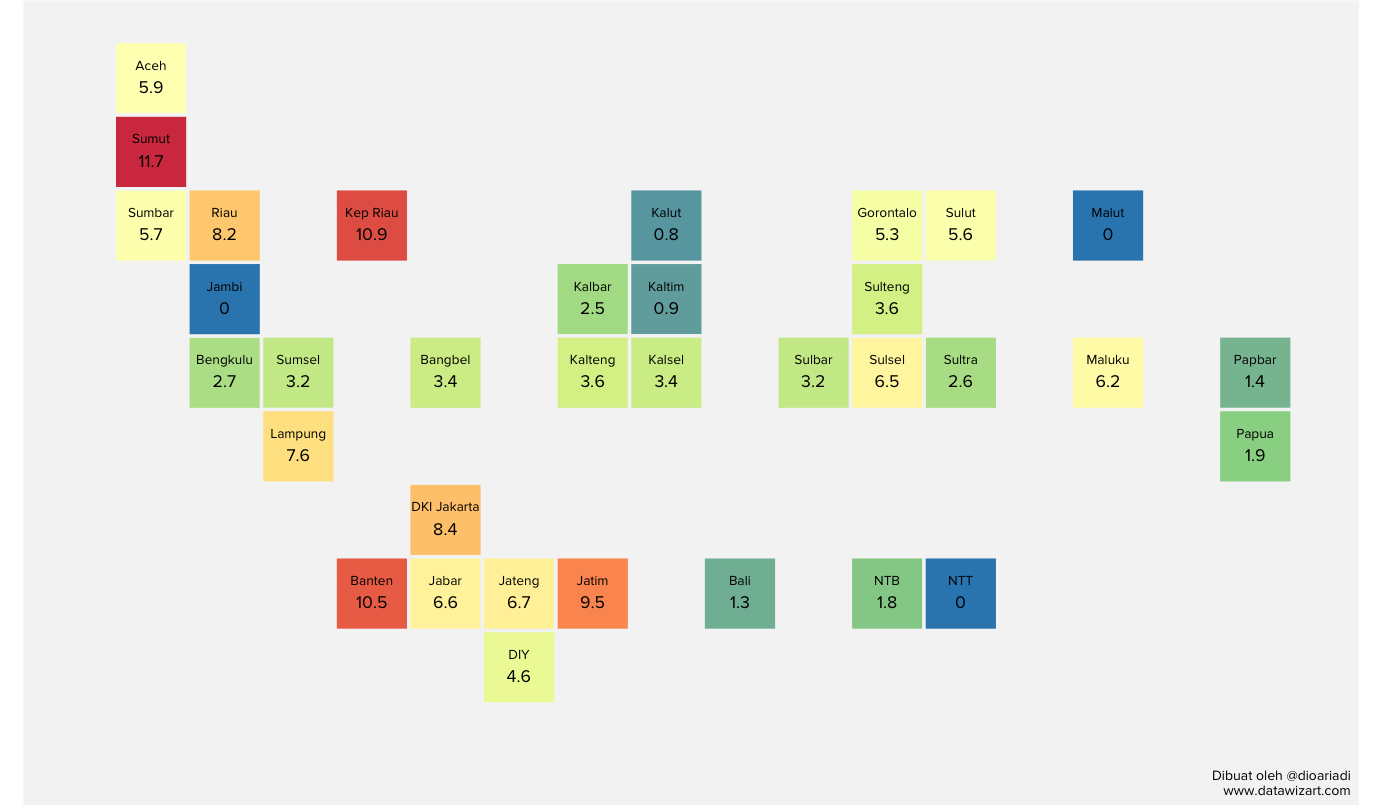
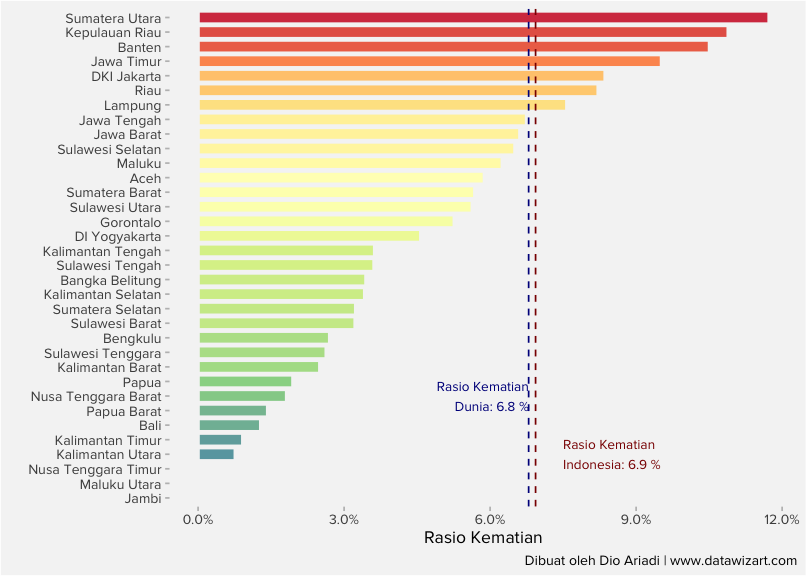
Rasio kematian adalah jumlah kasus meninggal dibagi jumlah kasus positif
death_ratio_df <- df_indo %>%
  group_by(code,province) %>%
  arrange(data_date) %>%
  mutate(rank_ = row_number(),
         n_ = n()) %>%
  filter(rank_ == n_) %>%
  ungroup() %>%
  mutate(death_ratio = total_death/total_case,
         death_ratio = ifelse(is.na(death_ratio),0,death_ratio)) %>%
  left_join(indo_grid[,c(1,2,5,6)], by = c("province"="name_indo"))

death_ratio_df %>%
  ggplot(aes(x = (col), y = -1*row,
             fill = death_ratio))+
  geom_tile(color = "#f5f5f5",size=1)+
  geom_text(aes(label=round(death_ratio,3)*100),vjust=1.2,family = "Proxima Nova")+
  geom_text(aes(label=name_short),vjust =-1,family = "Proxima Nova",size = 3)+
  labs(x = "",y= "", caption = "Dibuat oleh @dioariadi\nwww.datawizart.com")+
  coord_equal()+
  scale_fill_distiller(palette="Spectral")+
   theme(panel.grid = element_blank(),
        text = element_text(family = "Proxima Nova"),
        strip.background = element_blank(),
        axis.text.x = element_blank(),
        axis.ticks.x = element_blank(),
        strip.text.x = element_text(size = 7),
        axis.text.y = element_blank(),
        axis.ticks.y = element_blank(),
        plot.background=element_rect(fill = "#f5f5f5"),
        panel.background = element_rect(fill = "#f5f5f5"),
        legend.position = "none")
overall_indo <- sum(death_ratio_df$total_death)/sum(death_ratio_df$total_case)
overall_world <- read_rds("df_worldmeter_analysis.rds") %>% group_by(country) %>% slice(which.max(data_date)) %>% ungroup() %>% summarise(sum(deaths,na.rm = TRUE)/sum(cases,na.rm = TRUE)) %>% pull()
death_ratio_df %>% filter(province!="no_define") %>%
ggplot(aes(x = fct_reorder(province,death_ratio),
y = death_ratio,
fill = death_ratio))+
geom_col(color = "#f5f5f5",size=1)+
geom_hline(aes(yintercept= overall_indo),linetype ="dashed",color = "darkred")+
geom_hline(aes(yintercept= overall_world),linetype ="dashed",color = "darkblue")+
#geom_text(aes(x = 4, y = 0.082, label = paste("Rasio Kematian\n Indonesia:",round(overall_indo,3)*100)), family= "Proxima Nova",size =3)+
annotate("text", x = 4, y = 0.075, label = paste("Rasio Kematian\nIndonesia:",round(overall_indo,3)*100,"%"),family = "Proxima Nova",
size=3,
colour ="darkred",
hjust = 0)+
annotate("text", x = 8, y = 0.068, label = paste("Rasio Kematian\nDunia:",round(overall_world,3)*100,"%"),family = "Proxima Nova",
size=3,
colour ="darkblue",
hjust = 1)+
labs(x = "",
y = "Rasio Kematian",
caption = "Dibuat oleh Dio Ariadi | www.datawizart.com")+
coord_flip()+
scale_fill_distiller(palette="Spectral")+
scale_y_continuous(labels = scales::percent)+
theme(panel.grid = element_blank(),
text = element_text(family = "Proxima Nova"),
strip.background = element_blank(),
axis.ticks.x = element_line(colour = "grey"),
strip.text.x = element_text(size = 7),
axis.ticks.y = element_line(colour = "grey"),
plot.background=element_rect(fill = "#f5f5f5"),
panel.background = element_rect(fill = "#f5f5f5"),
legend.position = "none") #geom_text(aes(label=round(death_ratio,3)*100),vjust=1.2,family = "Proxima Nova")+
#geom_text(aes(label=name_short),vjust =-1,family = "Proxima Nova",size = 3)- email
dioariadi11@gmail.com
Indonesia:
- @kawalCOVID19
- https://covid19.go.id/
Internasional:
