A HTTP API that wraps output of the upsc command as a JSON output and serves it on an endpoint. Meant to be used in a Docker environment and dependent on nut-upsd to serve as data input.
Everybody knows what it feels like to set up a server or a Pi or a configuration for that matter with a tutorial, but once it crashes or you need to look into a problem later on you don't know what you did anymore. I'm used to working with a microservice based architecture at work, including Docker and Kubernetes and see the benefits of having something similar at home.
I have a UPS (Uninterruptible Power Supply) and would like to have geeky metrics on that without using a lot of custom stuff so I started to look into solutions that I could manage on the long term. My NAS is too old to support it and I didn't want to tincker with it.
My setup includes a Raspberry Pi 4B (4GB) with an SSD and I manage everything through GitOps. For deployment I use Docker Compose. I already have InfluxDB and Grafana running with Telegraf to collect metrics so I figured it should be easy to add my UPS metrics ...
NUT, or Network UPS Tools is a project that provides control and monitoring features with a uniform control and management interface compatible with up to several thousand models.
I found a NUT server container for arm: https://hub.docker.com/r/instantlinux/nut-upsd-arm32 which takes off the load of manual configuring the services. With only needing to map the device and a description. You can find the possible variables here: https://github.com/instantlinux/docker-tools/tree/master/images/nut-upsd.
Cool, so that's working.
I found a Python script that could work with the Telegraf [[inputs.exec]] plugin but it only works if you have upsc installed on the same system, which was not the case since I am running this in Docker.
I'm pretty familiar with API's so I decided to make one in Node.js, it's not only a good way to scrape them for metrics but I can always manually get a status. There is probably room for improvement and didn't want to overkill it.
Next, I found a git repository that is a fork of the Node-NUT NPM package that is brought up-to-date with promises. However, upon using it I needed some changes done to the lib so I decided to just include a copy in my own project.
By default the output is just returned from the NUT service with everything being a string. I prefer a more valid JSON output and have the values parsed as their proper types. You can include ?parsed=true to both endpoints and I would advise using this.
http://<server-address>:<server-port>/devices
Retrieve a list of configured UPS devices from the NUT service
example without parsed (http://192.168.1.100:3001/devices):
{
    "ups": "APC Back-UPS XS 950U"
}
example with parsed (http://192.168.1.100:3001/devices?parsed=true):
[
    {
        "name": "ups",
        "description": "APC Back-UPS XS 950U"
    }
]
In both cases ups is the name you have configured in nut-upsd as environment variable.
http://<server-address>:<server-port>/devices/<device-name>
Retrieve the specified device values from the NUT service
example without parsed: (http://192.168.1.100:3001/devices/ups):
{
    "battery.charge": "100",
    "battery.charge.low": "10",
    "battery.charge.warning": "50",
    "battery.date": "2001/09/25",
    "battery.mfr.date": "2020/02/16",
    "battery.runtime": "3180",
    "battery.runtime.low": "120",
    "battery.type": "PbAc",
    "battery.voltage": "13.6",
    "battery.voltage.nominal": "12.0",
    "device.mfr": "American Power Conversion",
    "device.model": "Back-UPS XS 950U  ",
    "device.serial": "[REDACTED]  ",
    "device.type": "ups",
    "driver.name": "usbhid-ups",
    "driver.parameter.pollfreq": "30",
    "driver.parameter.pollinterval": "2",
    "driver.parameter.port": "auto",
    "driver.parameter.serial": "[REDACTED]",
    "driver.parameter.synchronous": "no",
    "driver.version": "3.8.0-3727-geade014bef",
    "driver.version.data": "APC HID 0.96",
    "driver.version.internal": "0.41",
    "input.sensitivity": "medium",
    "input.transfer.high": "280",
    "input.transfer.low": "155",
    "input.transfer.reason": "input voltage out of range",
    "input.voltage": "240.0",
    "input.voltage.nominal": "230",
    "ups.beeper.status": "enabled",
    "ups.delay.shutdown": "20",
    "ups.firmware": "925.T2 .I",
    "ups.firmware.aux": "T2 ",
    "ups.load": "11",
    "ups.mfr": "American Power Conversion",
    "ups.mfr.date": "2020/02/16",
    "ups.model": "Back-UPS XS 950U  ",
    "ups.productid": "0002",
    "ups.realpower.nominal": "480",
    "ups.serial": "[REDACTED]  ",
    "ups.status": "OL",
    "ups.test.result": "No test initiated",
    "ups.timer.reboot": "0",
    "ups.timer.shutdown": "-1",
    "ups.vendorid": "051d"
}
example with parsed: (http://192.168.1.100:3001/devices/ups?parsed=true):
{
    "battery": {
        "charge": 100,
        "date": "2001/09/25",
        "mfr": {
            "date": "2020/02/16"
        },
        "runtime": 3352,
        "type": "PbAc",
        "voltage": 13.4
    },
    "device": {
        "mfr": "American Power Conversion",
        "model": "Back-UPS XS 950U",
        "serial": "[REDACTED]",
        "type": "ups"
    },
    "driver": {
        "name": "usbhid-ups",
        "parameter": {
            "pollfreq": 30,
            "pollinterval": 2,
            "port": "auto",
            "serial": "[REDACTED]",
            "synchronous": "no"
        },
        "version": "3.8.0-3727-geade014bef"
    },
    "input": {
        "sensitivity": "medium",
        "transfer": {
            "high": 280,
            "low": 155,
            "reason": "input voltage out of range"
        },
        "voltage": 242
    },
    "ups": {
        "beeper": {
            "status": "enabled"
        },
        "delay": {
            "shutdown": 20
        },
        "firmware": "925.T2 .I",
        "load": 11,
        "mfr": "American Power Conversion",
        "model": "Back-UPS XS 950U",
        "productid": 2,
        "realpower": {
            "nominal": 480
        },
        "serial": "[REDACTED]",
        "status": "OL",
        "test": {
            "result": "No test initiated"
        },
        "timer": {
            "reboot": 0,
            "shutdown": -1
        },
        "vendorid": "051d",
        "statusnum": 1
    }
}
Note: In the parsed object I have added one extra property called statusnum, this is so I can map the value in Grafana more easily. This is based on my device's statusses. If needed I can make the mapping overwritable as an environment setting.
| Status | Number | Description |
|---|---|---|
| OL | 1 | Online |
| OL CHRG | 2 | Online & Charging |
| OL CHRG LB | 2 | Online Low Battery |
| OB DISCHRG | 3 | On Battery |
| LB | 4 | Low Battery |
| SD | 5 | Shutdown Load |
You can run the code by:
- Make sure you have nodejs installed on your system
- Run
npm install(only needed the first time) - Run
npm start
You should be able to build the Docker container locally but take note of the cpu architecture you are building it on.
docker build -t deetoreu/nut-http:latest .
The docker container is available on Docker Hub: https://hub.docker.com/r/deetoreu/nut-http
These variables can be passed to the image from kubernetes.yaml or docker-compose.yml as needed:
| Variable | Type | Default | Description |
|---|---|---|---|
| LOG_LEVEL | String | DEBUG | log4js debug level, choices are: OFF, FATAL, ERROR, WARN, INFO, DEBUG, TRACE, ALL, but I reccomend keeping it on DEBUG |
| SERVER_PORT | Number | 3001 | The port on which to expose this API |
| SERVER_TIMEOUT | Number | 2 * 60 * 1000 | Global response timeout for incoming HTTP calls in [ms] |
| NUT_ADDRESS | String | The address of your NUT process | |
| NUT_PORT | Number | 3493 | The port on which the NUT process is exposed |
| LOCK_TIMEOUT | Number | 1000 | When you have more than 1 UPS and you are using Telegraf to scrape the data at the same time this will avoid errors from an already running thread, in [ms] |
If there would be a need I can always include usename & password to access the NUT server.
Everything is logged on the console but also saved to a file per day.
If you want your logs to be persistent you can map a volume to /usr/src/app/logs
docker run example:
docker run -p 3001:3001 -e NUT_ADDRESS=192.168.1.100 -v ~/Documents/tmp/logs:/usr/src/app/logs deetoreu/nut-http:latest
or add the detach -d flag to run in the background
docker-compose.yml example:
version: '3.6'
services:
  nut-http:
    container_name: nut-http
    image: deetoreu/nut-http:latest
    restart: unless-stopped
    ports:
      - 3001:3001
    environment:
      NUT_ADDRESS: "192.168.1.100"
    volumes:
      - ./volumes/nut-http/logs:/usr/src/app/logs
apply with docker-compose -f docker-compose.yml up -d
As mentioned I use Telegraf for metrics, you can now easily use the [[inputs.http]] plugin.
Documentation can be found here: https://docs.influxdata.com/telegraf/v1.14/guides/using_http/
Make sure you have set up Telegraf and Influxdb correctly.
telegraf.conf example:
[[inputs.http]]
  urls = [
    "http://192.168.1.100:3001/devices/ups?parsed=true"
  ]

  data_format = "json"
  name_override = "ups"
  tagexclude = ["url", "host"]
  fielddrop = ["driver_parameter_pollfreq", "driver_parameter_pollinterval", "ups_productid"]
  json_string_fields = ["ups_model", "ups_status", "ups_beeper_status"]
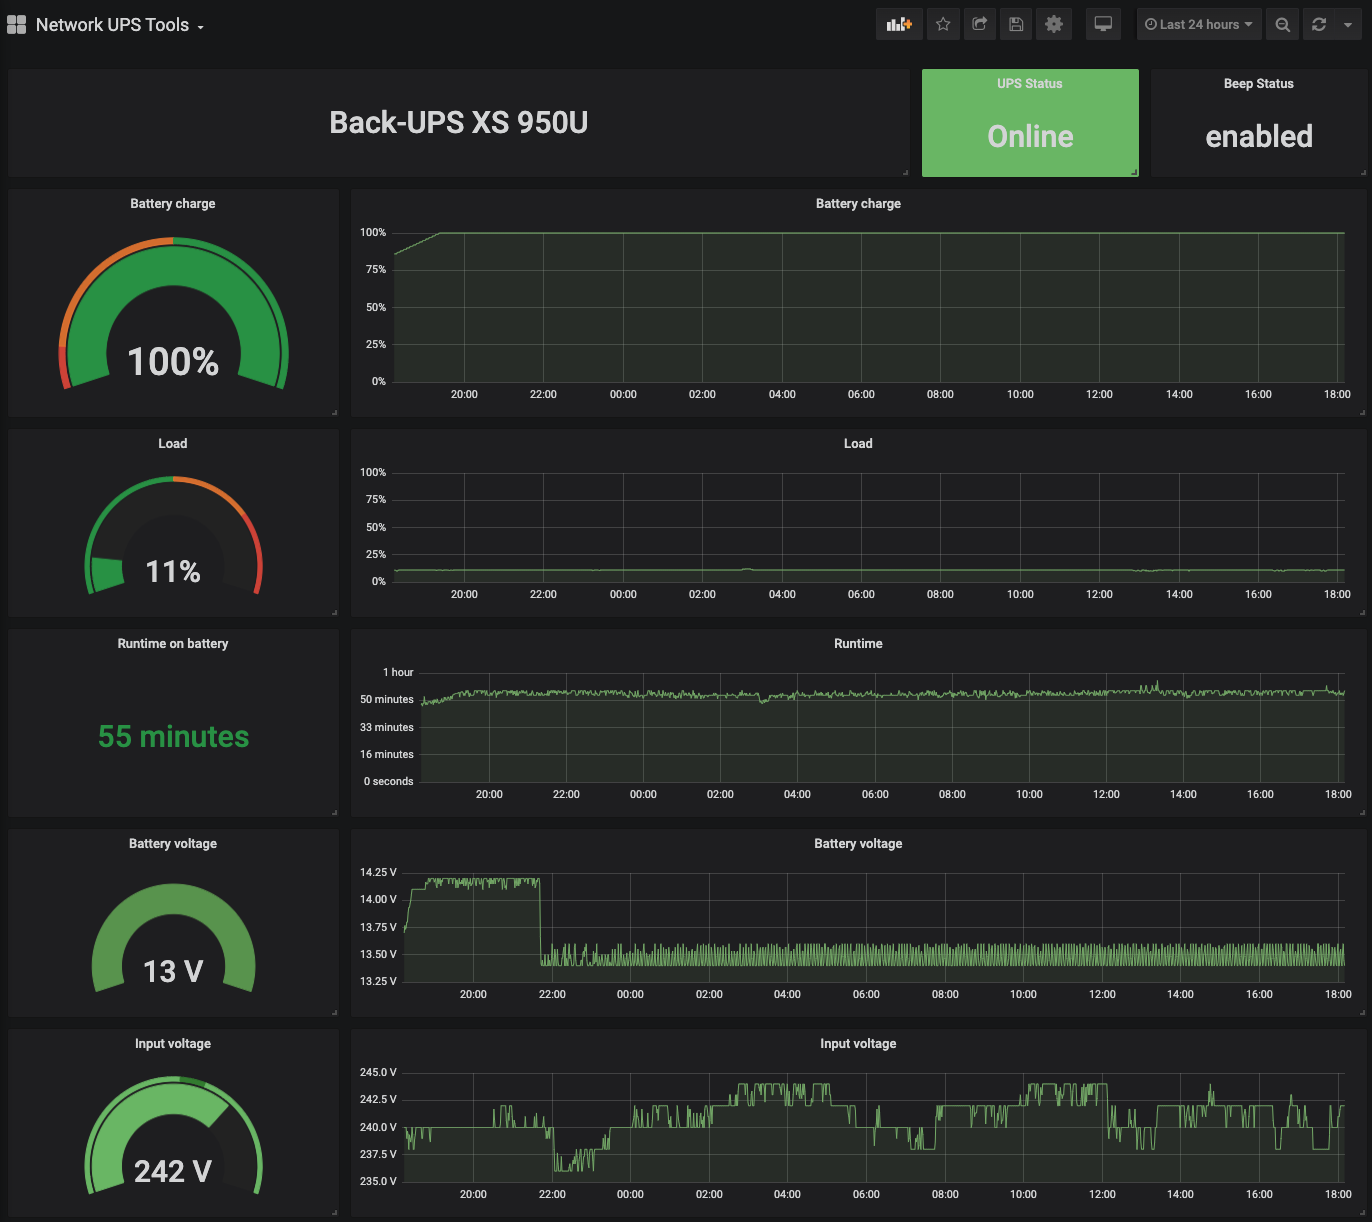
To Visualise the data in Grafana I made the following dashboard based on all the previous names used: https://grafana.com/grafana/dashboards/12205
Feel free to add your comments, report issues or make a PR to the project.
I hope this was of some help to at least someone else.