starBliss 
Initially inspired by an issue posted on the mapBliss package. The goal of this package is to create print quality starmap art similar to what is available online on many websites like Maps For Moments and Etsy within the R console.
As is the case with all projects. This one is a work in progress. So this repository will change over time!
Installing this package
# install.packages("devtools")
devtools::install_github("benyamindsmith/starBliss")
Why this isn't included in `mapBliss`
The mapBliss package utlizes leafleat and creates dynamic maps which can be screenshot to make custom maps. For visualization starBliss uses ggplot2 creates static visuals which can be saved by using the ggsave. Since the approaches to making visuals were so different, I thought it was best make keep mapBliss and starBliss seperate in their construction.
Dependencies
This package has the following dependencies:
(In no particular order)
-
dplyr -
ggplot2 -
magrittr -
tidygeocoder -
sf -
lubridate -
tibble -
grid -
s2
Basic Usage/Sample Visuals
"Black" Style
library(ggplot2)
library(starBliss)
p<- plot_starmap(location= "Toronto, ON, Canada",
             date="2022-01-17",
             style="black",
             line1_text="Toronto",
             line2_text ="January 17th, 2023",
             line3_text="43.6532° N, 79.3832° W")
ggsave('toronto_black.png', plot = p, width = unit(10, 'in'),
       height = unit(15, 'in'))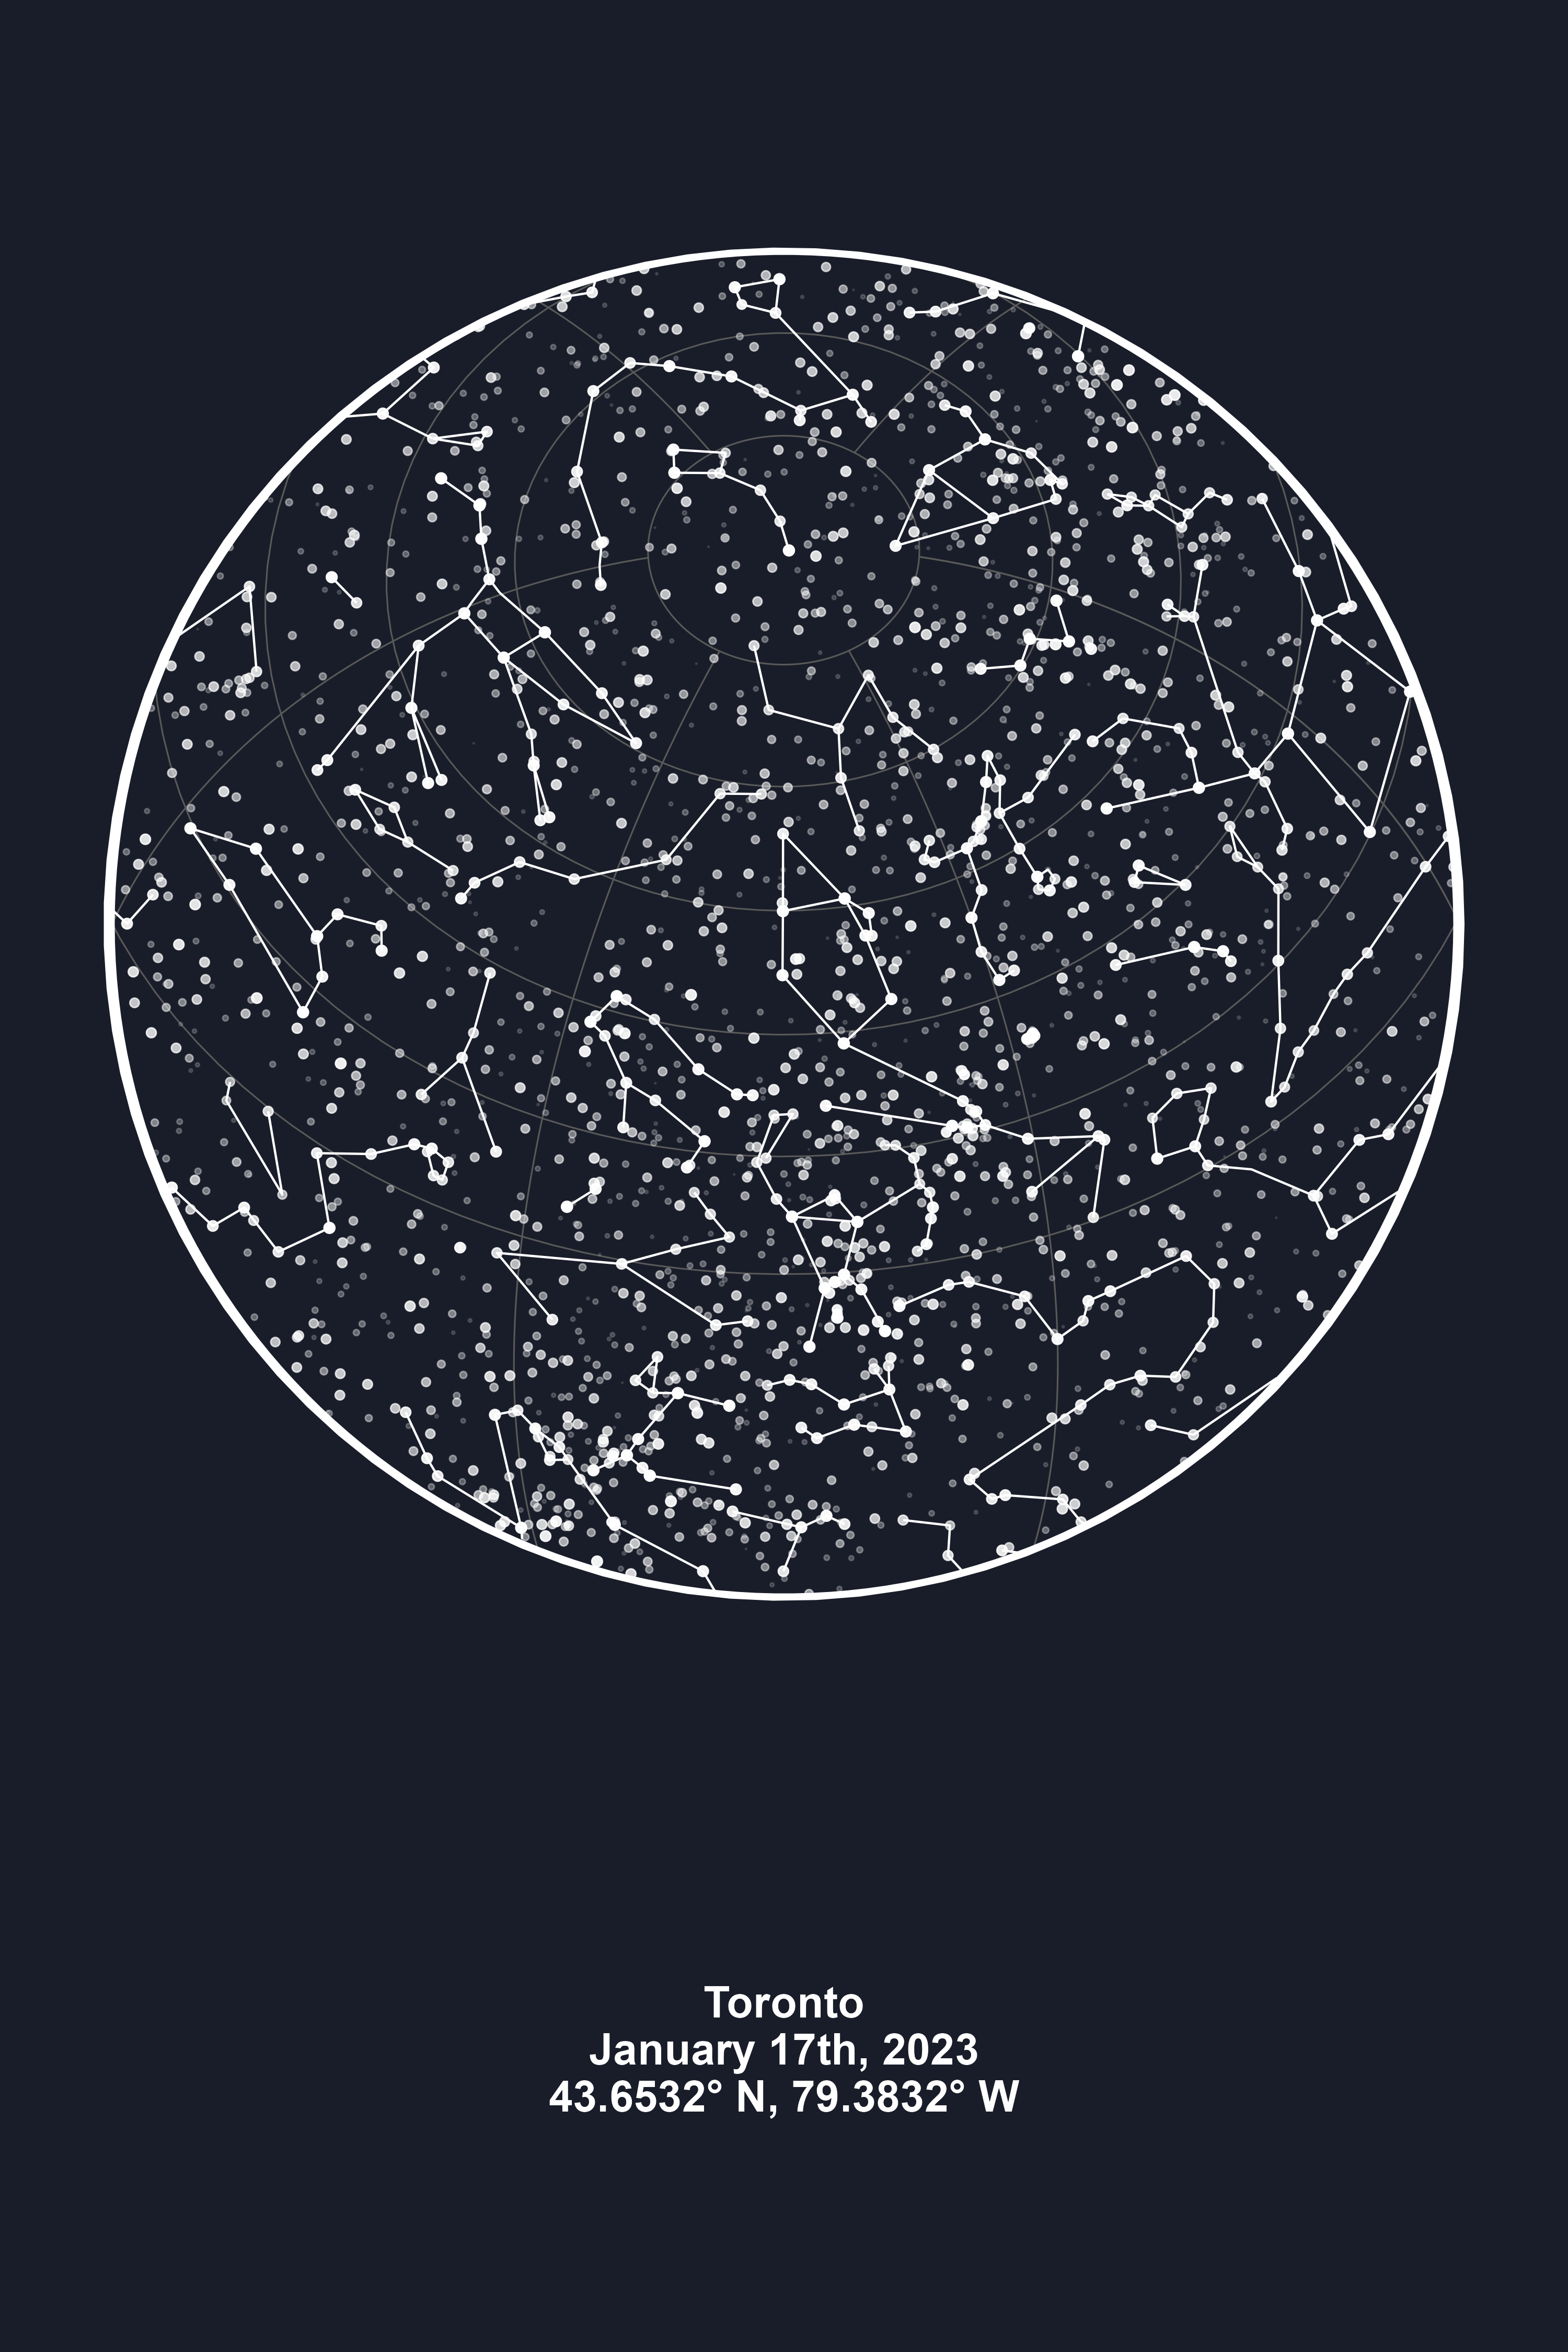
"Green" Style
library(ggplot2)
library(starBliss)
p<- plot_starmap(location= "Toronto, ON, Canada",
             date="2022-01-17",
             style="green",
             line1_text="Toronto",
             line2_text ="January 17th, 2023",
             line3_text="43.6532° N, 79.3832° W")
ggsave('toronto_green.png', plot = p, width = unit(10, 'in'),
       height = unit(15, 'in'))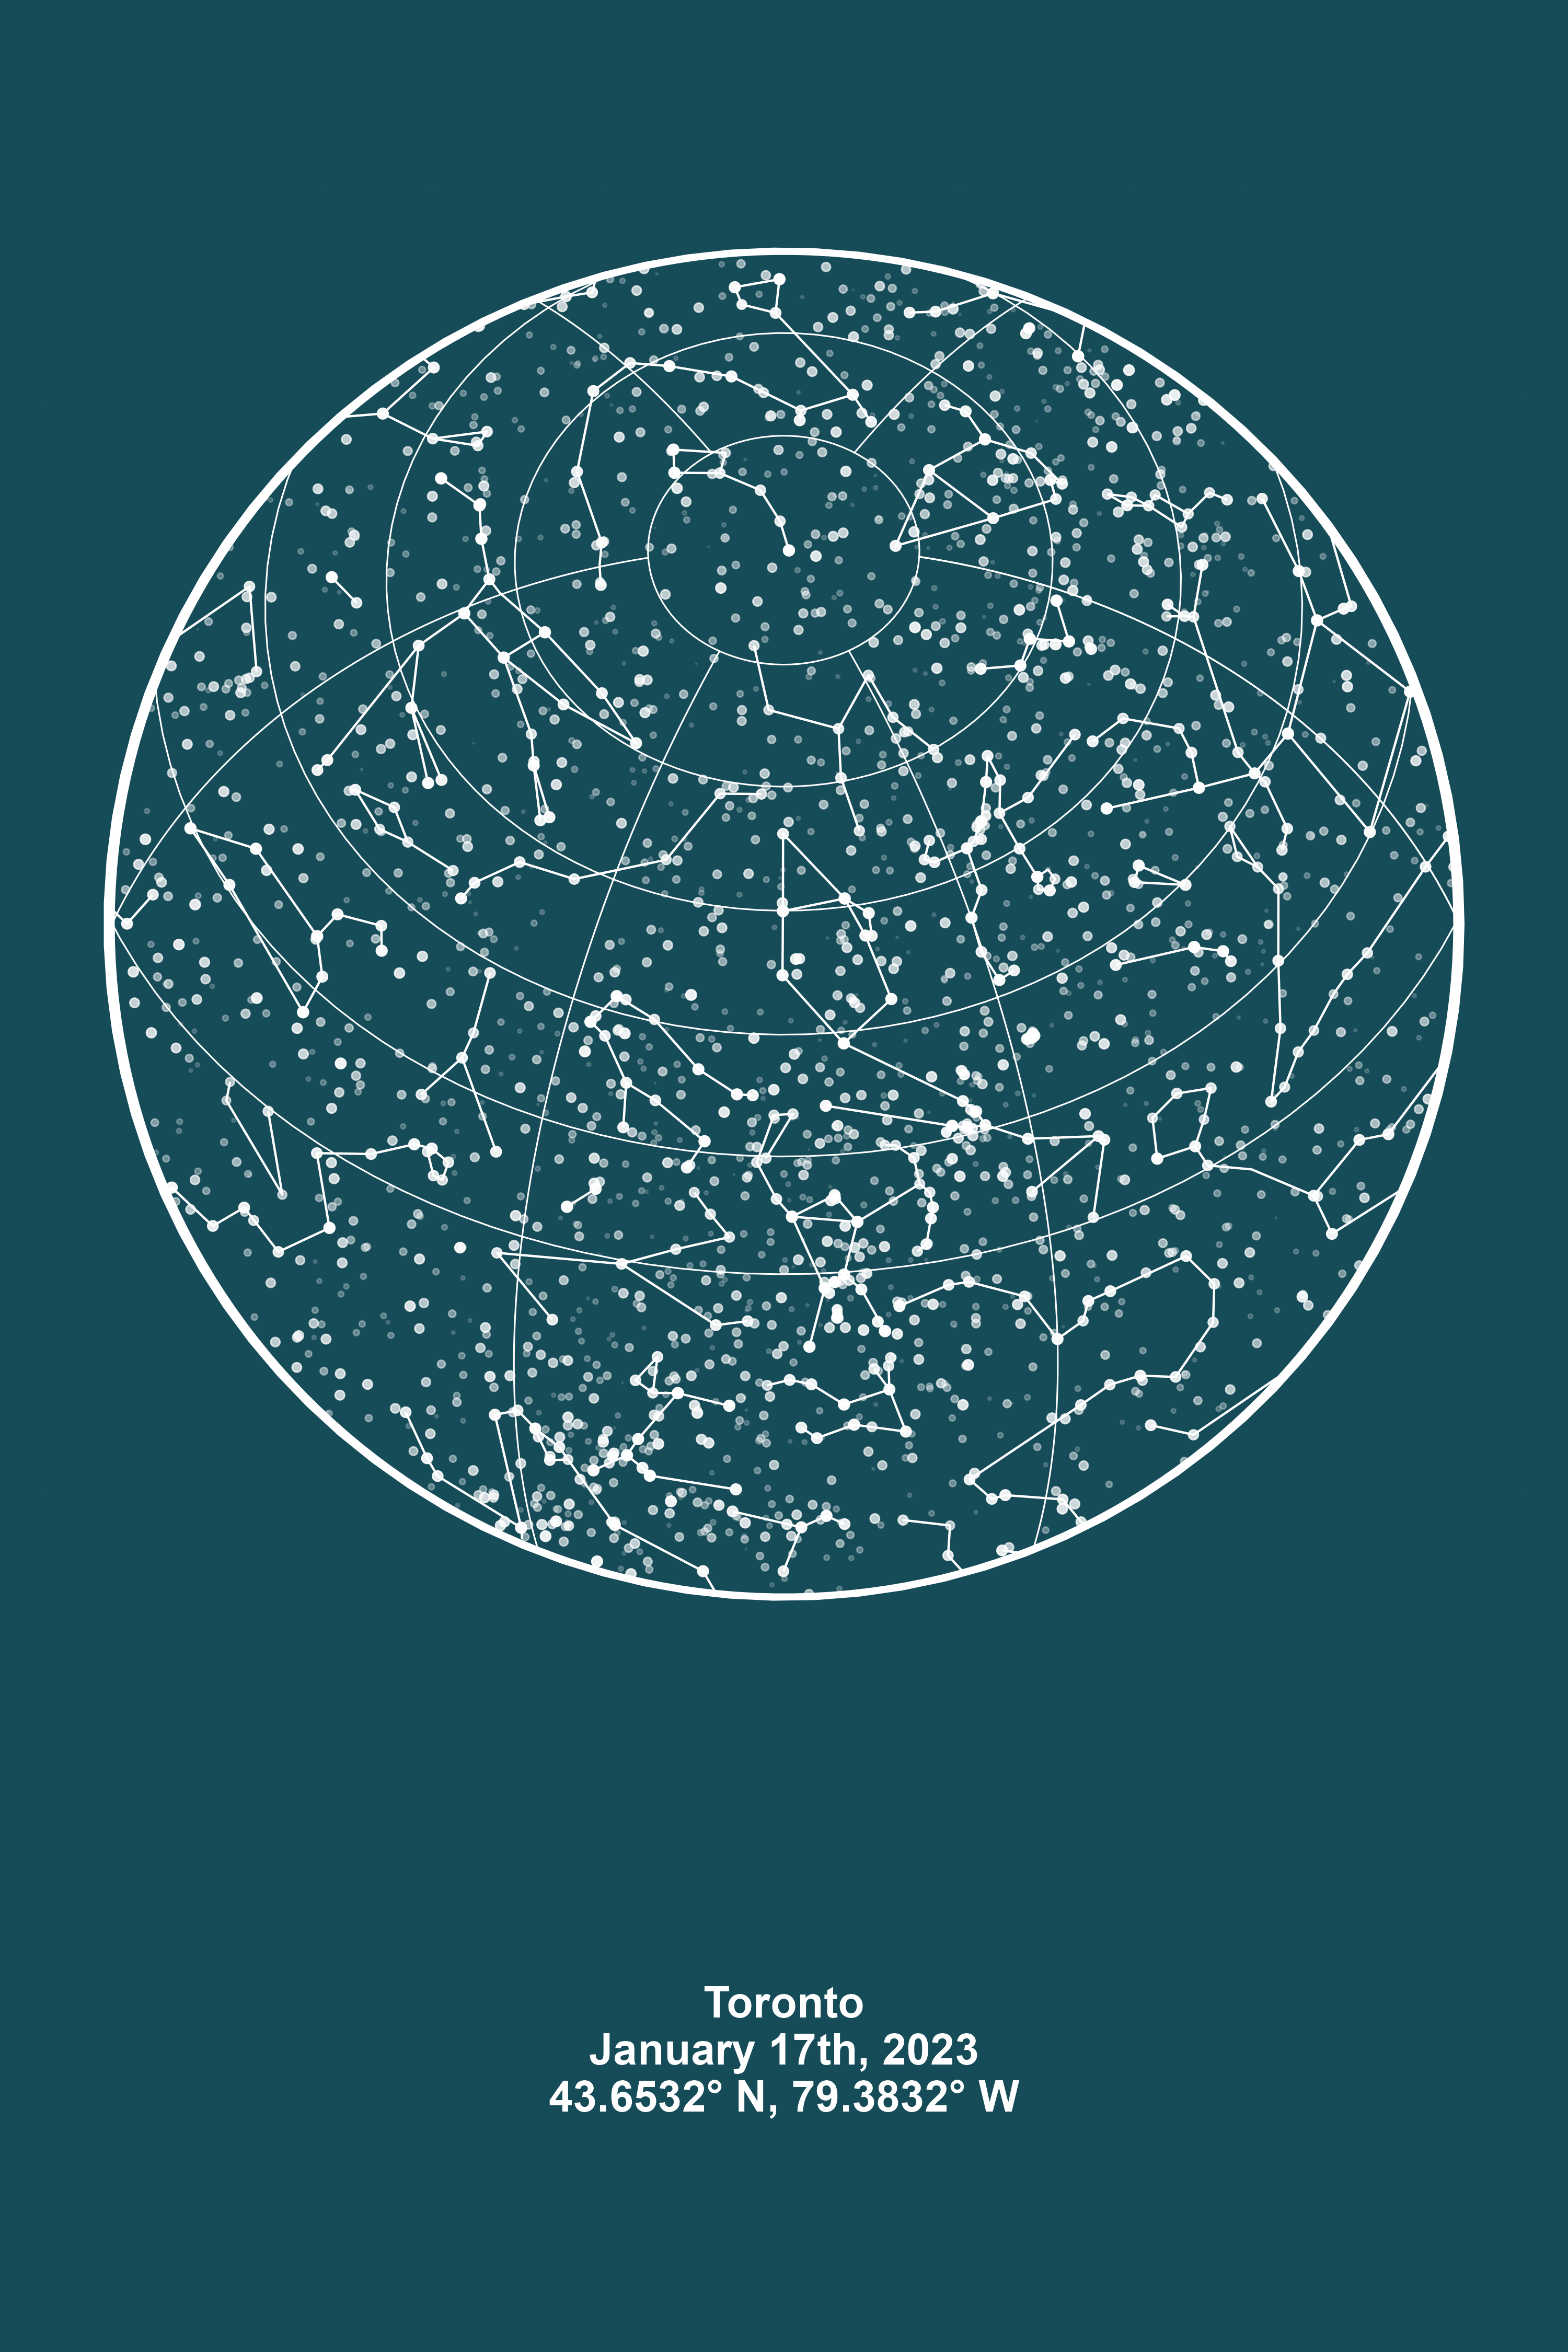
Acknowledgements
This package is largely based on the heavy lifting done by other talented developers. Among them including:
-
Kim Fitter for her Celestial Maps in R blog.
-
Allan Cameron for supplying the code which got this started.
-
Bernardo Lares for opening up issues!
-
Diego Hernangómez for helping with the constellation lines problem.