Control your Buderus Logamatic R2107 / HS 2105 with ESP and MQTT
The information from the heater provides a better understanding of how the heater works and offers opportunities for optimization.
In combination with influxDB and Grafana you can also create useful and impressive Dashboard of your heating system.
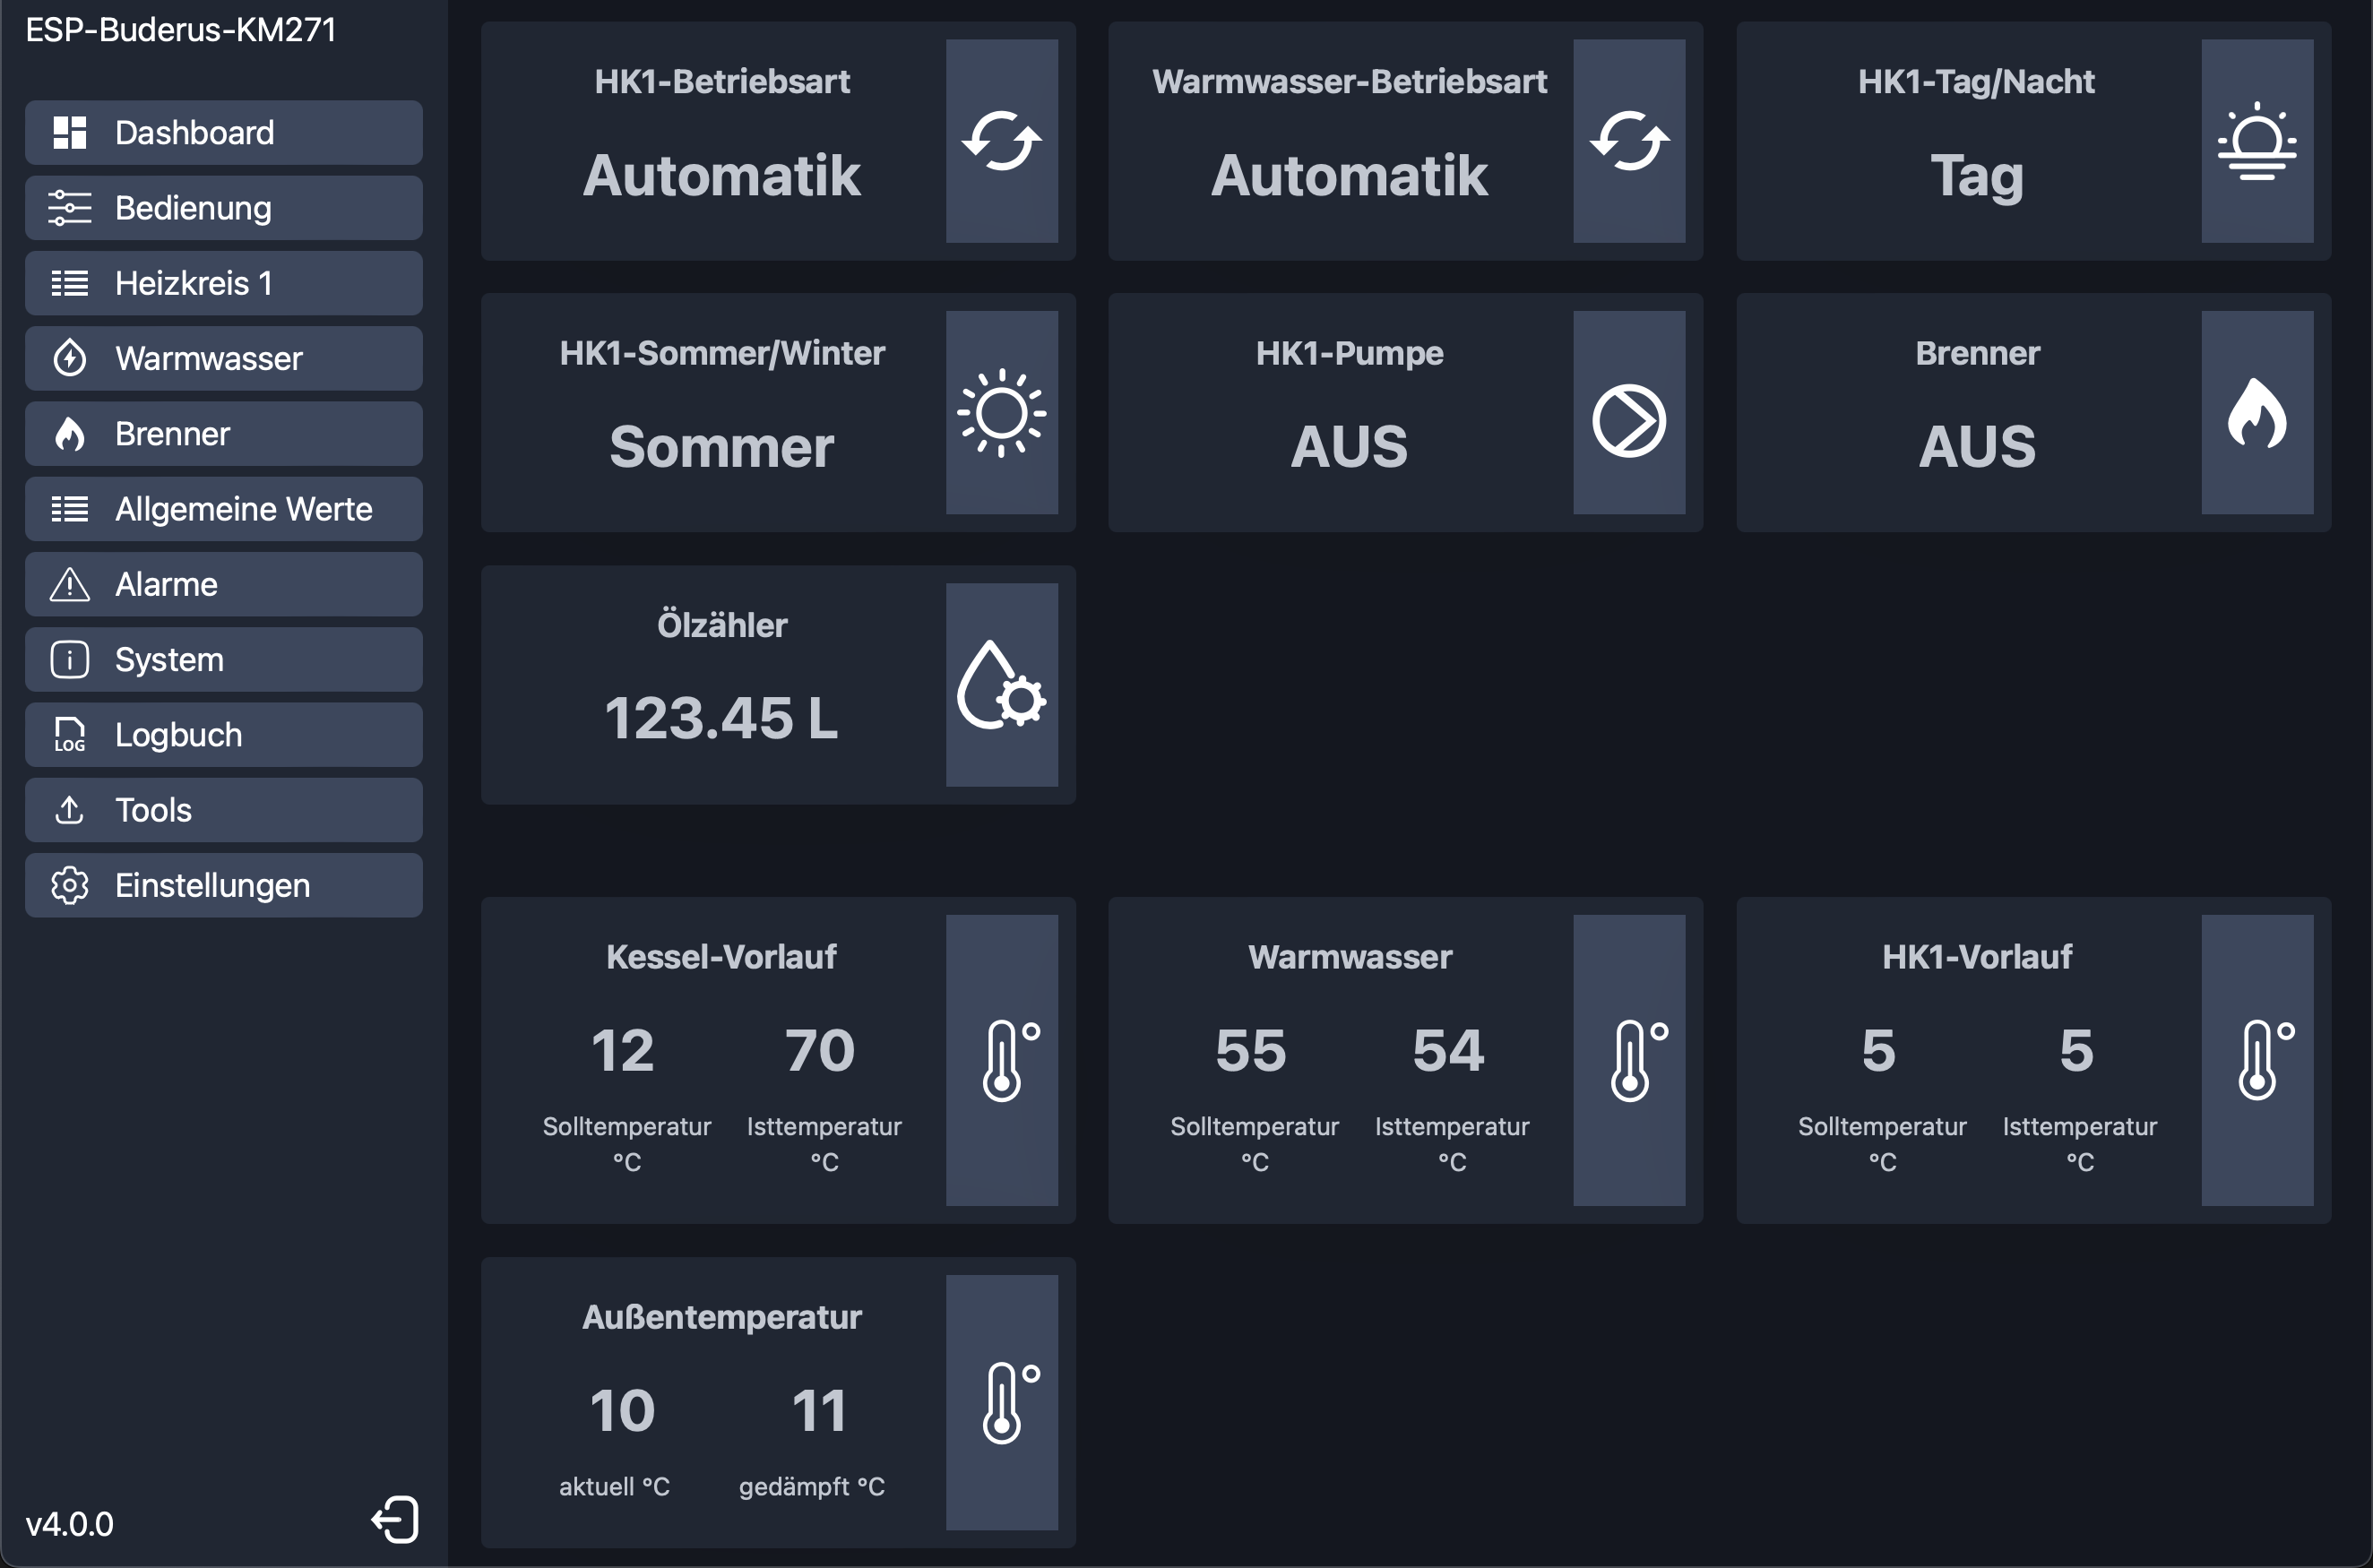
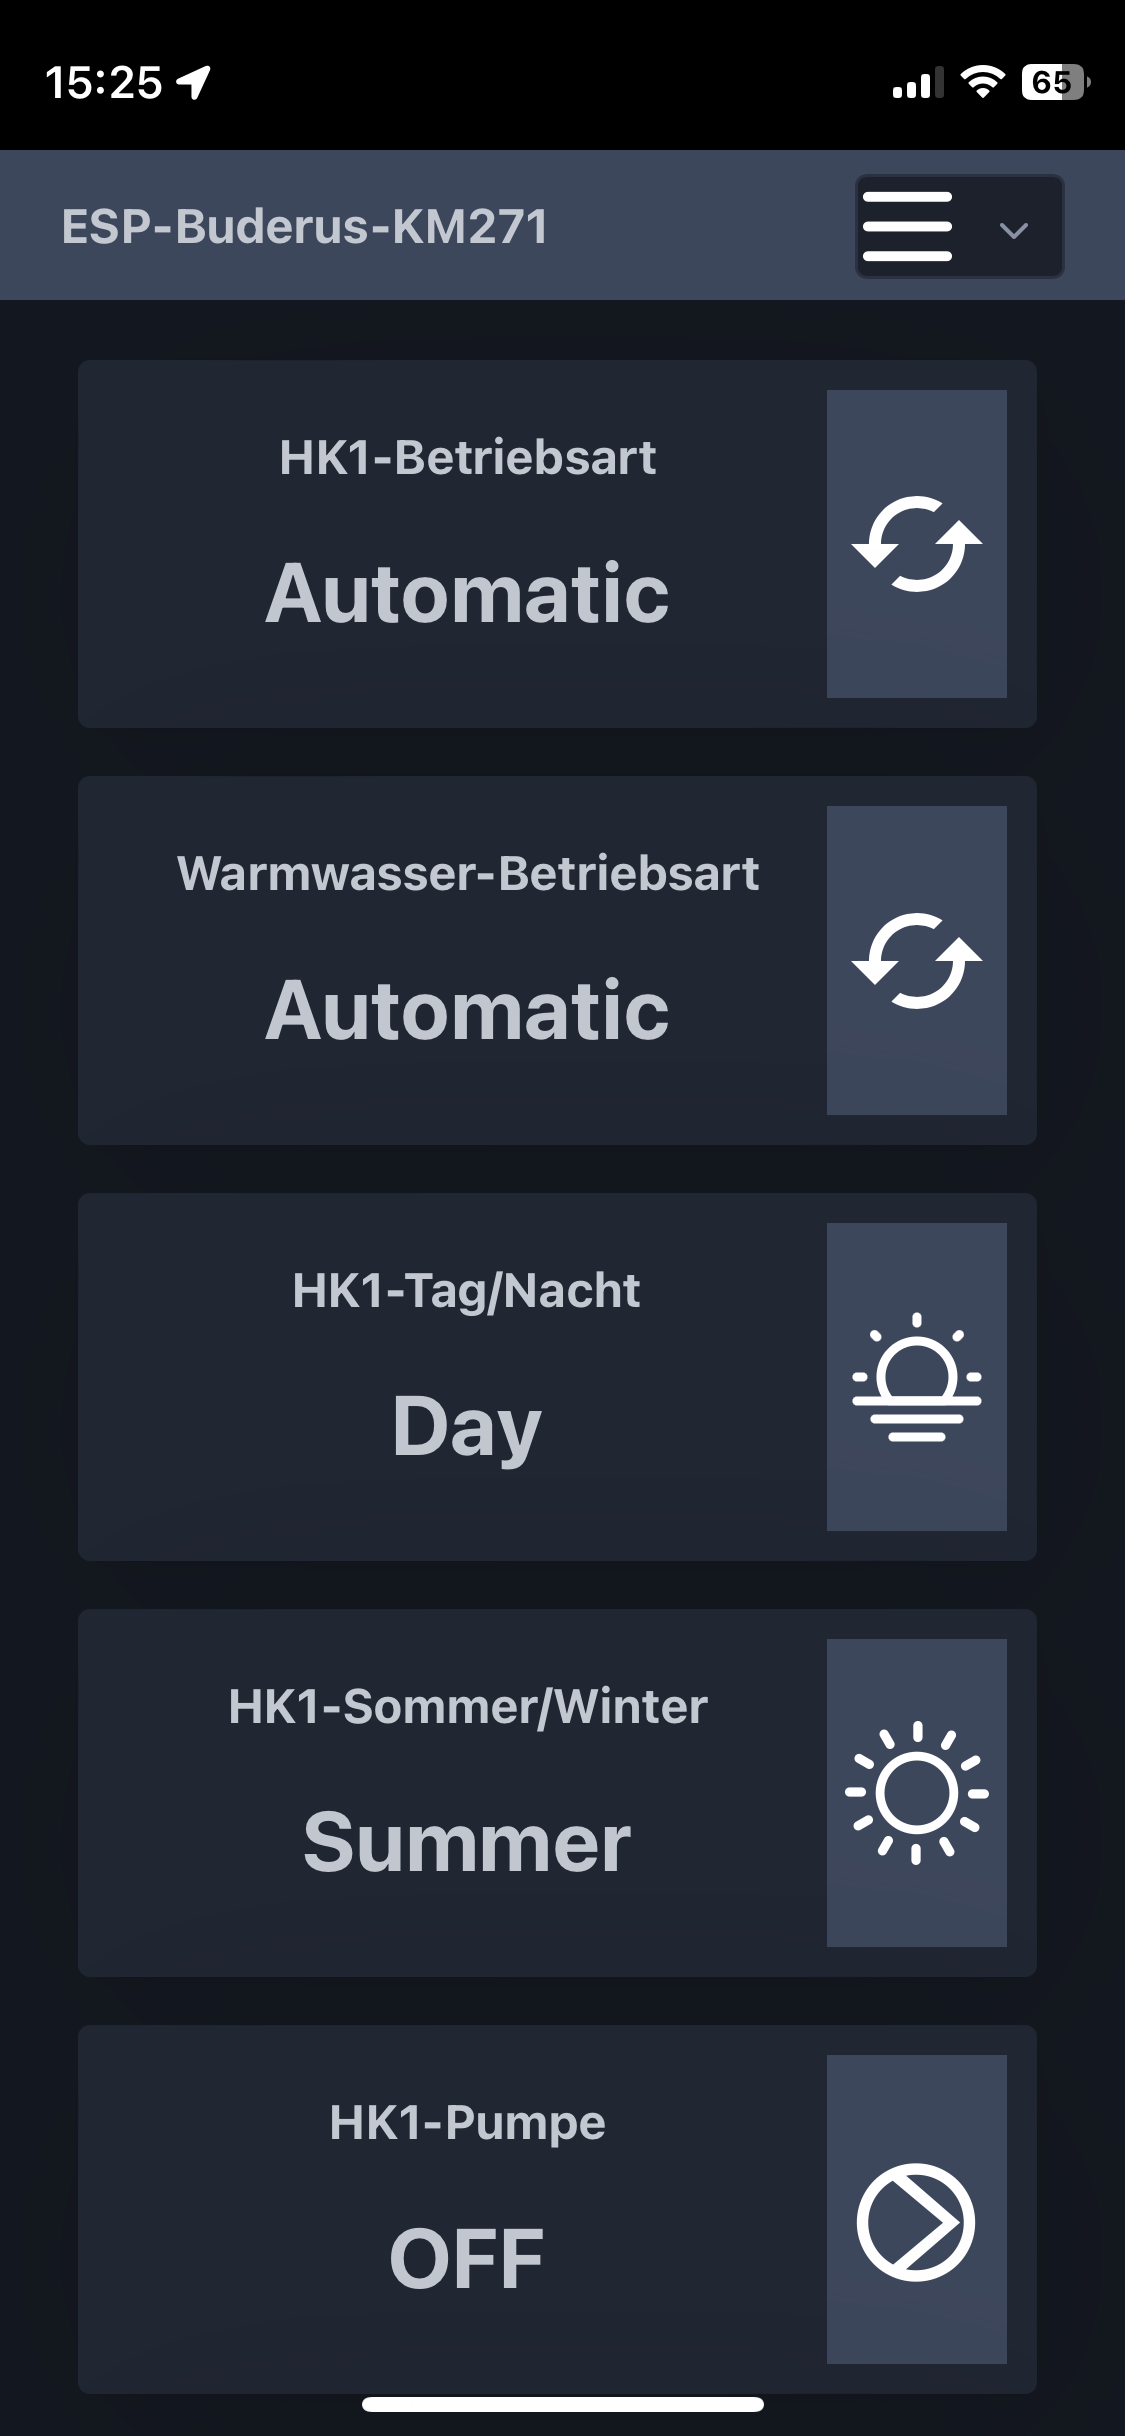
But there is also a build in WebUI to view and control your Logamatic without any other Software.
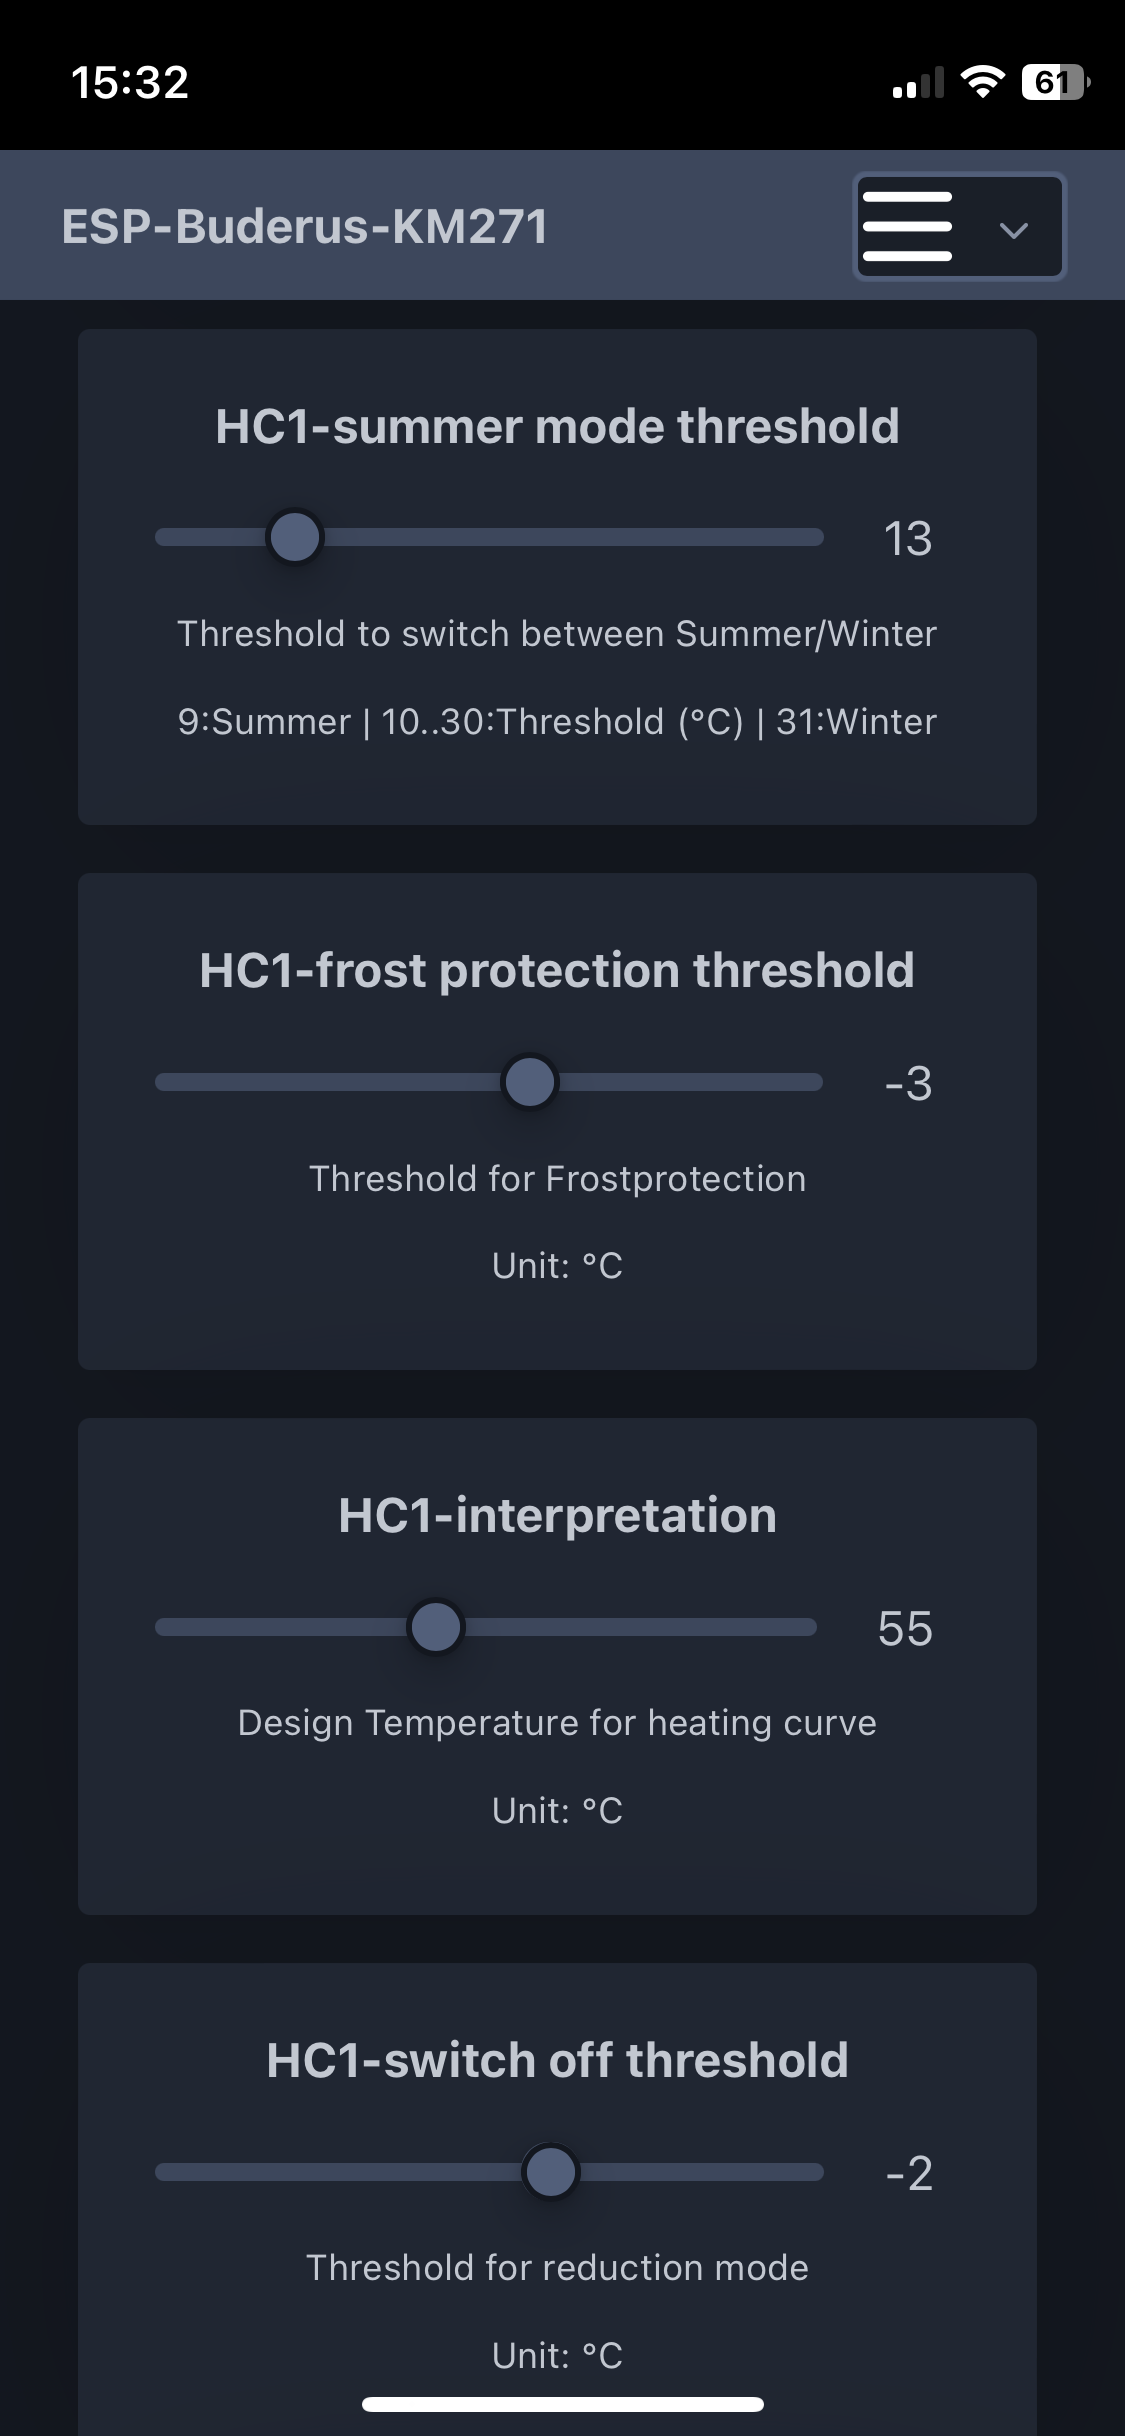
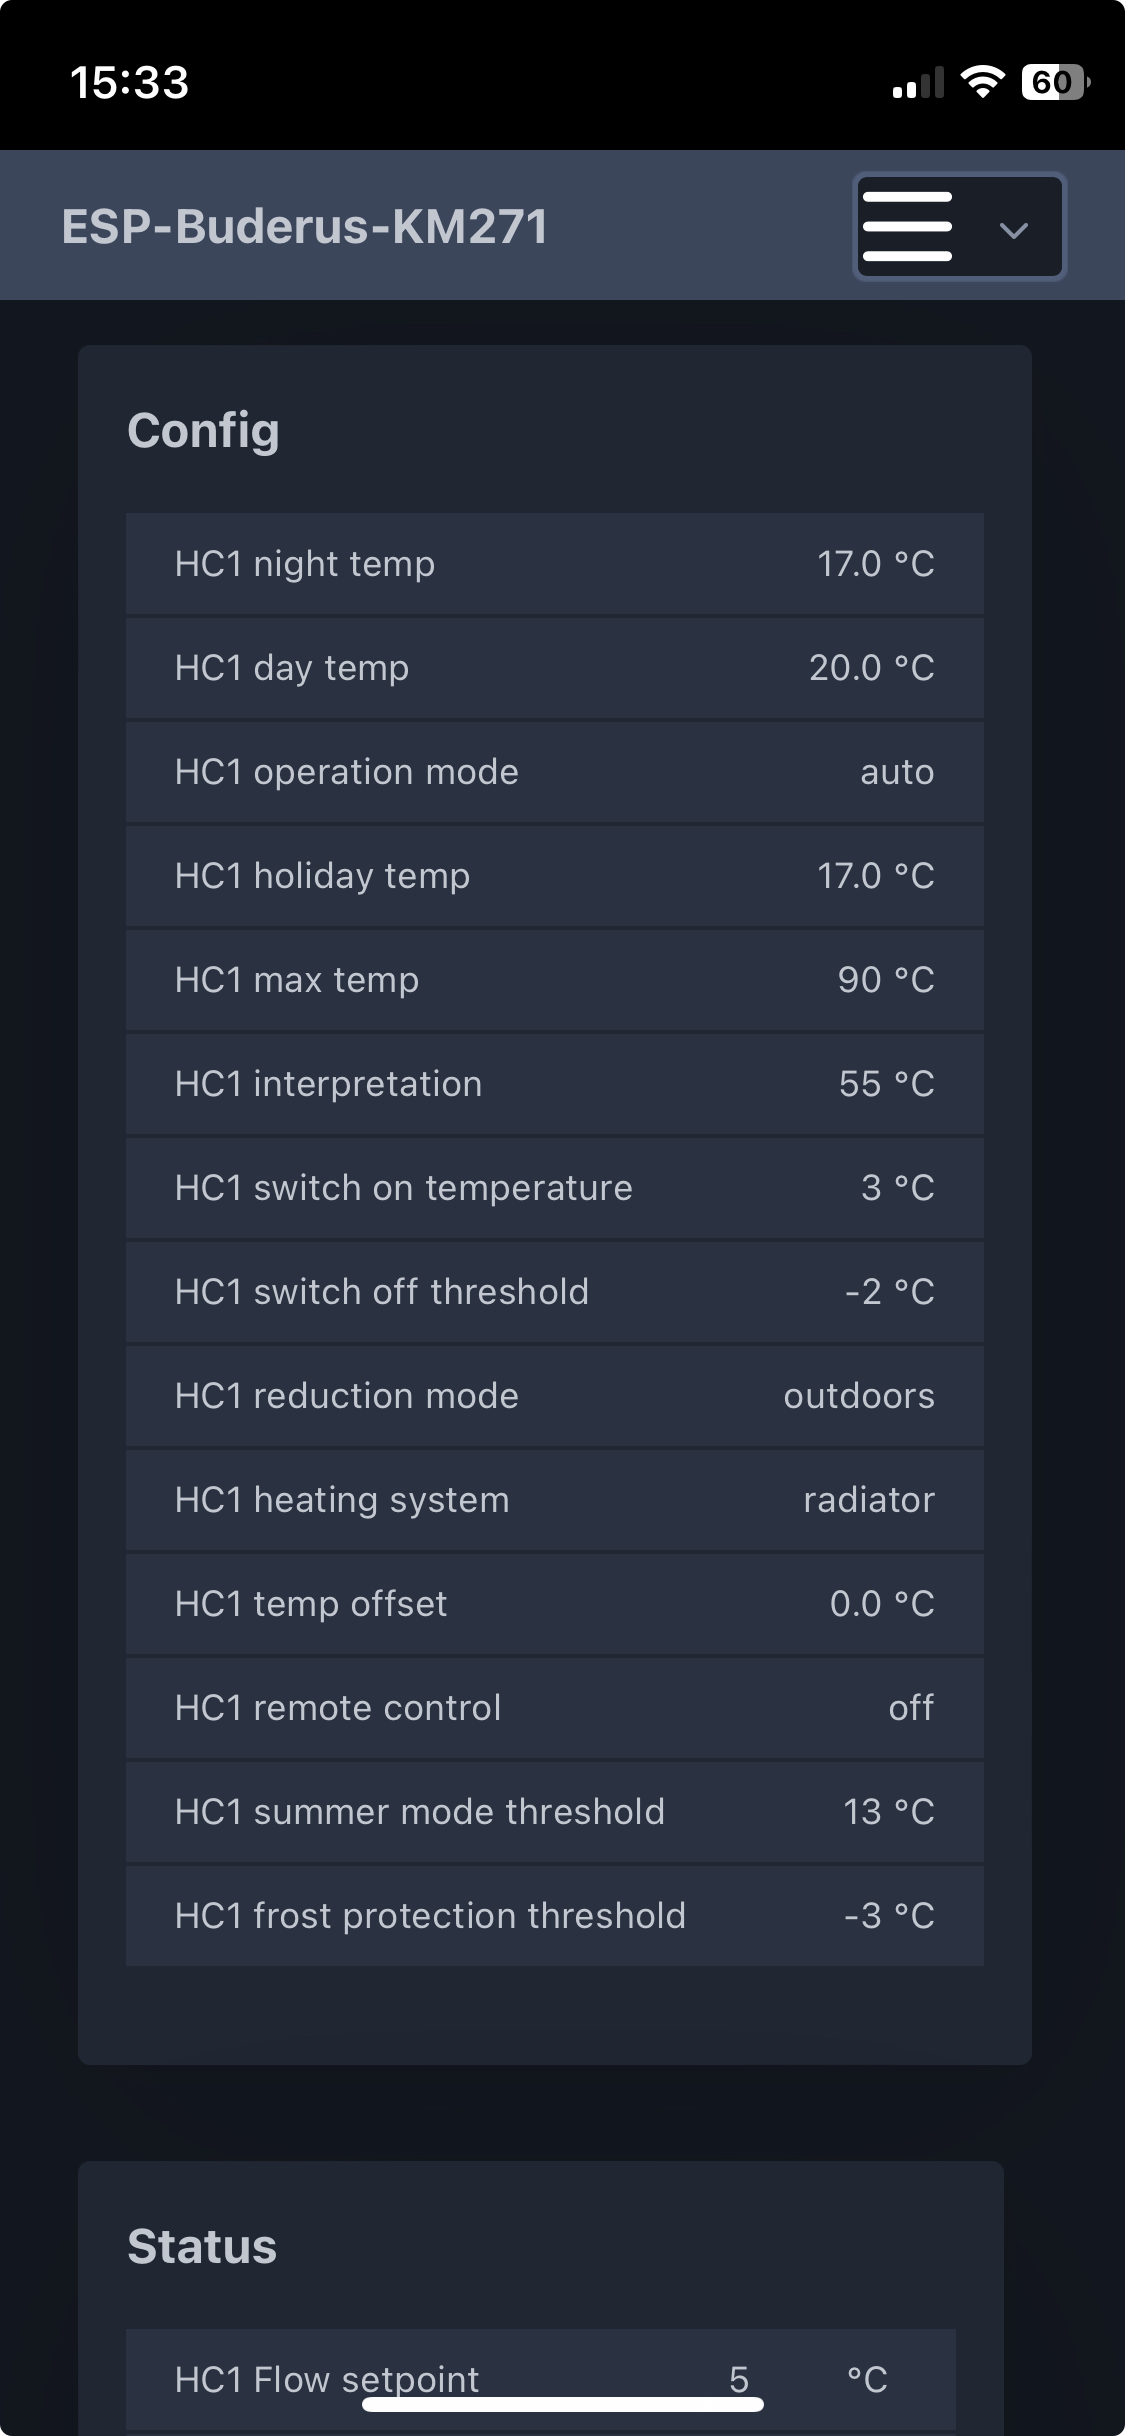
The WebUI is responsive and also offers a mobile layout.
The heart of the project is the reverse engineered Buderus interface, that is based on the 3964R Protocol.
The main code is based on the work of Michael Mayer who has set a really good base for the communication.
It has been extended with the possibility not only to read values, but also to write some common values to the Logamatic.
The software has multi language support and there is already german, and english texts available. It is also possible to add more languages.
Feel free to add more languages. The texts are located in: language.h and lang.js
The project includes also an additional and optional oilcounter implementation. I have installed a Braun HZ-5 Meter to measure the oil consumption.
There are different models with (HZ 5R, HZ 5DR) and without pulse output (HZ 5).
I have used the normal one without pulse output and modified it with a small reed contact - that works fine and was simple to install.
If you are not interested in the Oil Meter function you can simple disable it in config.h
the easiest, smartest and even cheapest option is the DIY Interface that was build by Daniel Glaser. Big thanks for his engagement in this Topic!
You can find more information here: https://github.com/the78mole/km271-wifi
You can order it here: https://www.tindie.com/products/24664/
In this case you only need this DIY interface and nothing more. It includes the RS232/TTL Adapter and also an ESP32.
 (this is my board with the customized connector for the oil meter instead of the "USER 1" button)
The other option is, to use the original Buderus KM271 Module that has a serial interface (RS232). In combination with a RS232 TTL Adapter (MAX3232) it can be connected to the TX/RX Port of the ESP.
Logamatic R2107 => KM271 => RS232/TTL Adapter => ESP
Example configuration:
(ESP32)GPIO17/TXD2  -> (MAX3232)TXD -> (serial cable) -> (KM271-SUBD)PIN2:RXD
(ESP32)GPIO16/RXD2 <- (MAX3232)RXD <- (serial cable) <- (KM271-SUBD)PIN3:TXD
(ESP32)GND <-> (MAX3232)GND <-> (serial cable) <-> (KM271-SUBD)PIN5:GND
The software is also prepared to connect an Oil Meter. A well-known manufacturer of oil meters is Braun with the models HZ-5 or HZ6.
These are already available with a potential-free contact.
I have used one without potential-free contact and have subsequently attached a reed contact. This was also very simple and works very reliably.
Note
but this is only optional and can be used additionally to the Information´s that the software will read from the Logamatic.
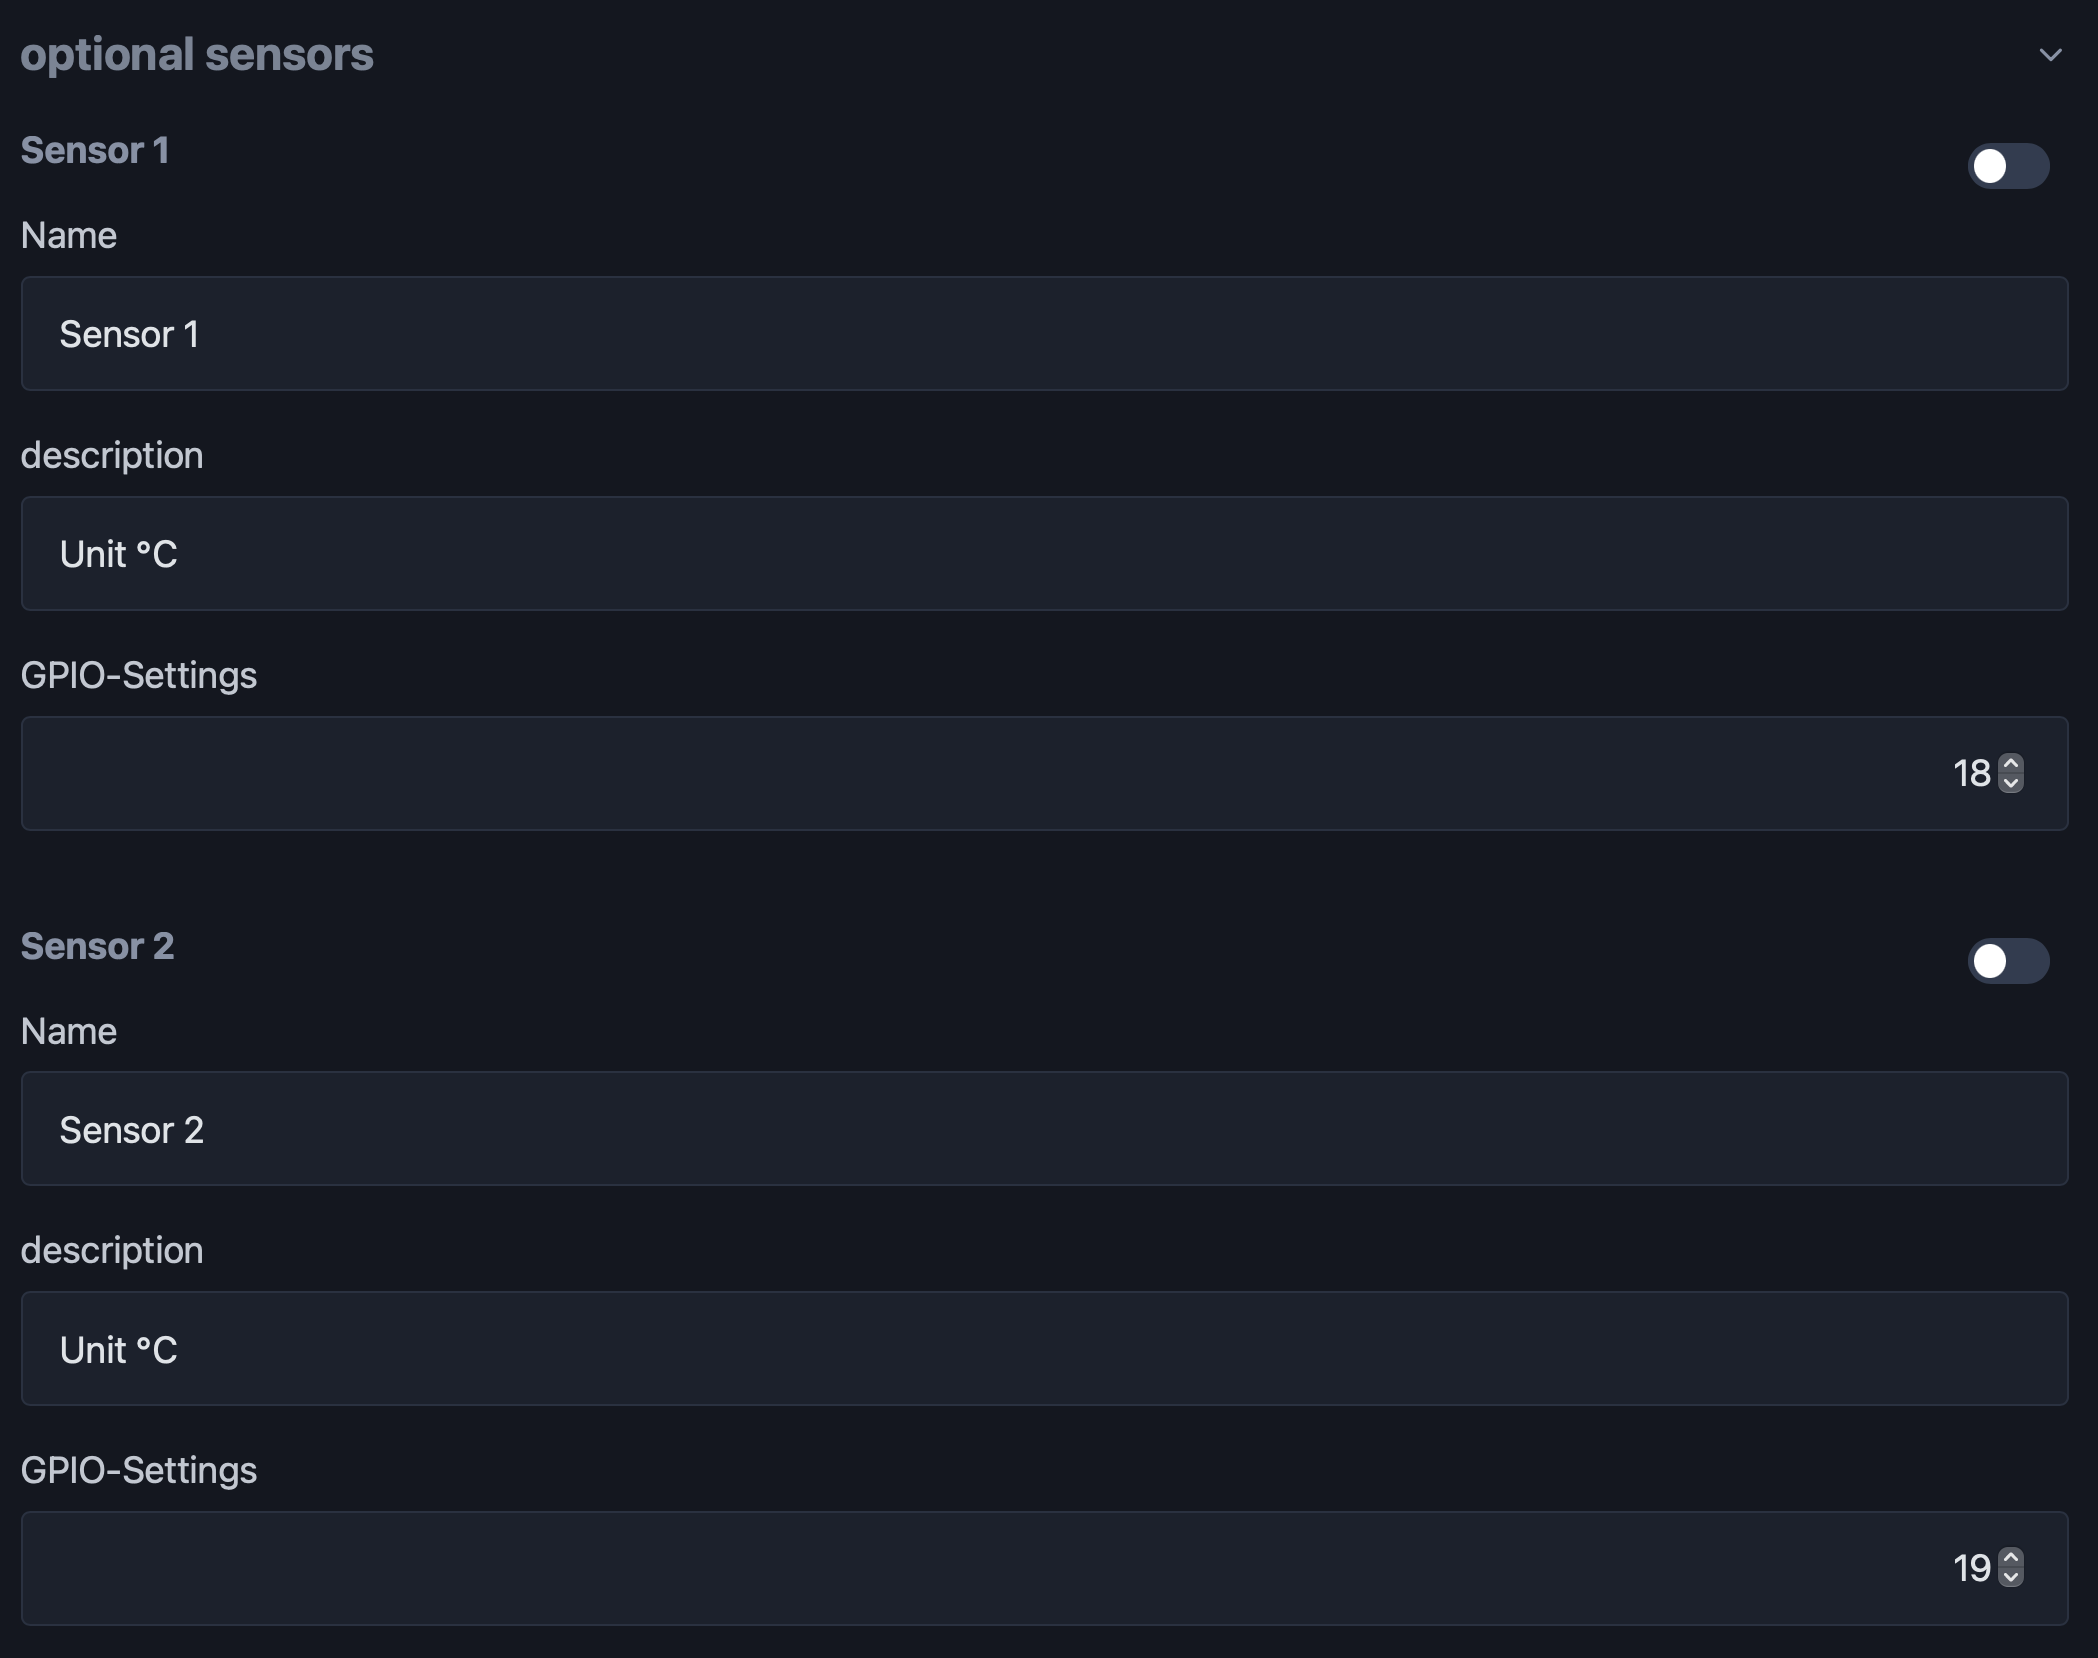
You can also configure additional OneWire Sensors (e.g. DS18B20). In the configuration you can setup one or two sensors.
The Sensor value will shown on the Dashboard and will also be send by mqtt with Topic sensor and the name that you can configure.
Depending on the hardware used, an additional resistor may need to be installed. Classically, the OneWire sensors are connected with a resistor of 4.7kOhm between VCC and the sensor cable and operated with 3.3V - 5V.
Only the GPIO to which the sensor cable is connected is specified in the configuration. The rest is hardware-dependent wiring.
(dashboard controls)
(settings)
Note
but this is only optional and can be used additionally to the Information´s that the software will read from the Logamatic.
The software is created with Visual Studio Code and the PlatformIO-Plugin.
After installing the software you can clone the project from GitHub or you can download it as zip and open it in PlatformIO.
Then adapt the upload_port and corresponding settings in platformio.ini to your USB-to-serial Adapter and upload the code to the ESP.
In the releases, you can find also the binary of the Software. If you don´t want to use PlatformIO, you can also use the buderus_km271_esp32_flash_vx.x.x.bin file and flash it directly on the ESP. This bin-file is already a merge with bootloader.bin, partitions.bin and the application.bin. You can flash this image an the ESP at address 0x00.
Windows
There are several tools available to flash binaries to the ESP.
One of them is espressif-flash-download-tool
macOS/Linux
for Mac it is hard to find a tool with a graphical UI, but you can simple use the esptool.py:
- open Terminal
- install esptool:
pip install esptool - optional get the install path:
which esptool.py - set path:
export PATH="$PATH:/<path>/esptool.py"(<- change with result from 3.) - goto path where the bin file is located
- get Device String:
ls /dev/tty* | grep usb(use this in next Step for ) - upload:
esptool.py -p <UPLOAD-PORT> write_flash 0x00 buderus_km271_esp32_flash_vx.x.x.bin
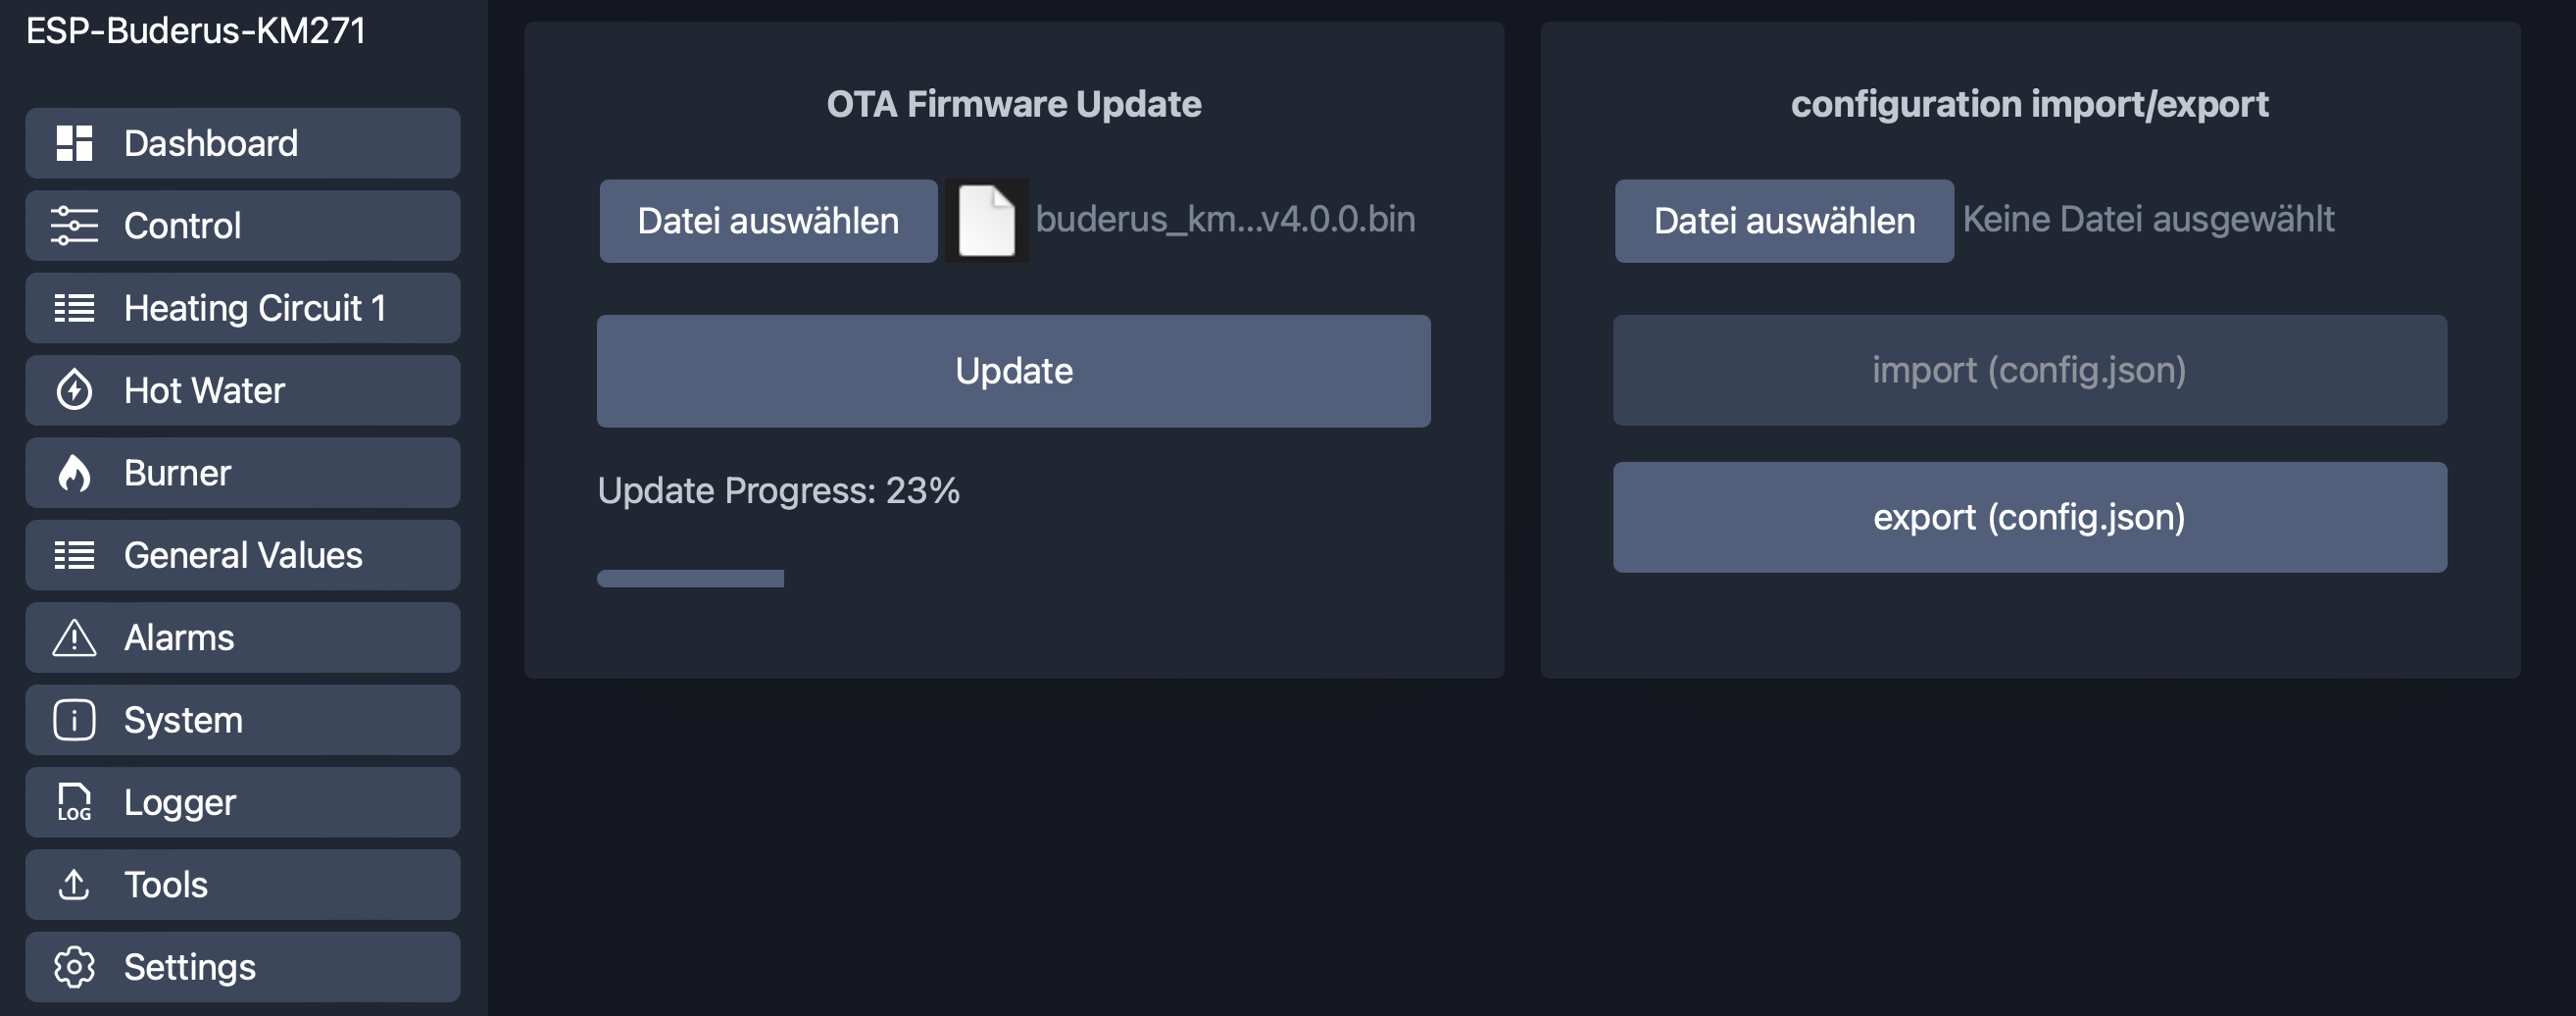
since software version 3.0, you can also update the software with the new Elegant OTA web upload.
You can find the update function in the "Tools" Tab of the WebUI.
here you can choose "Firmware" and select the buderus_km271_ota_update_vx.x.x.bin file from the release section
But it is also possible to download the software wireless with platformio. Therefore there is a new file platformio_upload.py that you dont have to change.
You only have to change the upload_port settings in platformio.ini
There are 3 predefined Options:
- OPTION 1: direct cable upload
- OPTION 2: wireless OTA Update
There is a "Setup Mode" available. The "Setup Mode" is activated, when you press the "reset-button" of the ESP two times within 3 Seconds. The "Setup Mode" will also activated if there is no wifi connection configured.
If the ESP goes into "Setup Mode", it will automatically create a own network access point with ssid
📶 "ESP-Buderus-KM271"
After you are connected to this network, you can open the webUI on ip-address
"http://192.168.4.1"
Here you can setup all the configuration that fits to your heating system and your infrastructure.
-
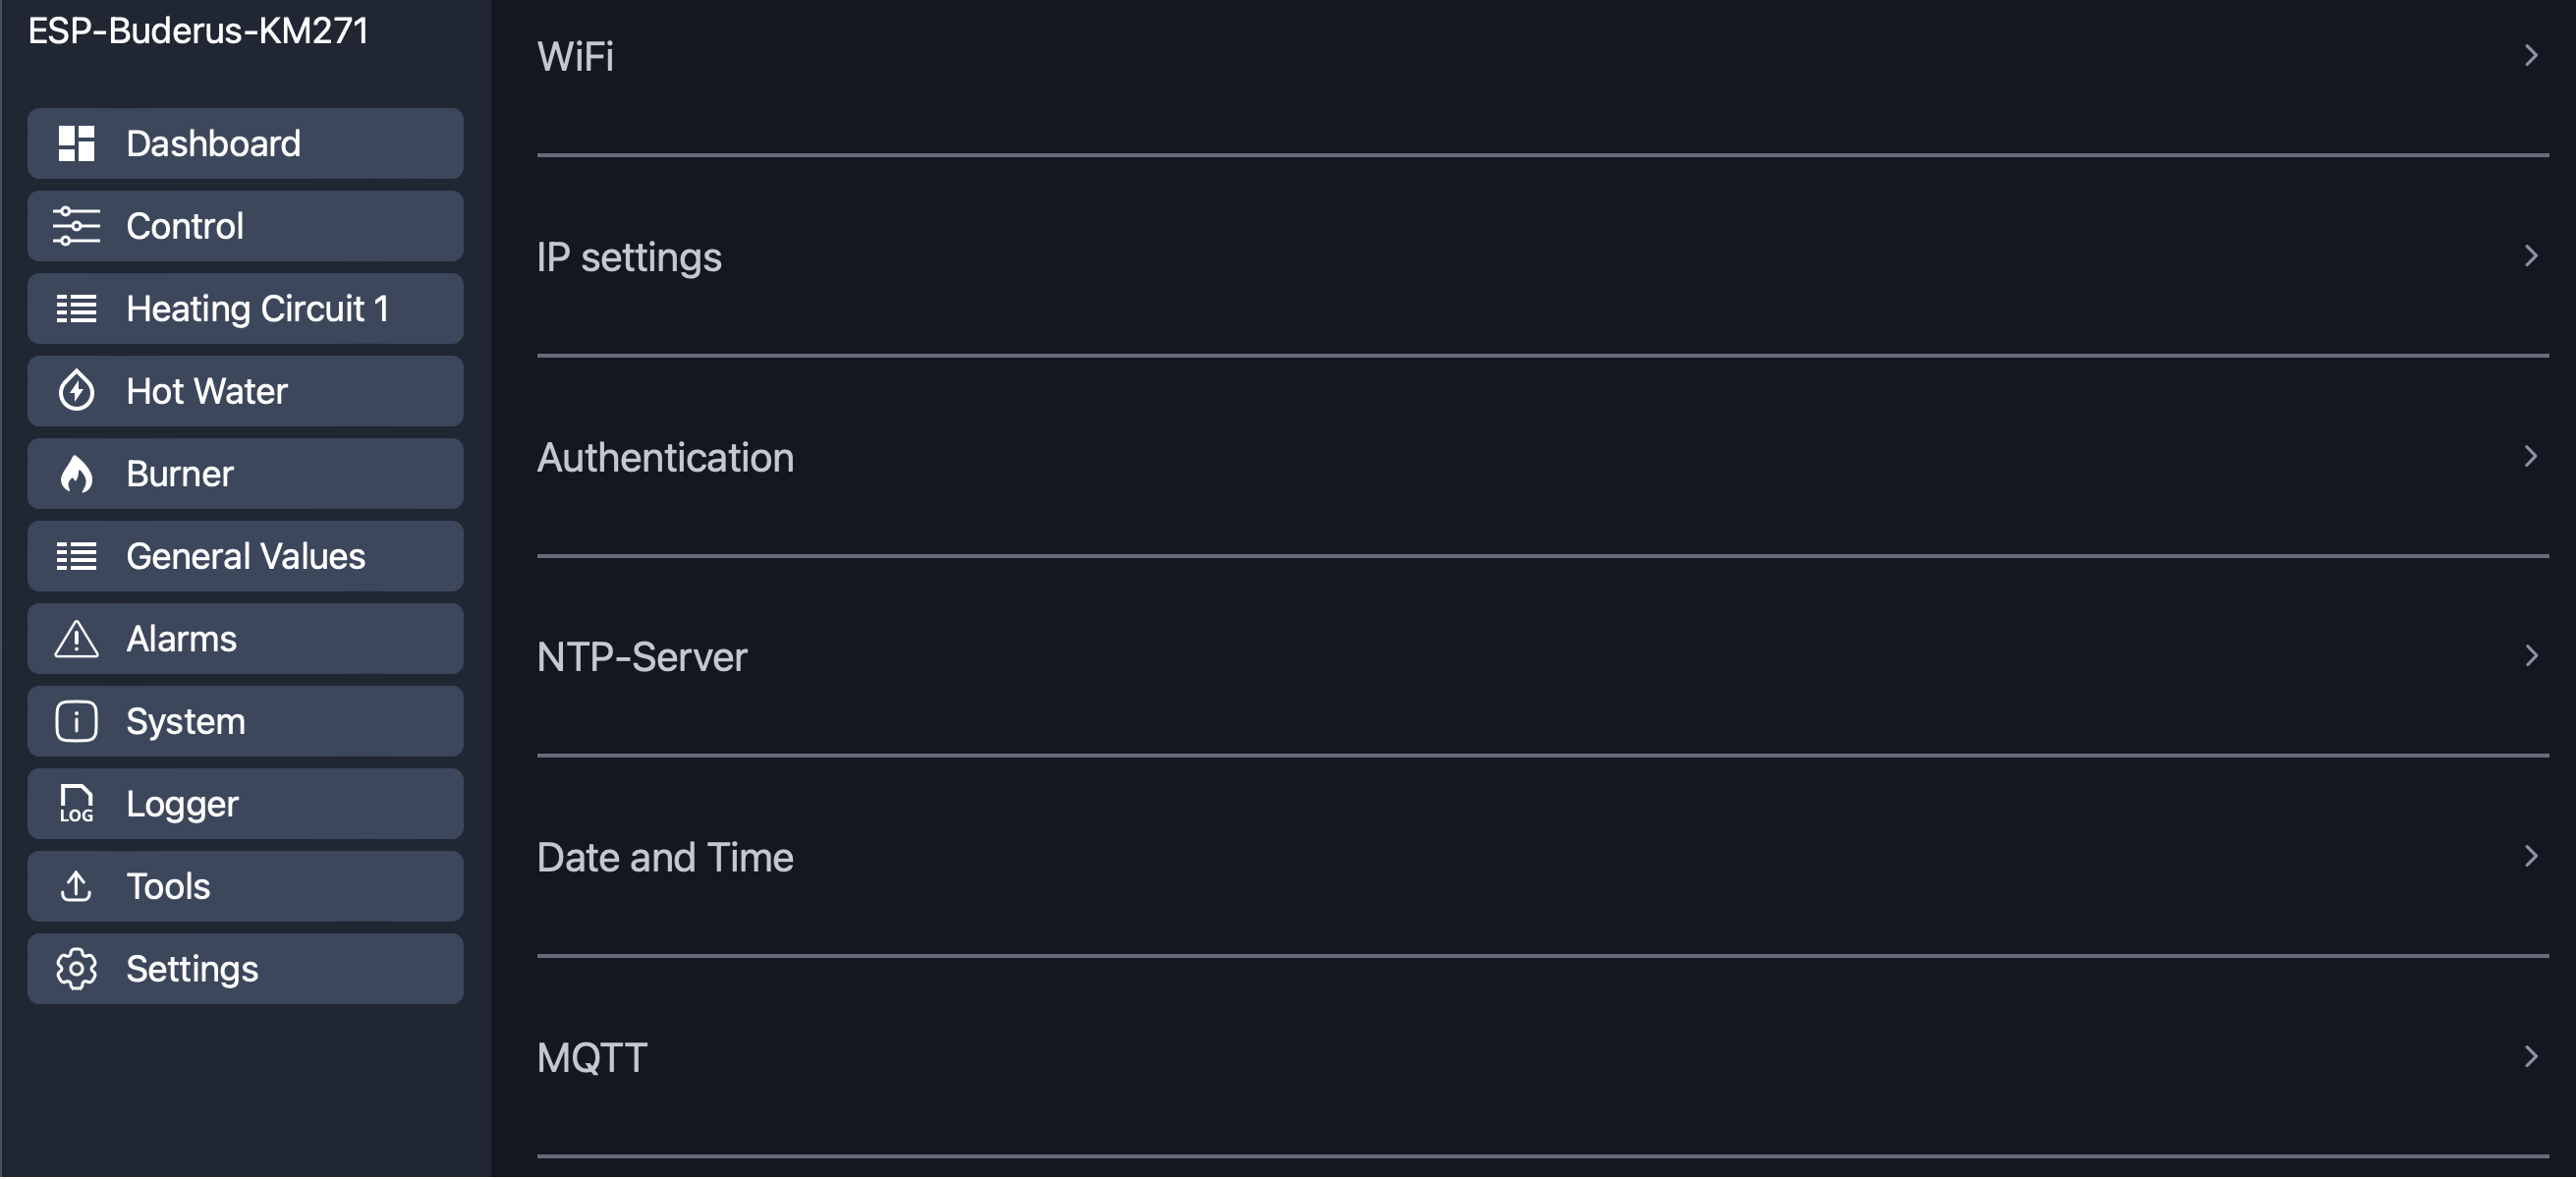
WiFi
enter your WiFi credentials to connect the ESP to your network -
IP Settings
instead of DHCP, you can configure a static IP address, Subnet, Gateway and DNS -
Authentication
you can activate the authentication feature and configure user and password. -
NTP Server
the ESP can connect to a NTP server to get the right Time information. The default Time-Zone should fit if you are located in germany. Otherwise you can change it manually -
Date and Time
Here you can write a new Date and Time to the Logamatic heating system. (manual or actual NTP-Server time) -
MQTT
here you can activate the MQTT communication and enter mandatory parameters All the parameters are mandatory! -
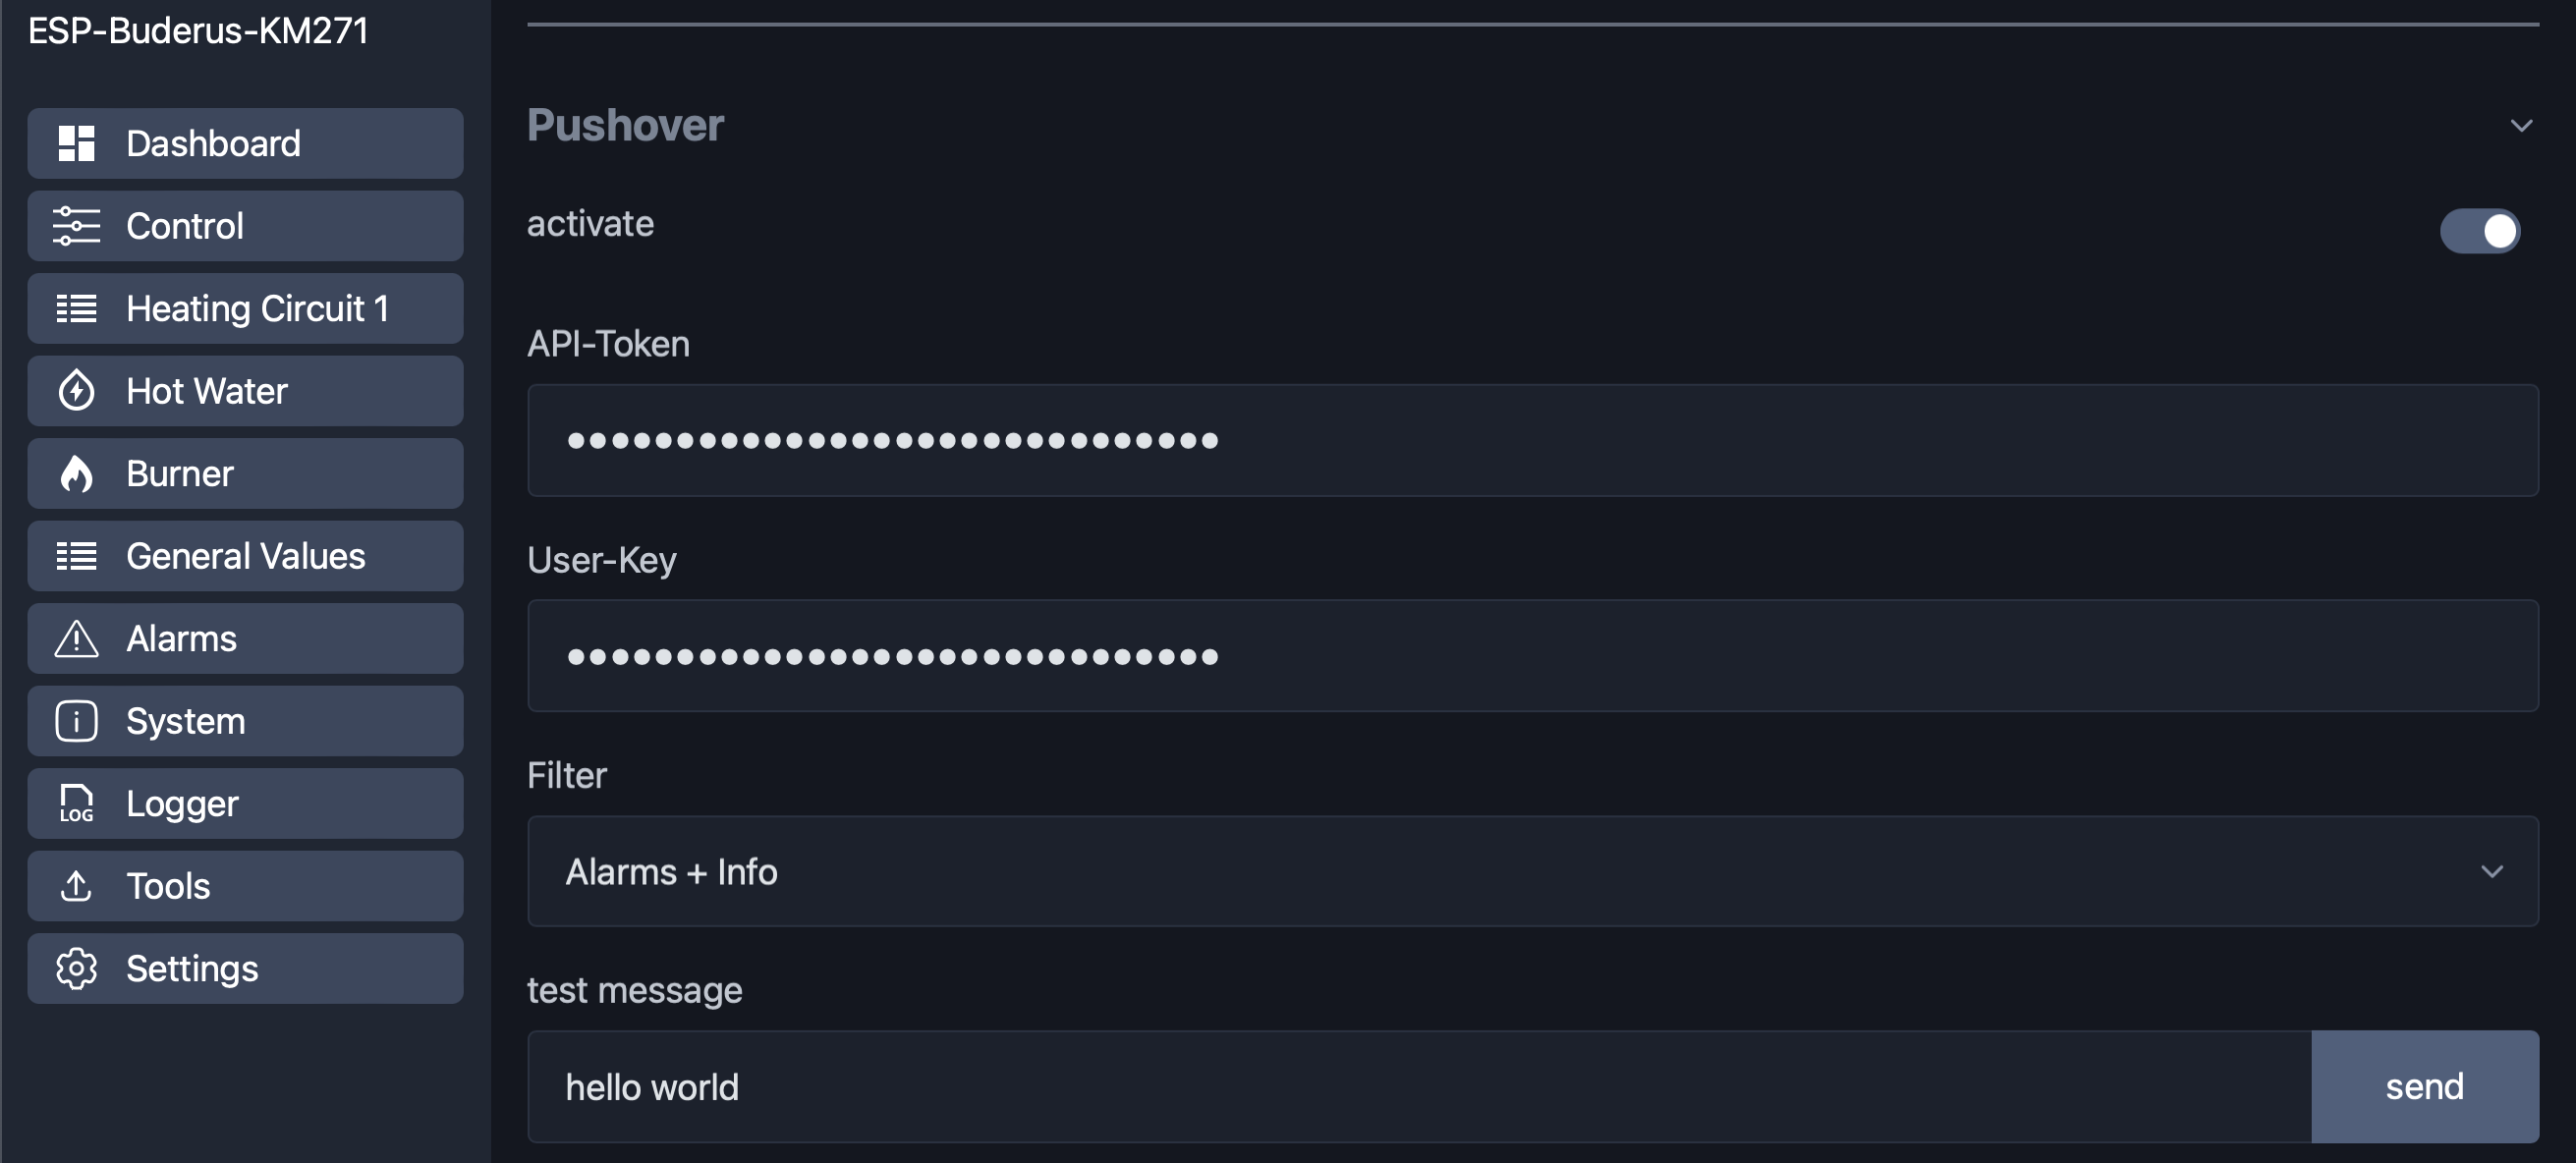
Pushover
Parameters for Pushover notifications.
(API-Token and User-Key)
You can also send a test message here. -
Logamatic
here you can select, which components of your Logamatic should be used. -
GPIO
Here you can configure the GPIO of your ESP-Board. You can use the options in the dropdown to get default values depending of the selected type of board. -
Oil Meter
here you can enable the optional hardware or virtual Oil Meter. If you use a hardware based Oil Meter, you have to configure also to regarding gpio´s. If you want to calculate the consumption based on the runtime, you have to configure the additional calculation parameters. -
optional sensors
Activation and configuration of optional DS18B20 -
Simulation
Activate Simulation-Mode to generate Logamatic values for testing purposes -
Language
There are two languages available. Choose what you prefer. The language take effect on the webUI and also on the mqtt messages!
Note
All settings are automatically saved when changes are made
there is also a buildin file manager to download (export), upload (imoort) and delete files.
The configuration is stored in the config.json file. To backup and restore the configuration you can download and upload this file.
The drd.dat is an internal file to store information for the "double-reset-detection". Do not delete this one.
Note
You can set a separate language for the mqtt topics in the mqtt settings that is independent of the webUI language.
The Software handles different kind of values:
this are config values from the Logamatic. The values are read at startup or if you change them at the Logamatic. The payload of the values are integer or float.
Config values as single topics (see list in param.txt)
example:
Topic: esp_heizung/config/frost_protection_threshold
Payload:   -1.00 °C     (String)
this values will mostly change during runtime and will automatically send if changed. The payload of the values is a String.
Status values as single topics (see list in param.txt)
example:
Topic: esp_heizung/status/hc1_ov1_automatic
Payload:   1    (integer)
status information about WiFi:
Topic: esp_heizung/wifi = {
    "status":"online",
    "rssi":"-50",
    "signal":"90",
    "ip":"192.168.1.1",
    "date-time":"01.01.2022 - 10:20:30"
}
debug information:
Topic: esp_heizung/info = {
    "logmode":true,
    "send_cmd_busy":false,
    "date-time":"01.01.2022 - 10:20:30"
}
here you get the information about the last 4 Errors/Faults that are registered by the Logamatic. The payload of the values is a String.
Note
A complete List of supported values can be found in the param.txt
you can also change the mqtt topics for your needs by editing: language.h
To change the values of your Logamatic, you can use several setvalue commands from the list below.
A complete Topic could be esp_heizung/setvalue/setdatetime
You can control the Logamatic with commands like this:
command:    restart ESP
topic:      {cmd/restart", cmd/restart"}
payload:    none

command:    Service interface - only for Experts - use at your own risk!!!
topic:      {cmd/service", cmd/service"}
payload:    8 hex values separated with "_" (example: 08_15_04_65_65_65_65_65)

command:    debug function - on/off
topic:      {cmd/debug", cmd/debug"}
payload:    0/1

command:    debug function - set Filter
topic:      {cmd/setdebugflt", cmd/setdebugflt"}
payload:    11 hex values separated with "_" (example: 08_15_XX_XX_XX_XX_XX_XX_XX_XX_XX)

command:    debug function - get Filter
topic:      {cmd/getdebugflt", cmd/getdebugflt"}
payload:    none (return value at message topic)

command:    set date & time of Logamatic
topic:      {"setvalue/setdatetime", setvalue/setdatetime"}
payload:    none

command:    set oilcounter to given value
topic:      {"setvalue/oilcounter", setvalue/oilcounter"}
payload:    counter value including decimals (123,45L = 1234)

command:    heating circuit 1: operation mode
topic:      {"setvalue/hk1_betriebsart", setvalue/hc1_opmode"}
payload:    0=night / 1=day / 2=auto

command:    heating circuit 2: operation mode
topic:      {"setvalue/hk2_betriebsart", setvalue/hc2_opmode"}
payload:    (0=night / 1=day / 2=auto)

command:    heating circuit 1: program
topic:      {"setvalue/hk1_programm", setvalue/hc1_program"}
payload:    (0=custom / 1=family / 2=early / 3=late / 4=AM / 5=PM / 6=noon / 7=single / 8=senior)

command:    heating circuit 2: program
topic:      {"setvalue/hk2_programm", setvalue/hc2_program"}
payload:    (0=custom / 1=family / 2=early / 3=late / 4=AM / 5=PM / 6=noon / 7=single / 8=senior)

command:    heating circuit 1: design temperature for heating curves
topic:      {"setvalue/hk1_auslegung", setvalue/hc1_interpretation"}
payload:    Resolution: 1 [°C] - Range: 30 ... 90 [°C]

command:    heating circuit 2: design temperature for heating curves
topic:      {"setvalue/hk2_auslegung", setvalue/hc2_interpretation"}
payload:    Resolution: 1 [°C] - Range: 30 ... 90 [°C]

command:    heating circuit 1: switch off threshold for reduction mode
topic:      {"setvalue/hk1_aussenhalt_ab", setvalue/hc1_switch_off_threshold"}
payload:    Resolution: 1 [°C] - Range: -20 ... +10 [°C]

command:    heating circuit 2: switch off threshold for reduction mode
topic:      {"setvalue/hk2_aussenhalt_ab", setvalue/hc2_switch_off_threshold"}
payload:    Resolution: 1 [°C] - Range: -20 ... +10 [°C]

command:    heating circuit 1: day temperature setpoint
topic:      {"setvalue/hk1_tag_soll", setvalue/hc1_day_setpoint"}
payload:    Resolution: 0.5 [°C] - Range: 10 .. 30 [°C]

command:    heating circuit 2: day temperature setpoint
topic:      {"setvalue/hk2_tag_soll", setvalue/hc2_day_setpoint"}
payload:    Resolution: 0.5 [°C] - Range: 10 .. 30 [°C]

command:    heating circuit 1: night temperature setpoint
topic:      {"setvalue/hk1_nacht_soll", setvalue/hc1_night_setpoint"}
payload:    Resolution: 0.5 [°C] - Range: 10 .. 30 [°C]

command:    heating circuit 2: night temperature setpoint
topic:      {"setvalue/hk2_nacht_soll", setvalue/hc2_night_setpoint"}
payload:    Resolution: 0.5 [°C] - Range: 10 .. 30 [°C]

command:    heating circuit 1: holiday temperature setpoint
topic:      {"setvalue/hk1_ferien_soll", setvalue/hc1_holiday_setpoint"}
payload:    Resolution: 0.5 [°C] - Range: 10 .. 30 [°C]

command:    heating circuit 2: holiday temperature setpoint
topic:      {"setvalue/hk2_ferien_soll", setvalue/hc2_holiday_setpoint"}
payload:    Resolution: 0.5 [°C] - Range: 10 .. 30 [°C]

command:    warm water: operation mode
topic:      {"setvalue/ww_betriebsart", setvalue/ww_opmode"}
payload:    0=night / 1=day / 2=auto

command:    heating circuit 1: summer mode threshold Temperature
topic:      {"setvalue/hk1_sommer_ab", setvalue/hc1_summer_mode_threshold"}
payload:    Resolution: 1 [°C] - Range: 9:Summer | 10°..30° | 31:Winter

command:    heating circuit 2: summer mode threshold Temperature
topic:      {"setvalue/hk2_sommer_ab", setvalue/hc2_summer_mode_threshold"}
payload:    Resolution: 1 [°C] - Range: 9:Summer | 10°..30° | 31:Winter

command:    heating circuit 1: frost mode threshold Temperature
topic:      {"setvalue/hk1_frost_ab", setvalue/hc1_frost_mode_threshold"}
payload:    Resolution: 1 [°C] - Range: -20 ... +10 [°C]

command:    heating circuit 2: frost mode threshold Temperature
topic:      {"setvalue/hk2_frost_ab", setvalue/hc2_frost_mode_threshold"}
payload:    Resolution: 1 [°C] - Range: -20 ... +10 [°C]

command:    warm water: setpoint temperature
topic:      {"setvalue/ww_soll", setvalue/ww_setpoint"}
payload:    Resolution: 1 [°C] - Range: 30 ... 60 [°C]

command:    heating circuit 1: count of days for holiday mode (Logamatic will decrement every day by one)
topic:      {"setvalue/hk1_ferien_tage", setvalue/hc1_holidays"}
payload:    count of days 0 .. 99

command:    heating circuit 2: count of days for holiday mode (Logamatic will decrement every day by one)
topic:      {"setvalue/hk1_ferien_tage", setvalue/hc1_holidays"}
payload:    count of days 0 .. 99

command:    warm water pump cycles
topic:      {"setvalue/ww_pumpen_zyklus", setvalue/ww_pump_cycles"}
payload:    Resolution: 1 [cycles/hour] - Range: 0:OFF | 1..6 | 7:ON

command:    heating circuit 1: controller intervention
topic:      {"setvalue/hk1_reglereingriff", setvalue/hc1_ctrl_intervention"}
payload:    Resolution: 1 [°C] - Range: 0 ... +10 [°C]

command:    heating circuit 2: controller intervention
topic:      {"setvalue/hk2_reglereingriff", setvalue/hc2_ctrl_intervention"}
payload:    Resolution: 1 [°C] - Range: 0 ... +10 [°C]

command:    heating circuit 1: reduction mode
topic:      {"setvalue/hk1_absenkungsart", setvalue/hc1_reduction_mode"}
payload:    Number 0..3 (Abschalt,Reduziert,Raumhalt,Aussenhalt) / {off,fixed,room,outdoors)

command:    heating circuit 2: reduction mode
topic:      {"setvalue/hk2_absenkungsart", setvalue/hc2_reduction_mode"}
payload:    Number 0..3 (Abschalt,Reduziert,Raumhalt,Aussenhalt) / {off,fixed,room,outdoors)
in addition to mqtt there are more options for notification.
In addition there is also a custom notification as Pushover client. Depending on the parameter "Filter", you can define what kind of messages you want to receive. In the settings you can find all necessary parameters to setup the client.
Each application, service, or utility that sends notifications through Pushover's API needs to have its own API token which uniquely identifies all of the API requests that it makes. API tokens are free and can be registered through Pushover website.
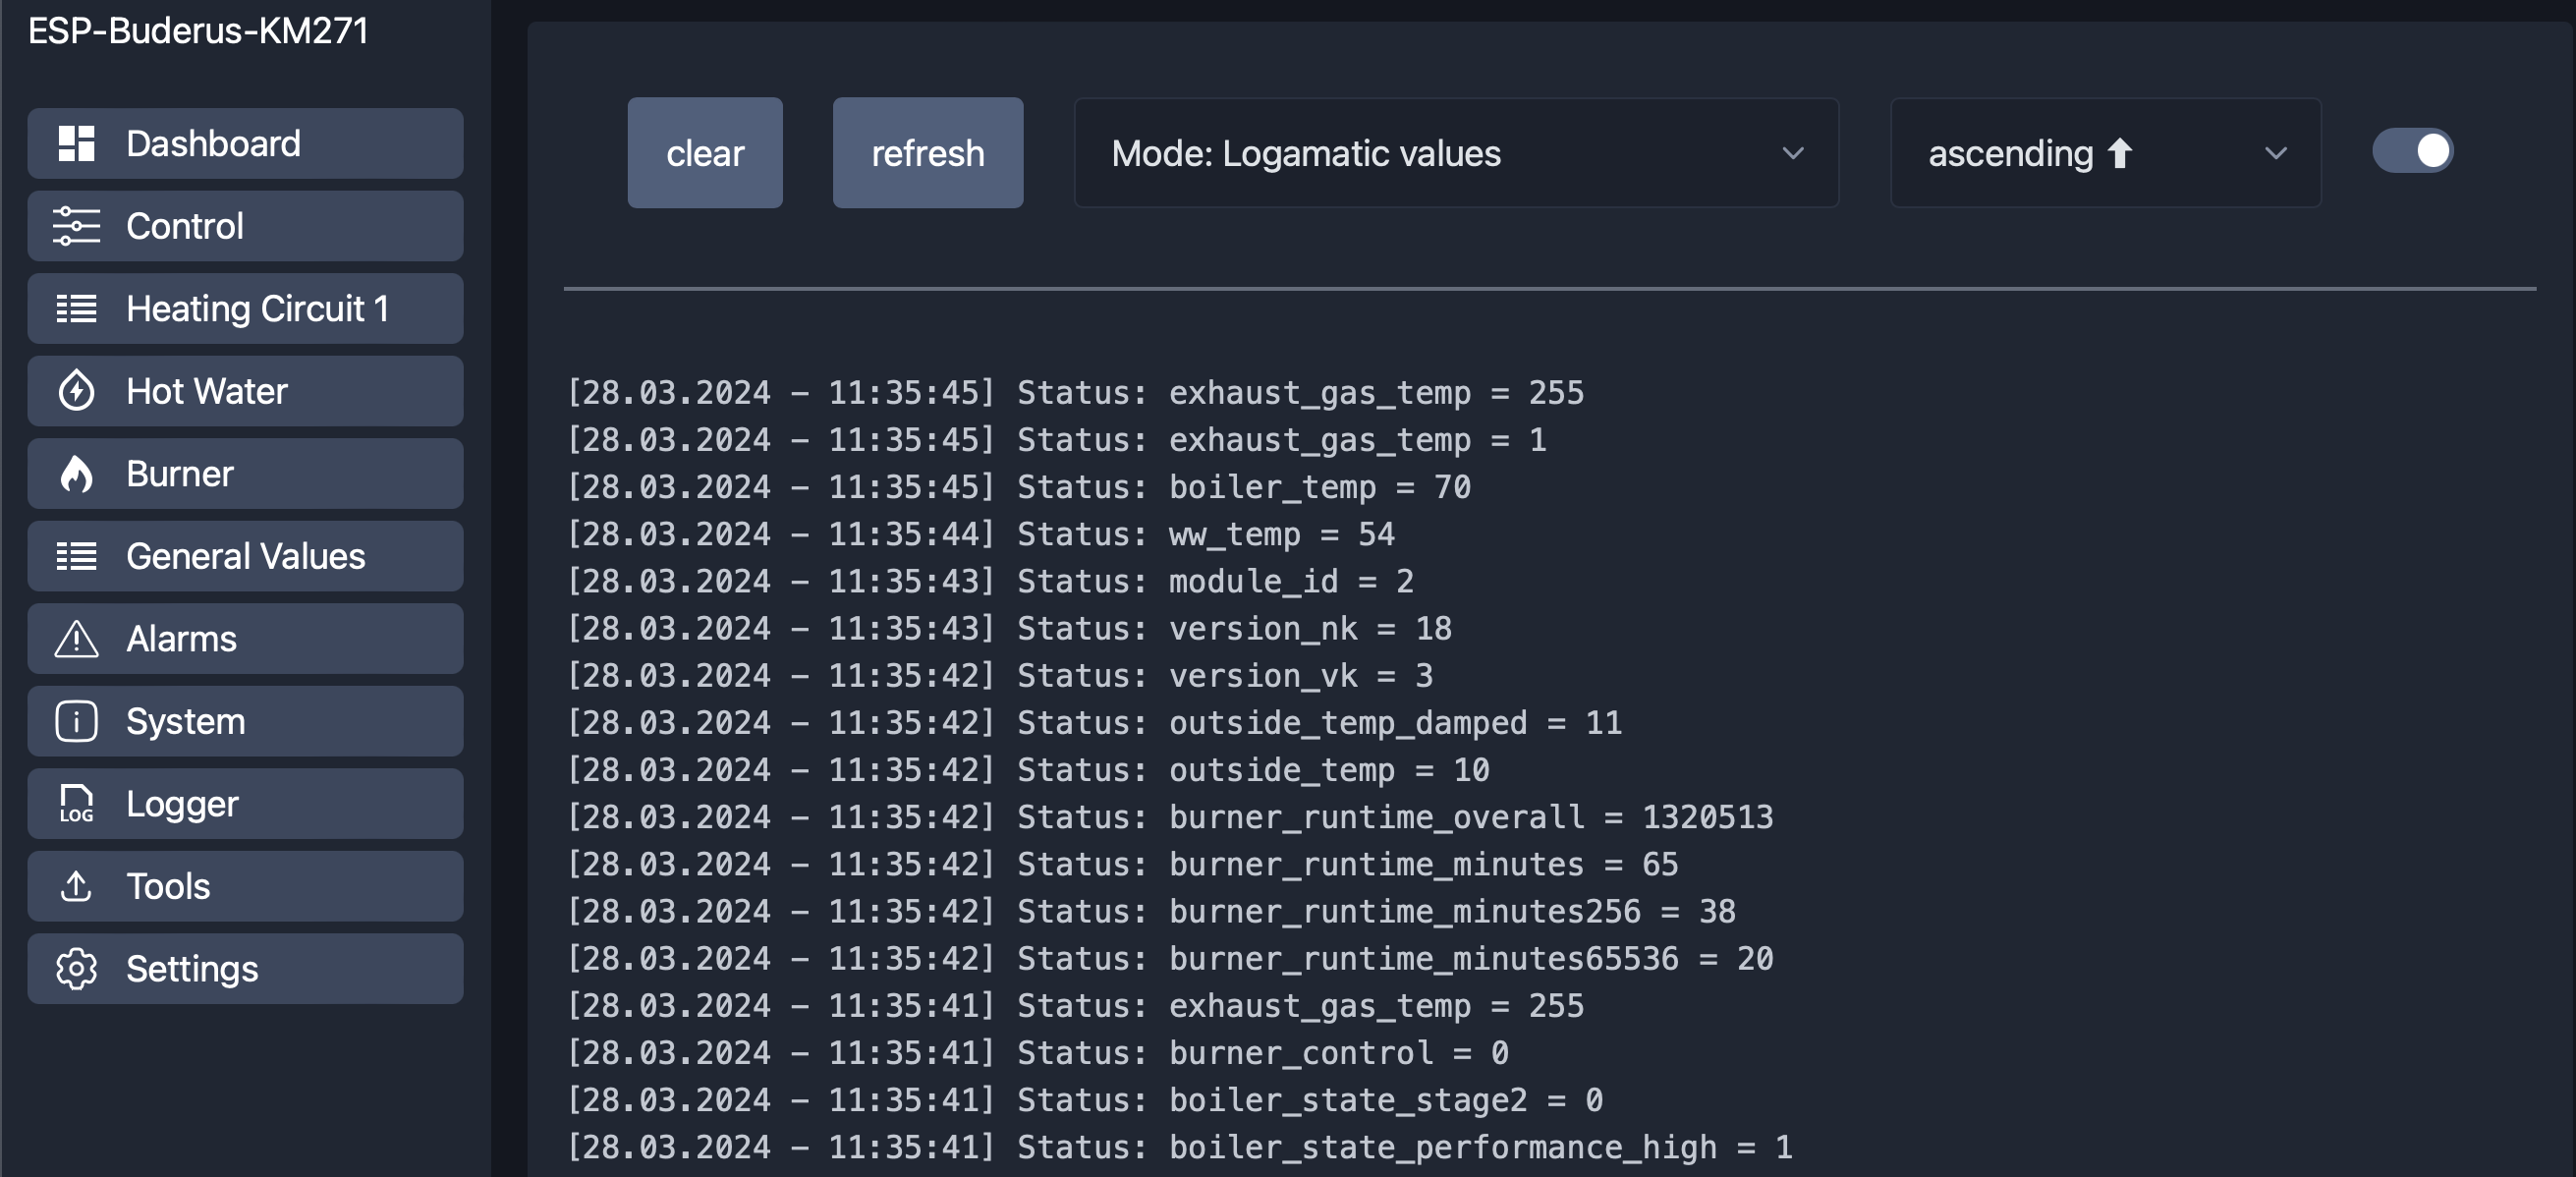
There is also a log function with which you can record various messages depending on the filter and display them via the WebUI. This can be useful for your own debugging and also for the further development of the software.
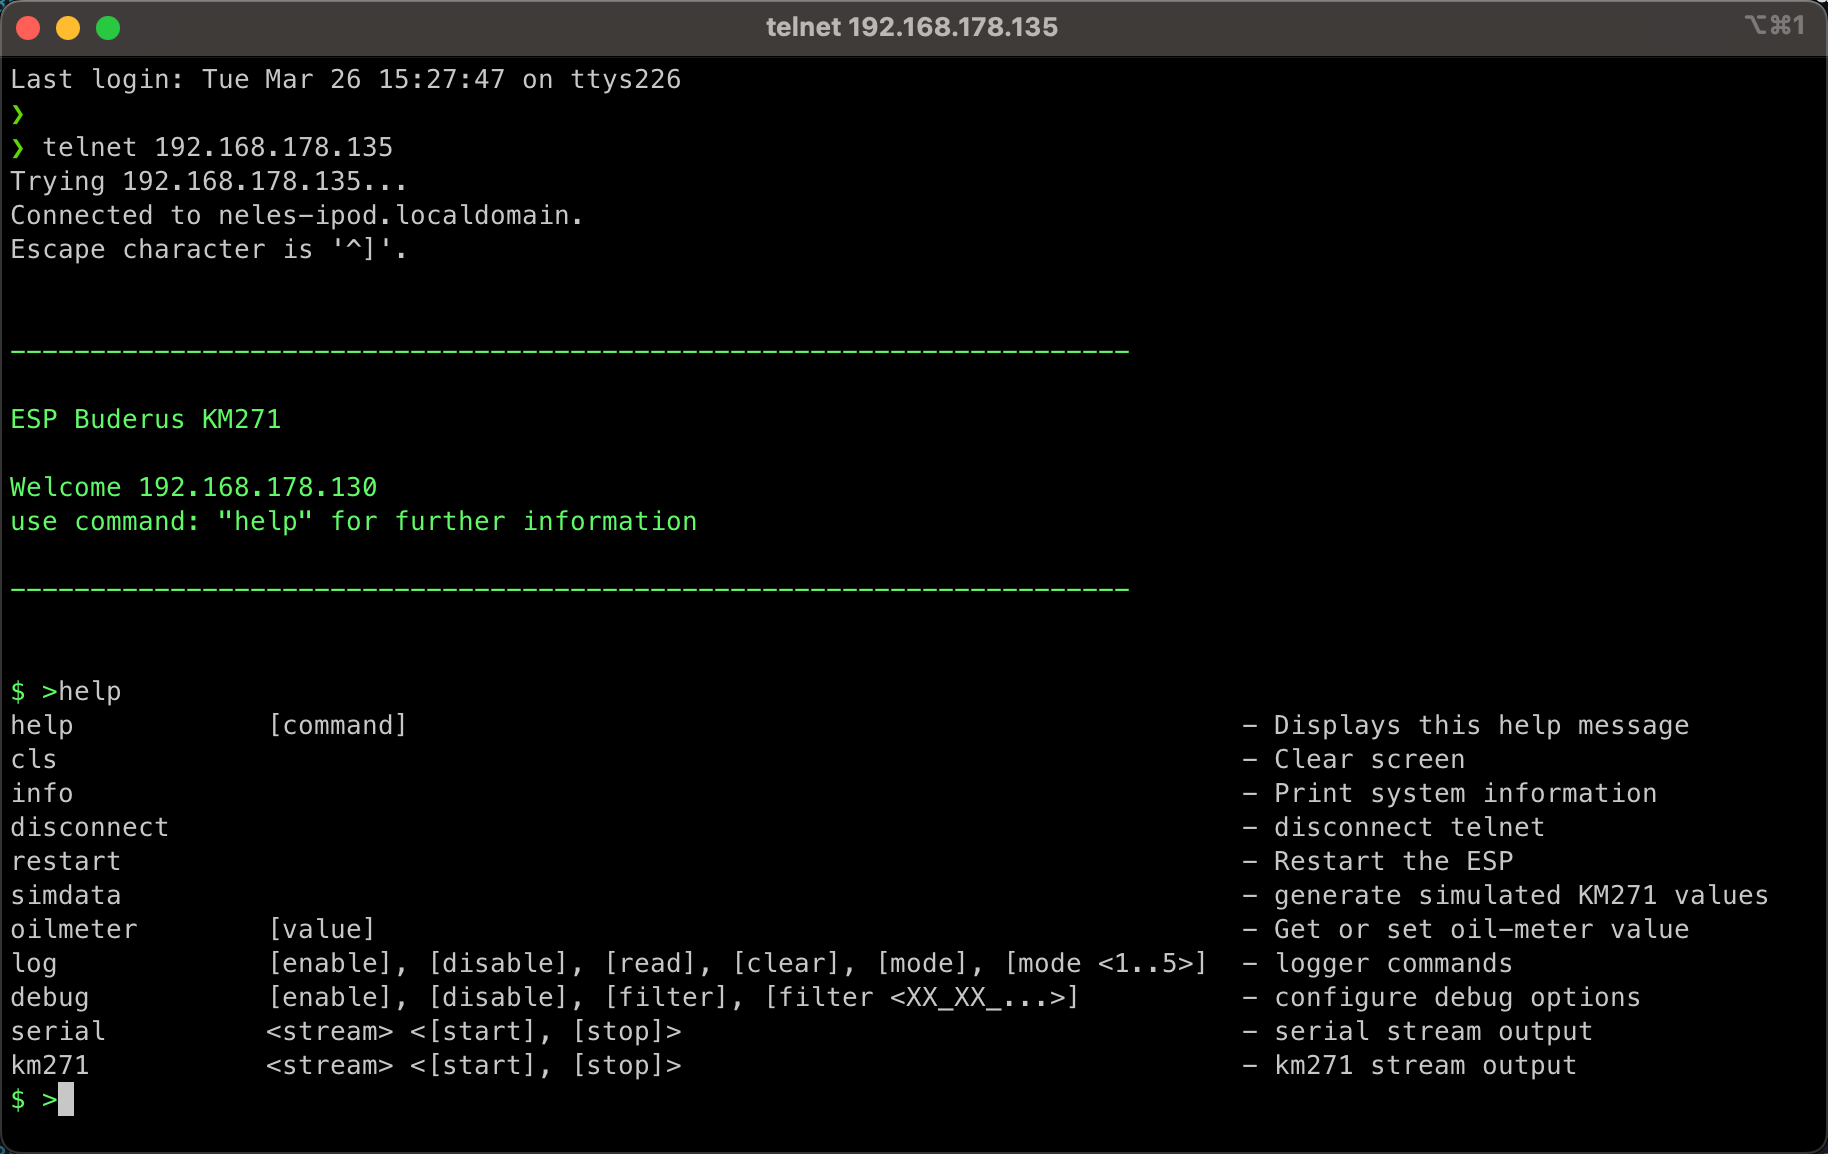
In addition to the WebUI and MQTT, there is also a Telnet interface to communicate with the ESP. The interface offers several commands to read out information and send commands. An overview of the commands can be called up using the "help" command. To connect, a simple Telnet connection can be started via the corresponding IP address of the ESP.
Example:
> telnet 192.168.178.135
I´m writing all information's that are transmitted over MQTT into a influxDB Database.
In my case I'm using node-red to receive the MQTT messages and to write it into the influxDB.
Everything runs in Docker on my Synology NAS.
But there are a lot of other possibilities - use the one that fits you best.
If you are interested in my flows, you can use this export file: node-red.json
To visualize the information's, I'm using grafana that gets the data out of the influxDB.
For me this gets me more possibilities to analyze the behavior of the heating system compared to a static dashboard.
Here are some impressions of what I did with all the information's that comes out of the Logamatic:
If you are interested my dashboard, you can use this export file: grafana.json
feel free to use and adopt to your needs!
If you have something to improve, let us all know about you ideas!
❓ If you have a question, use the Discussions => https://github.com/dewenni/ESP_Buderus_KM271/discussions
🐞 If there is a issue or bug, use the Issues => https://github.com/dewenni/ESP_Buderus_KM271/issues


