by Devin Ingersoll
This project will demonstraight how to use pyspark to perform data processing on a file in order to tell a story using the data
I am pulling in a txt file of one of my favorite books Neuromancer by William Gibson from good old archive.org (probably legal... right?). Becasue pulling this would directly from archive.org would include HTTP tags and such, I copied the text into a txt file within my repo.
- The code was written and tested using Databricks Community Edition (a free, web-based platform for working with spark in IPython type notebooks)
- To pull the data in and perform actions on it I am using a Pyspark, a python interface for Apache Spark: an analytics engine for big data processing
- First, import the data into python > databricks > spark
import urllib.request
urllib.request.urlretrieve("https://raw.githubusercontent.com/deviningers/big-data-final/main/neuro.txt" , "/tmp/neuro.txt")
dbutils.fs.mv("file:/tmp/neuro.txt", "dbfs:/data/neuro.txt")
txtRDD = sc.textFile("/data/neuro.txt", 3) # change 3 to be any number of servers with a dataset copy- Use flatmap to create a dataset of each word
wordsRDD = txtRDD.flatMap(lambda line : line.lower().strip().split(" "))- Now filter out symbols, stopwords, and names
# remove symbols with regex
textWordsRDD = wordsRDD.map(lambda w: re.sub(r'[^a-zA-Z]','',w))

# Remove all stopwords using pyspark's stopword remover function
from pyspark.ml.feature import StopWordsRemover
stopwords = StopWordsRemover().getStopWords()
cleanRDD=textWordsRDD.filter(lambda w: w not in stopwords)

# Remove names and connectors
removeWords = ['case', 'molly', 'armitage', 'maelcum', 'riviera', 'finn',
'said', '', 'like', 'youre', 'something', 'thing' , 'get', 'got', 'dont']
cleanerRDD=cleanRDD.filter(lambda w: w not in removeWords)- Map out the words into key value pairs so that the data can be further processed
IKVPairsRDD = cleanerRDD.map(lambda word: (word,1))- Now we can reduce by key to count all the times a word is used
wordCountRDD = IKVPairsRDD.reduceByKey(lambda acc, value: acc+value)- You can now collect the data using
wordCountRDD.collect()or continue manipulating the data as we do to export it to a graph
- We can export the top 20 most common words by sorting the data, cutting it, and transforming the data into a tuple so that we can export it to a graph using matplotlib.pyplot:
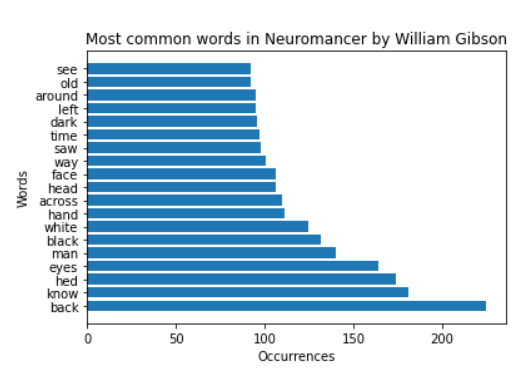
- Looking at the data we can see some commonalities such as the words
head face eyes saw seewhich is probably pretty common in books spend time describing characters more than locations. We can also see a pattern of the termblackbeing slightly more common thanwhiteanddarkbeing more much more common thanlightwhich is in the top 50. This shows that the locations and/or situations usually take a darker tone as well as being very monochromatic and ridged. This is just my interpretation of the data though. Feel free to take the code and draw your own conclusions :)!
