This website was created at the early stage when COVID19 came into Canada, 2020. Due to failure of EC2 instance, there were data loss(not collected) since 1st Jan, 2021. It archived data to the end of 2020 and will not collect new data since then. As today, there are many websites providing COVID19 data, I won't spent extra time to fix it.
- It is highly recommended to ZOOM OUT your broswer to view all data in a single page view;
- The heroku site may not be accessible because it's sleeping when it's idle, just give a second visit after 2-3 minutes and it will be awaken.
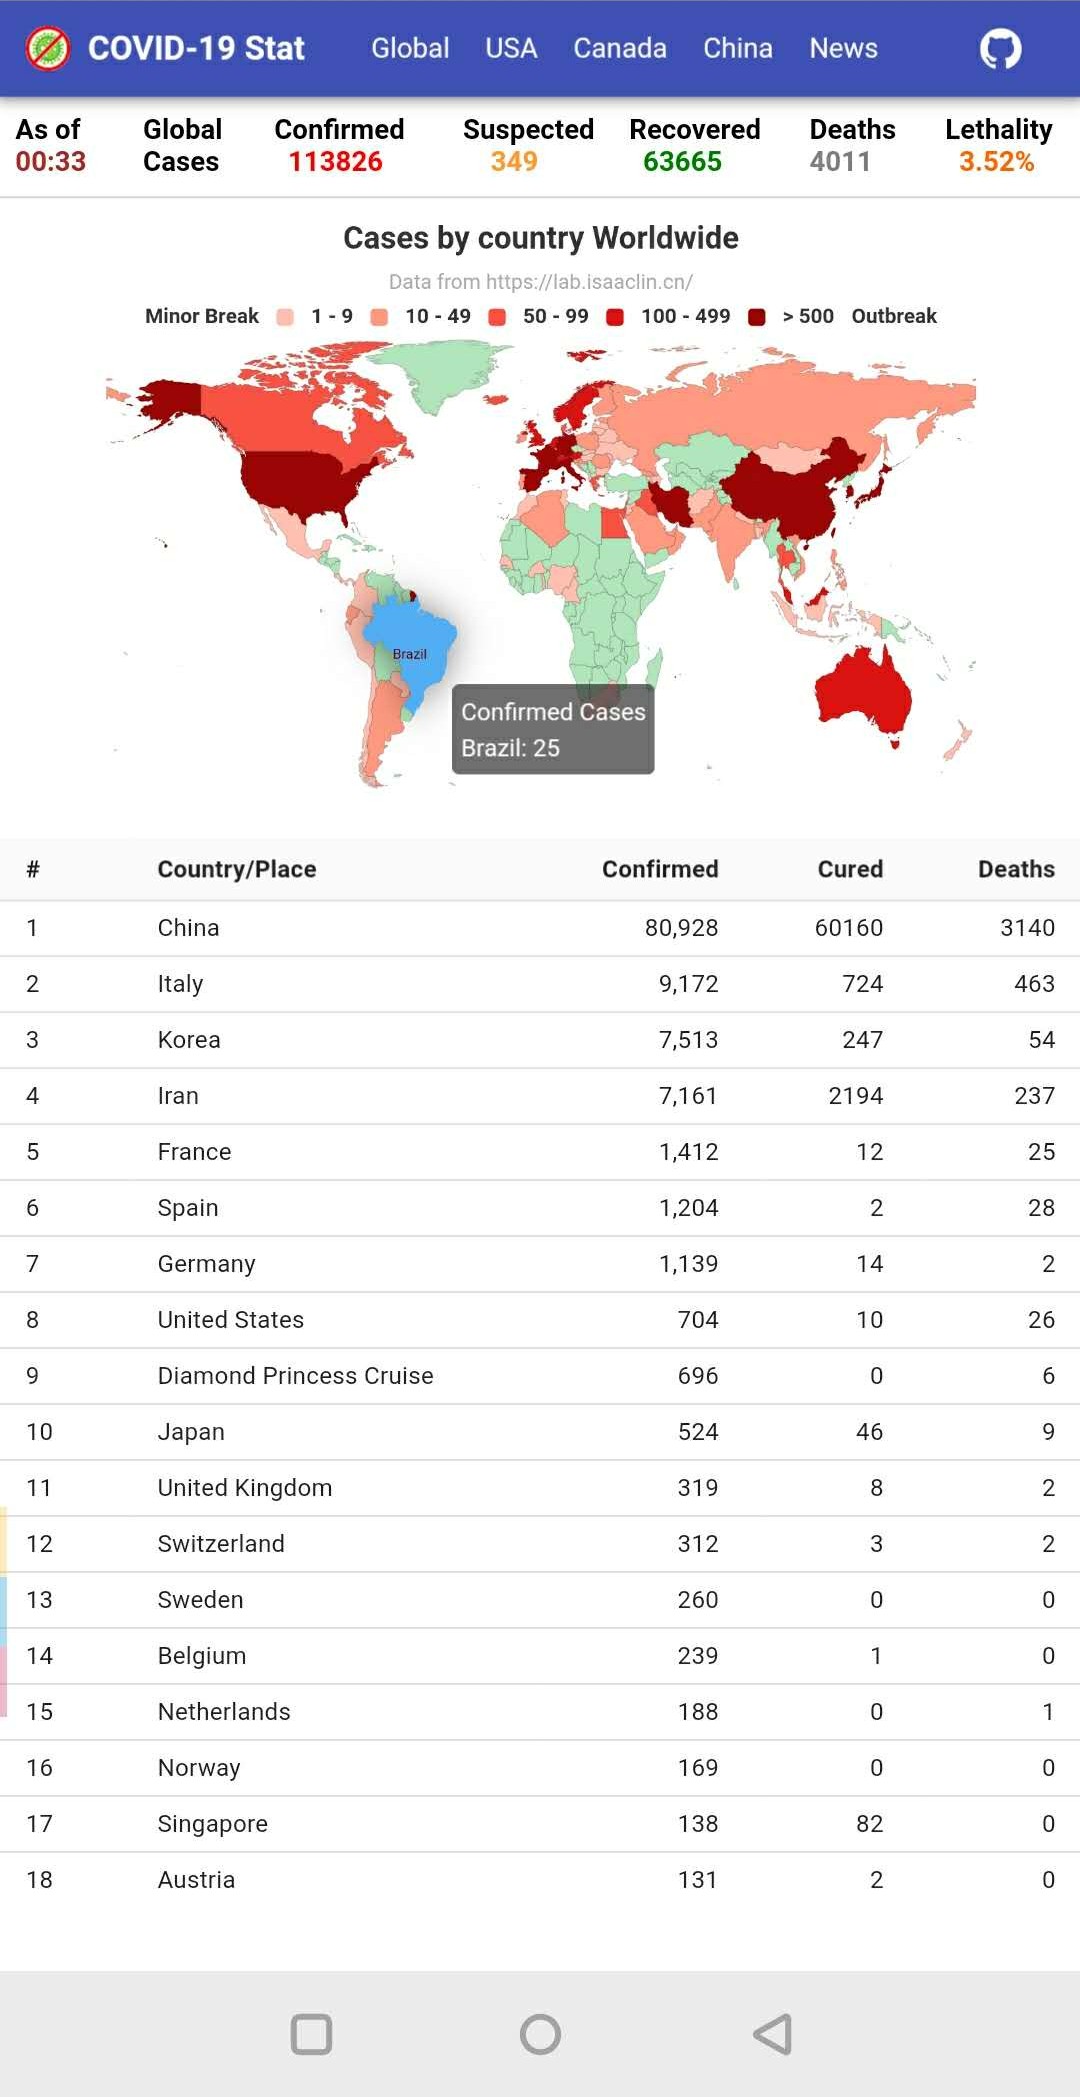
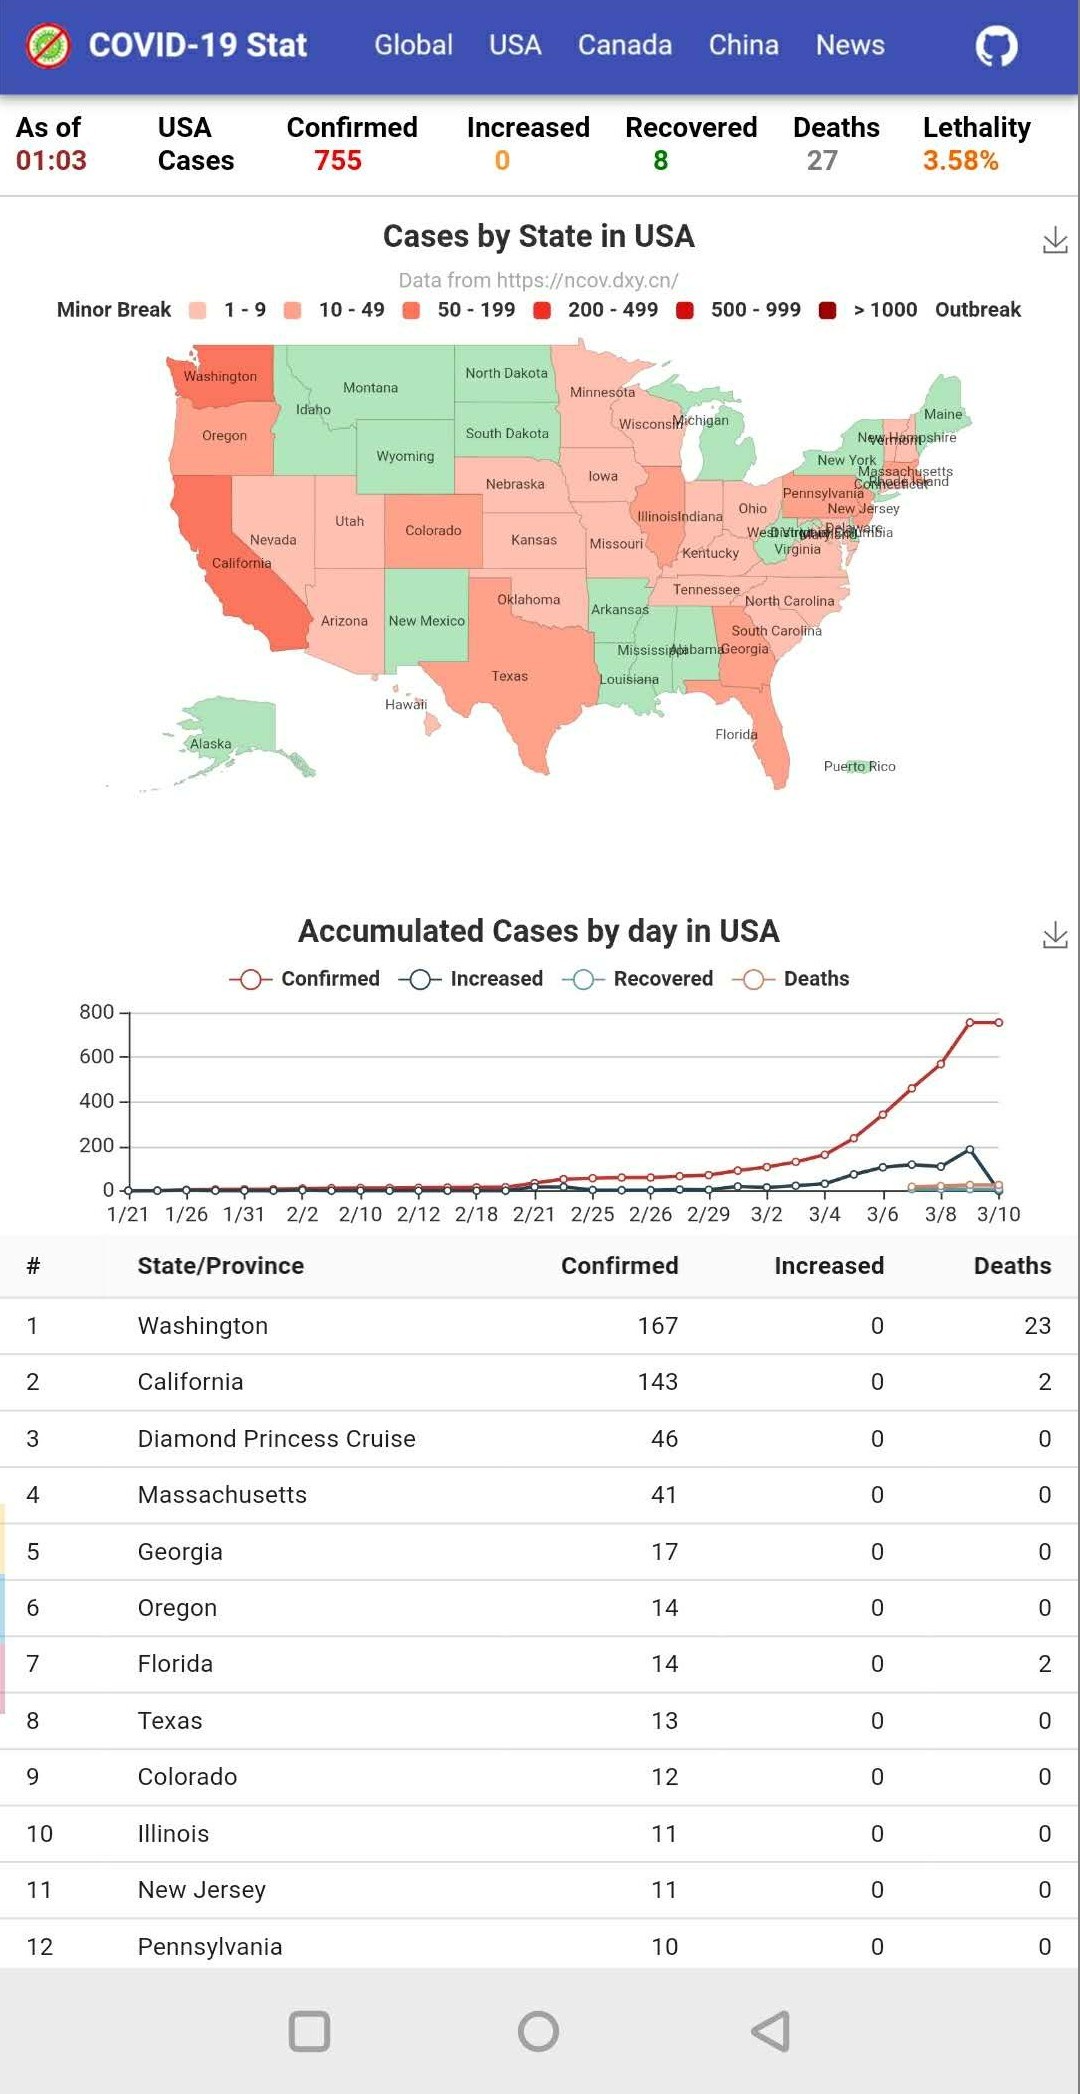
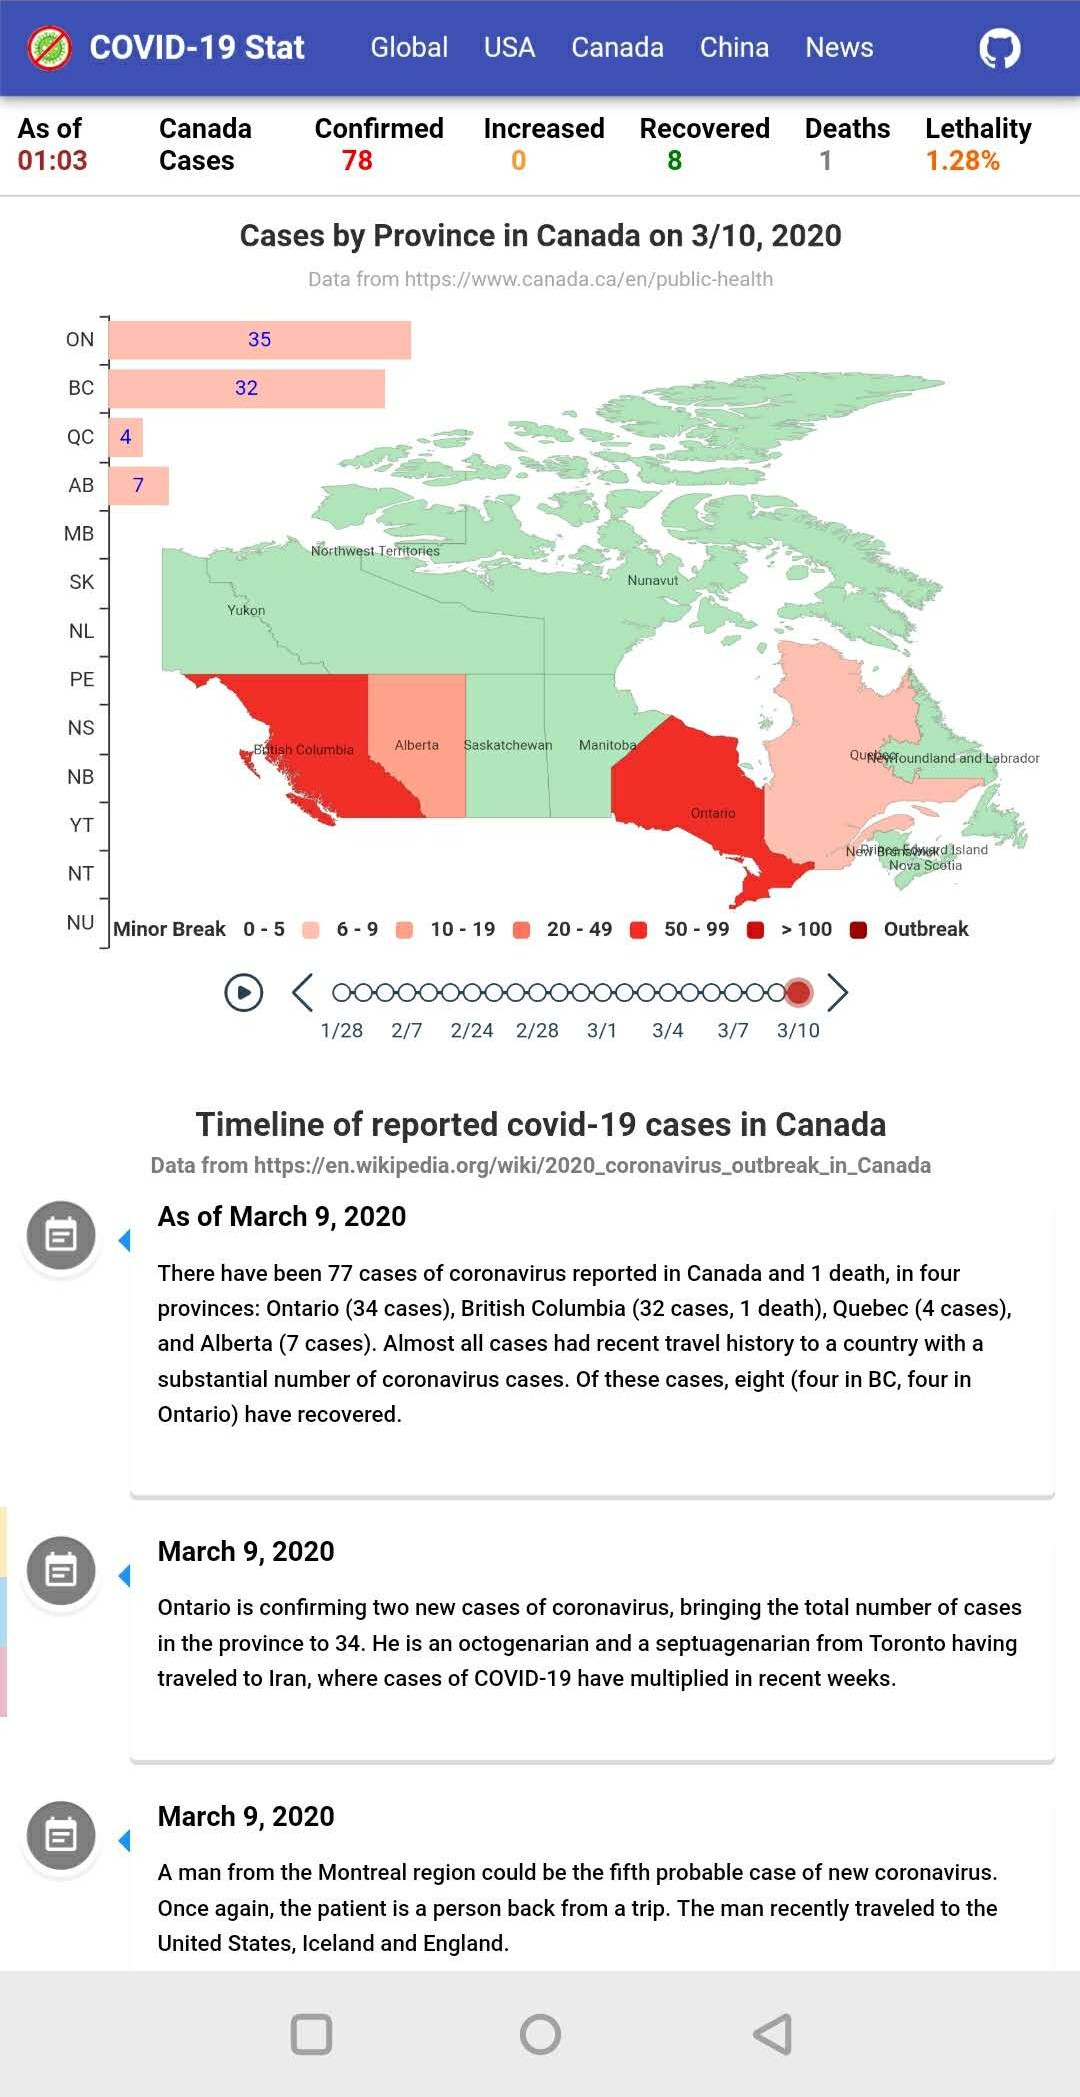
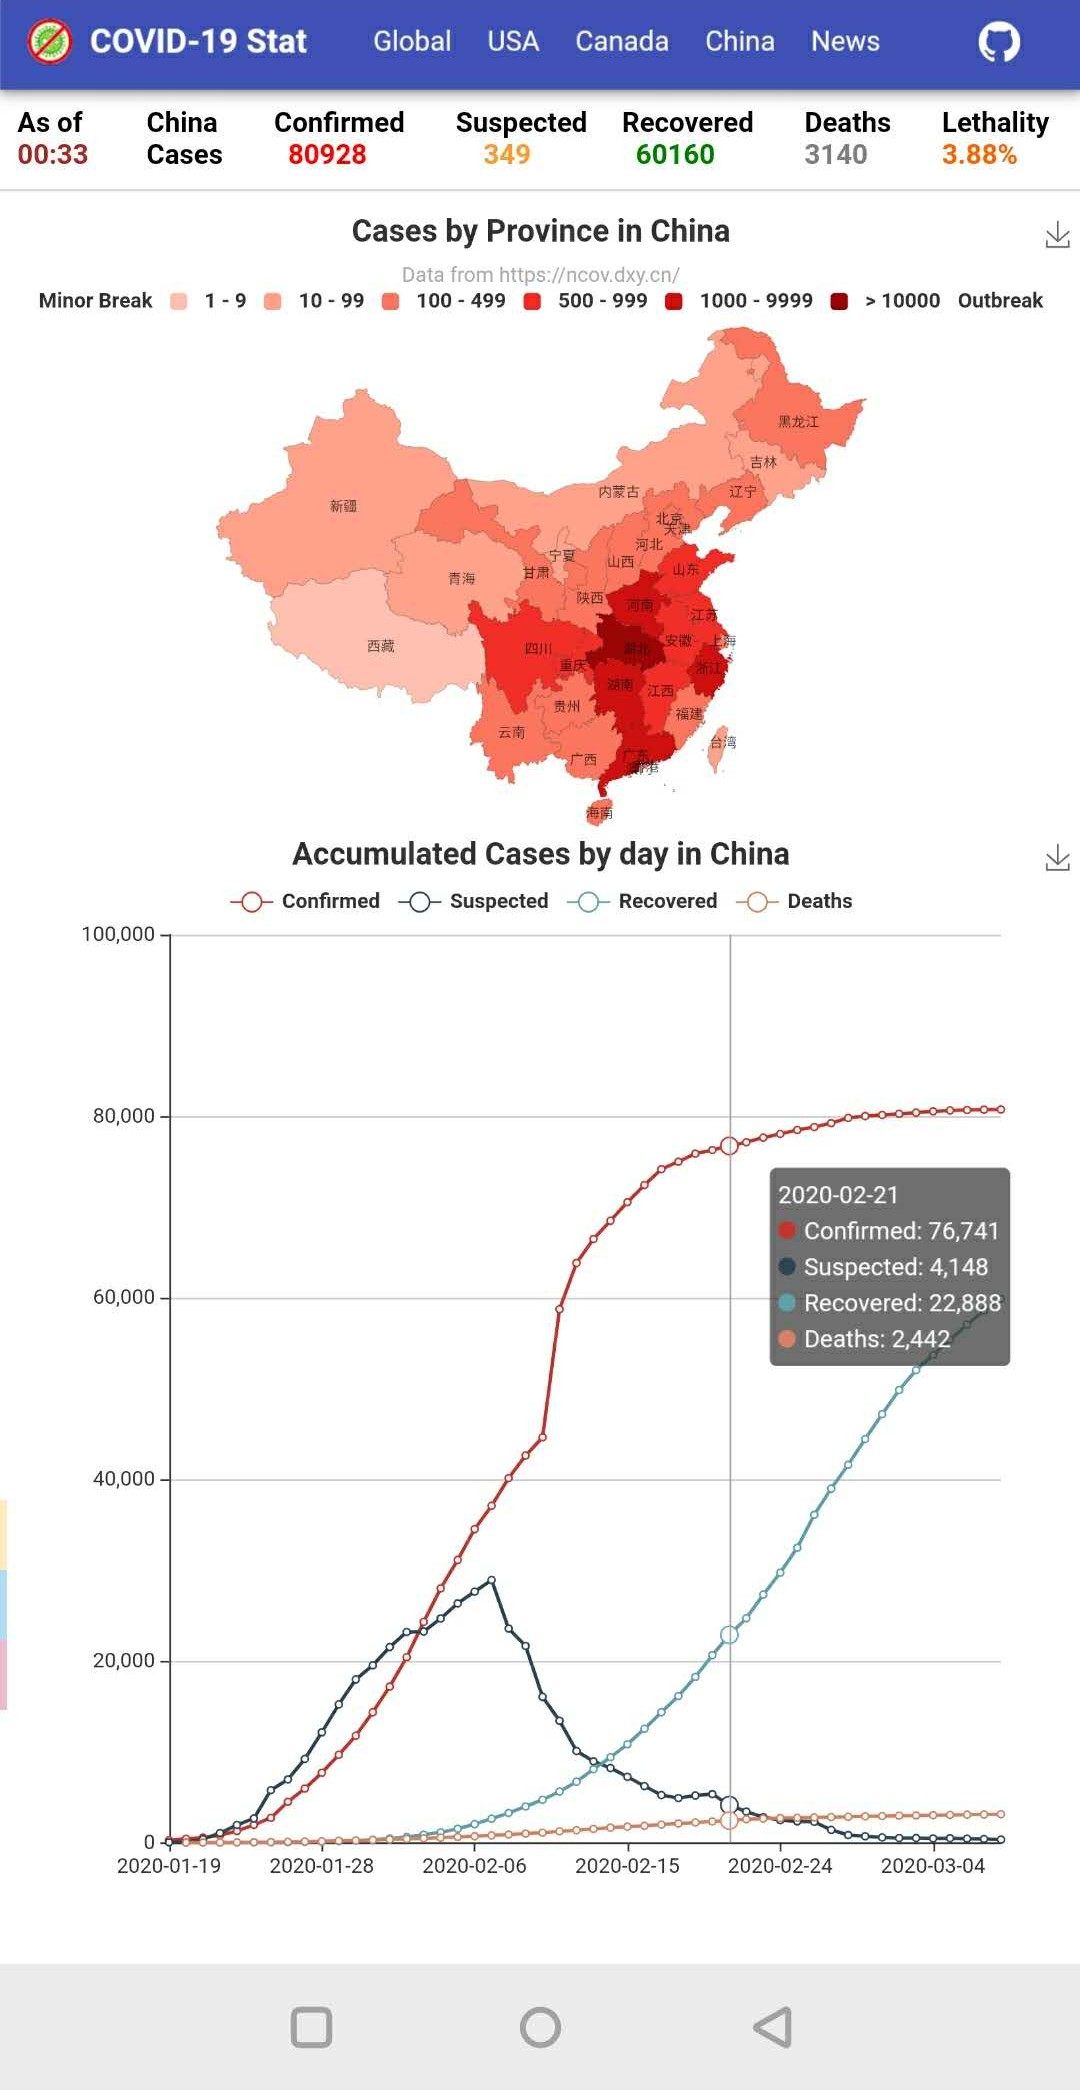
This web app uses react, material ui, echarts, and js scraper to collect and represent statistics of coronavirus in the world.
- Latest host on AWS EC2: https://covid19-stat.site/ (update every 10 minutes)
- New Hosting on AWS S3: http://covid-19-statistics.s3-website-us-west-2.amazonaws.com/ (limited update by github actions)
- Original Hosting on heroku: https://covid-19-statistics.herokuapp.com/ (limited update by github actions))
- https://en.wikipedia.org/wiki/2020_coronavirus_outbreak_in_Canada
- http://www.bccdc.ca/health-info/diseases-conditions/covid-19/data
- https://kustom.radio-canada.ca/
- https://www.worldometers.info/coronavirus/
- https://lab.isaaclin.cn/nCoV/en
- Latest cases numbers are collected/scraped periodically and written into JSON files in assets directory.
| Global Statistics | USA Statistics | Canada Statistics |
|---|---|---|
 |
 |
 |
| China Statistics | Latest News | |
|---|---|---|
 |
 |
