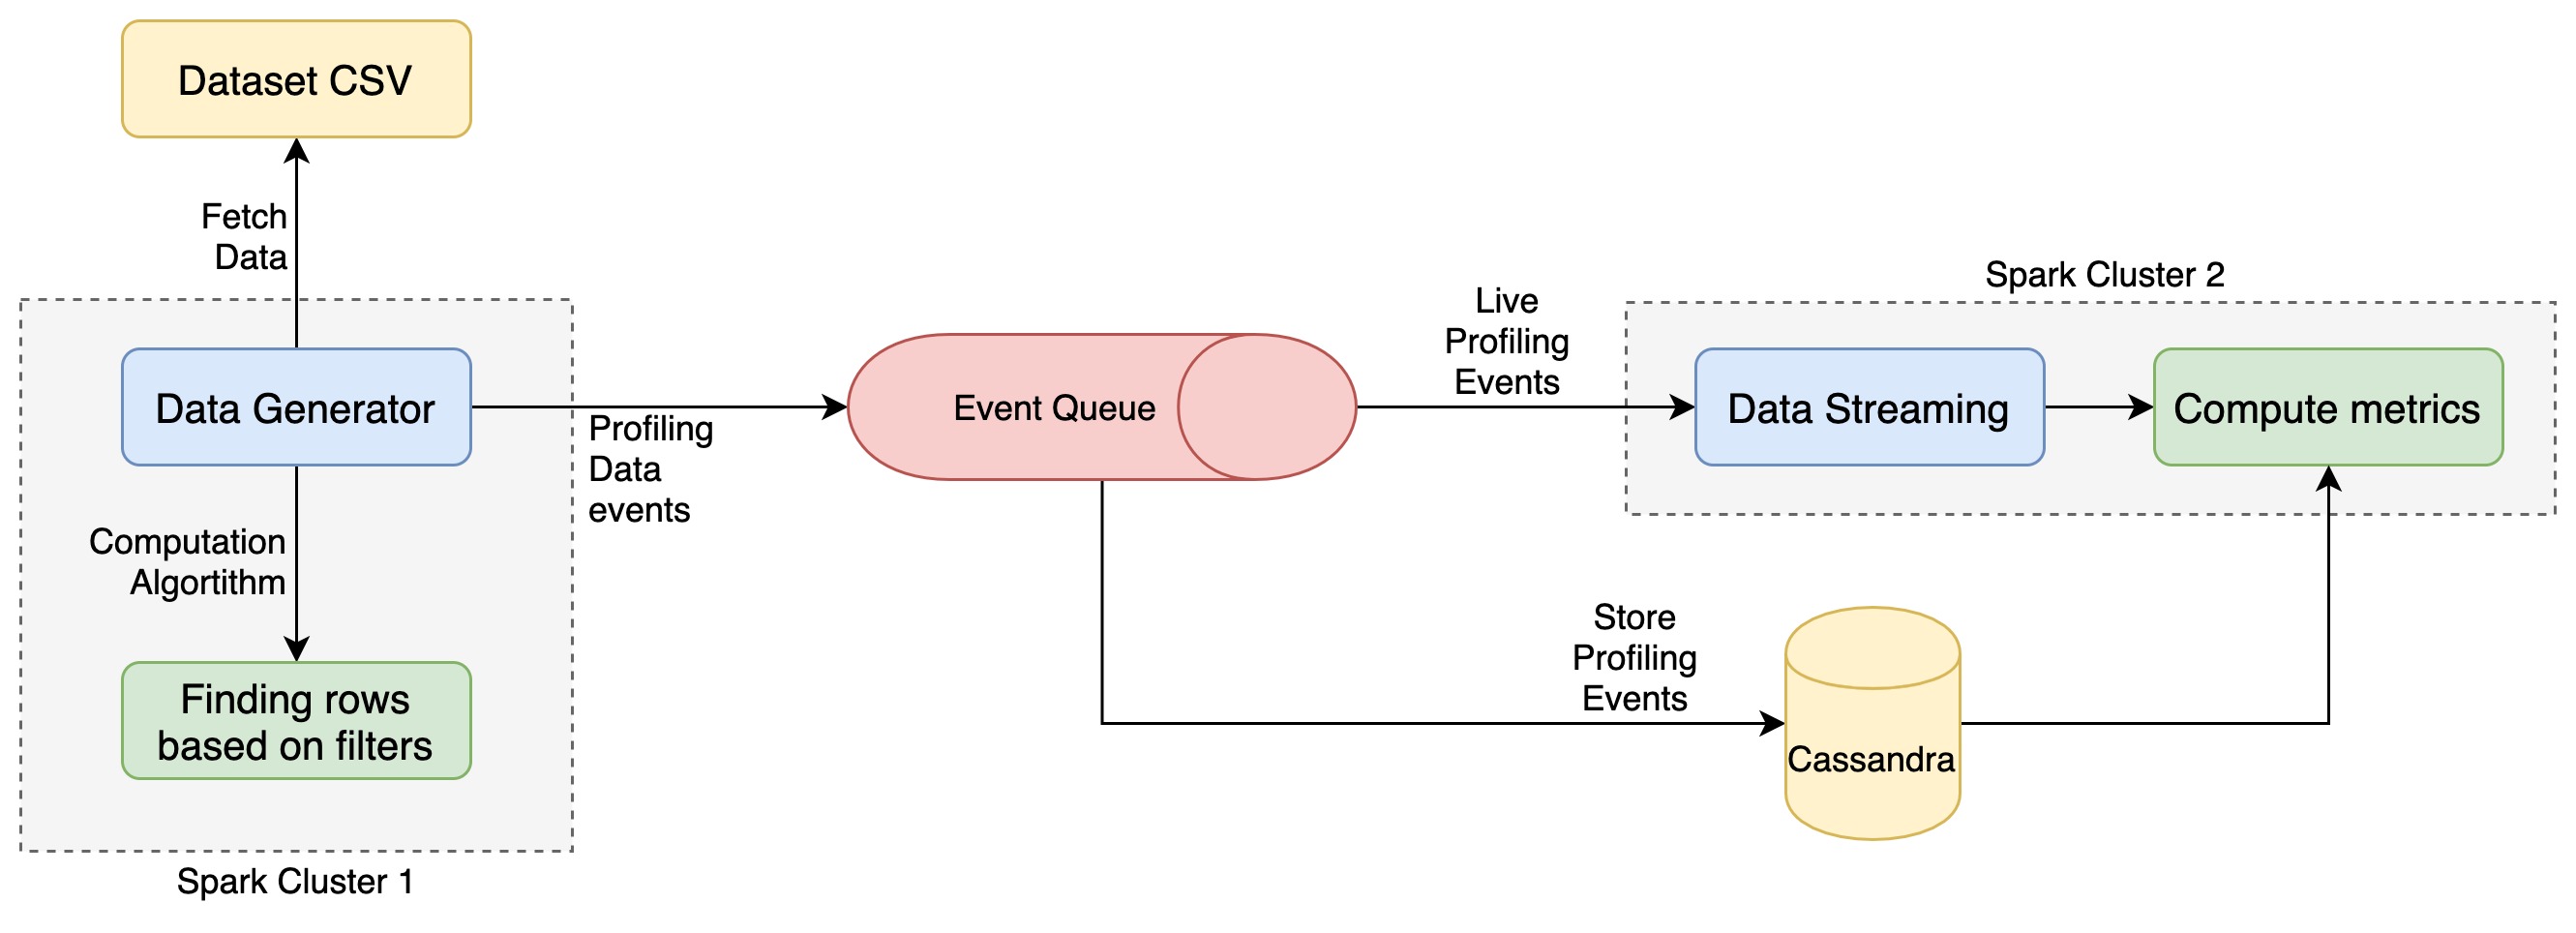
The goal of this project is to monitor the load on a Spark cluster and perform different types of profiling, and thus determining the bottlenecks and the performance of different algorithms.
The above image summarizes the architecture followed in the project. Going by details :
-
The data set from Congressional Voting Records is taken. It has a total of 17 columns for each row. Original dataset has 435 rows.
-
This data is then fed in
data_generator. The aim of this part of the project is to run random queries on outCongressional Voting Recordsdata, and fetch results. We monitor certain aspects of these results, like thestart_timefor the query,time_takento fetch the results andno_of_recordsfetched for each query, and publish an event in the RabbitMQ. -
These events published to
RabbitMQconstitute the actual data set over which our monitoring spark cluster runs. -
In the package
metrics_computer, we consume and unmarshal these events. They are used for both, batched processing and stream processing. We first store these events in aCassandradatabase, and then feed them to a spark cluster ffor live processing. -
Batch processing algorithm: We take the data from
Cassandradatabase and find themedianandstandard deviatanof thetime_takencolumn. -
Stream processing algorithm: For the stream processing,events consumed from the RabbitMQ are streamed to the second spark cluster directly via socket port
8080. A socker connection is established between the consumer and the spark in the socket_client.py file. Consumer pushes each montioring event into this socker. The streaming_processor.py consumes these events and we calculate the number of records in every 10 second window. They are printed once every 5 second. This is acheived by countByWindow function of the DStream. An exemplary sucessful metric can be found here
The project uses the following technological stack :
- Python 3.7 : We chose Python as our working language because it provides easy to use and readily available libraries for all the other dependencies, with detailed documentation.
- Docker : In order to maintain the uniformity of deployment, we use docker as deployment engine.
- Pyspark 2.4.5 : We use Apache Spark to achieve high performance for both batch and streaming data. PySpark enables us to use the Spark APIs in Python.
- RabbitMQ 3.8.3-rc.1 : We need to pass on monitoring events from one docker container to another, asynchronously. Thus, we use the event queue mechanism provided by RabbitMQ.
- Pika 1.1.0 : It provides the APIs to connect to RabbitMQ in Python.
- Cassandra 3.11.6 : We use Cassandra to store the historical data of monitoring events, which is further used for batch processing. Given the current implementation, we could have very achieved similar results with a RDBMS like PostgreSQL too.
- Python-Cassandra-Driver 3.22.0 : It enables us to use the Cassandra APIs in Python
-
To run
docker-compose up -
To run in detached mode
docker-compose up -d -
To see the logs of a specific, container, first find the container name by running
docker ps -a, then rundocker container logs <container_name>. -
To see the network details in which all the containers of this project are running, first find the network name from
docker network ls, then rundocker network inspect <network_name>. -
To clean up
docker-compose down -v --rmi all --remove-orphans. -
We can run separate container by
docker-compose up <container_name>wherecontainer_nameis one of the service names from thedocker-compose.yml. -
While the containers are running, we can monitor the queue on the dashboard http://localhost:15672/ with [Username/Password] as
[guest/guest]. -
The cassandra seed node exports port
9042for runningCQLqueries. Thus, we can connect tolocalhost:9042and run anycqlshquery, and monitor the data incassandraDB. -
Cassandra nodes can also be monitored by accessing any node using
docker exec -t <container_name> bash, and runningnodetool statuscommands. -
We have set up a
portainerinstance to be able to monitor the high level status of all the containers. We can access the Web UI for the same on http://localhost:10001/ while the portainer container is running.
