GitOps isn't mandatory to run this example. I use it to facilitate this example and the agility.
If you prefer to avoid it, you can go directly to the following point.
Install the operator:
❯ oc apply -f gitops/gitops-operator.yaml
subscription.operators.coreos.com/openshift-gitops created
Get the route:
❯ oc get route -n openshift-gitops | grep server | awk '{print $2}'
openshift-gitops-server.{your-domain}.com
Go to the route and use your own credentials.
In the ocp folder, you can find the files needed to deploy the application.
You only have to apply the ApplicationSet:
❯ oc apply -f gitops/golang-applicationset.yaml
applicationset.argoproj.io/kustomize-bootstrap created
We need grant GitOps' user roles to create a ServiceMonitor.
❯ oc policy add-role-to-user monitoring-edit system:serviceaccount:openshift-gitops:openshift-gitops-argocd-application-controller -n dev-monitoring
clusterrole.rbac.authorization.k8s.io/monitoring-edit added: "system:serviceaccount:openshift-gitops:openshift-gitops-argocd-application-controller"We are going to test our application. Firstly we will see the state in ArgoCD dashboard:
Once we are sure that the application is running, we will execute an endpoint, for example the ```greetings`` endpoint:
❯ SERVICE_ENDPOINT=$(oc get route -n dev-monitoring | grep golang | awk '{print $2}')
❯ curl $SERVICE_ENDPOINT/api/v1/greetings
{"msg":"Hello world"}
Finally, we can explore the metrics endpoint that we will use with Grafana and Prometheus in the next step:
❯ curl $SERVICE_ENDPOINT/metrics
# HELP go_gc_duration_seconds A summary of the pause duration of garbage collection cycles.
# TYPE go_gc_duration_seconds summary
go_gc_duration_seconds{quantile="0"} 0
go_gc_duration_seconds{quantile="0.25"} 0
go_gc_duration_seconds{quantile="0.5"} 0
go_gc_duration_seconds{quantile="0.75"} 0
go_gc_duration_seconds{quantile="1"} 0
go_gc_duration_seconds_sum 0
go_gc_duration_seconds_count 0
NOTE: It's an application's responsibility to expose the
/metricsendpoint, like Prometheus format awaits.
The OpenShift monitoring architecture is the following:
By default, the OpenShift installation process installs and configures all the pieces. We can override or customize most parameters.
The main components that we are going to explore are Grafana and Prometheus
Prometheus has the responsibility to get the information about the metrics along the pods.
By default, Prometheus calls the /metrics endpoint, finding for a specific format. Most language programming has the corresponding library to expose these metrics.
At the installation step, we grant privileges to the GitOps user. The reason was that we need to create an ServiceMonitor object to indicate to Openshift that this service has to be monitored. The definition of this object is:
apiVersion: monitoring.coreos.com/v1
kind: ServiceMonitor
metadata:
  labels:
    k8s-app: golang-helloworld
  name: golang-helloworld
spec:
  endpoints:
  - interval: 30s
    port: web
    scheme: http
  selector:
    matchLabels:
      app: golang-helloworld
OpenShift integrates the full monitoring stack in its console. We will find our application metrics in Console > Observe > Metrics.
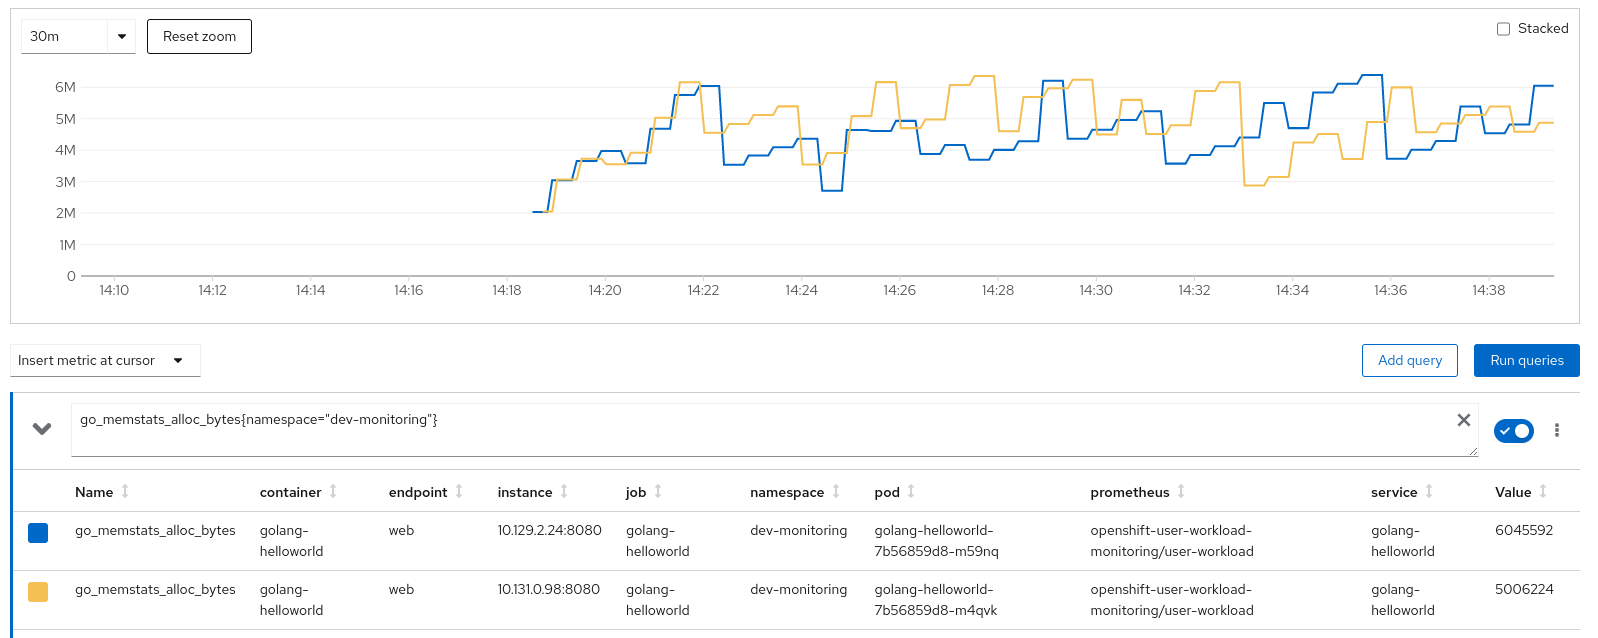
We will test our application metrics system, by asking for the memory usage with the following query:
go_memstats_alloc_bytes{namespace="dev-monitoring"}
The result:
As query monitoring parameter data one-to-one is not a trivial task, we need one way to visualize our data.
A dashboard is a group of graphs and queries that show us a piece of important information about our system.
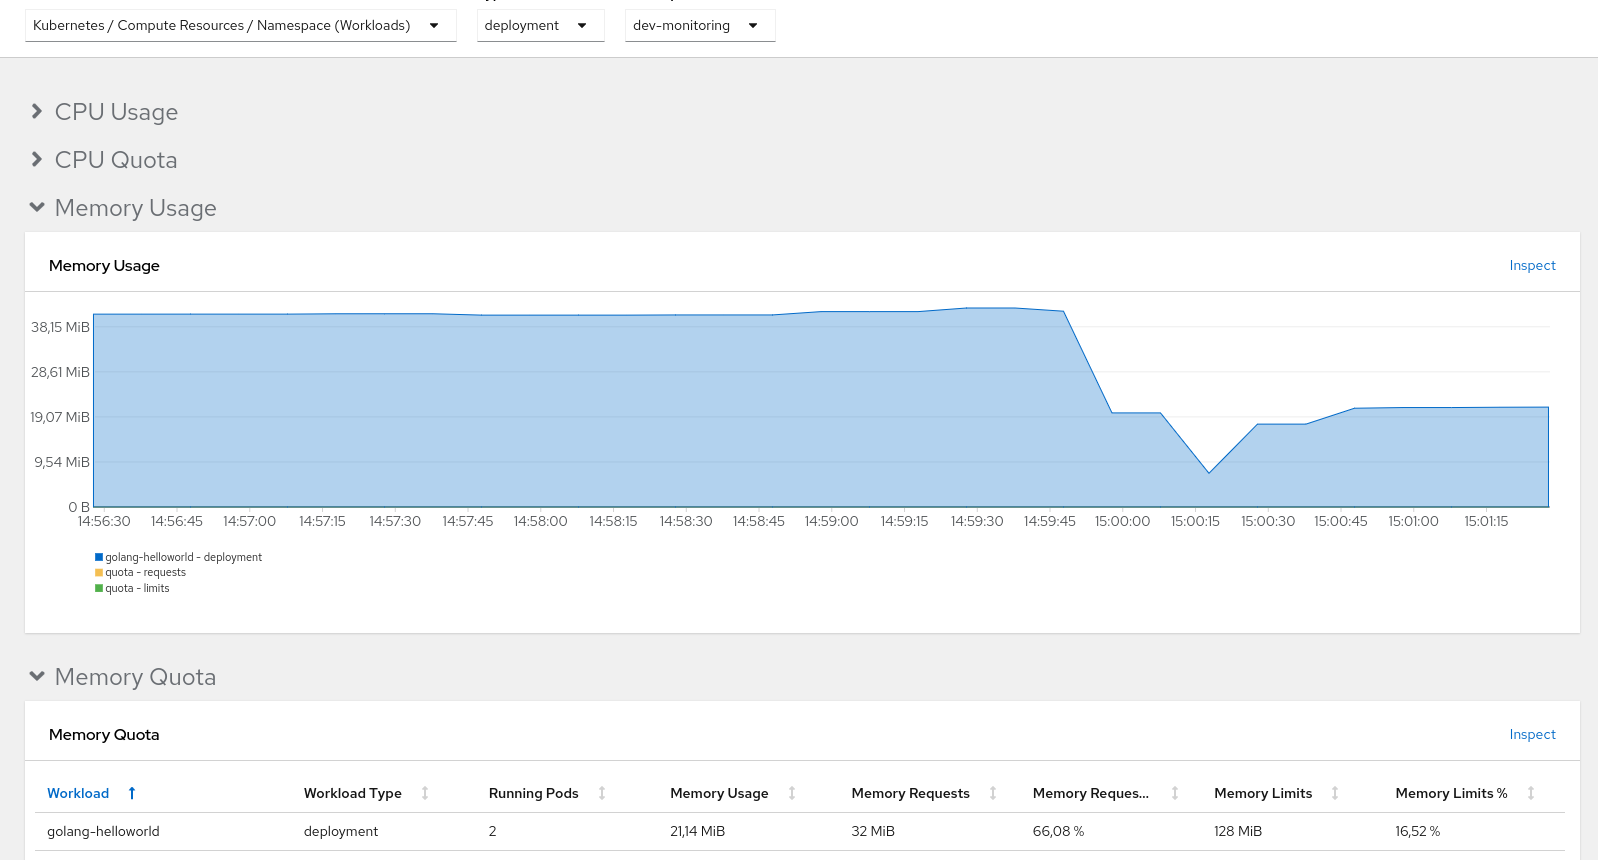
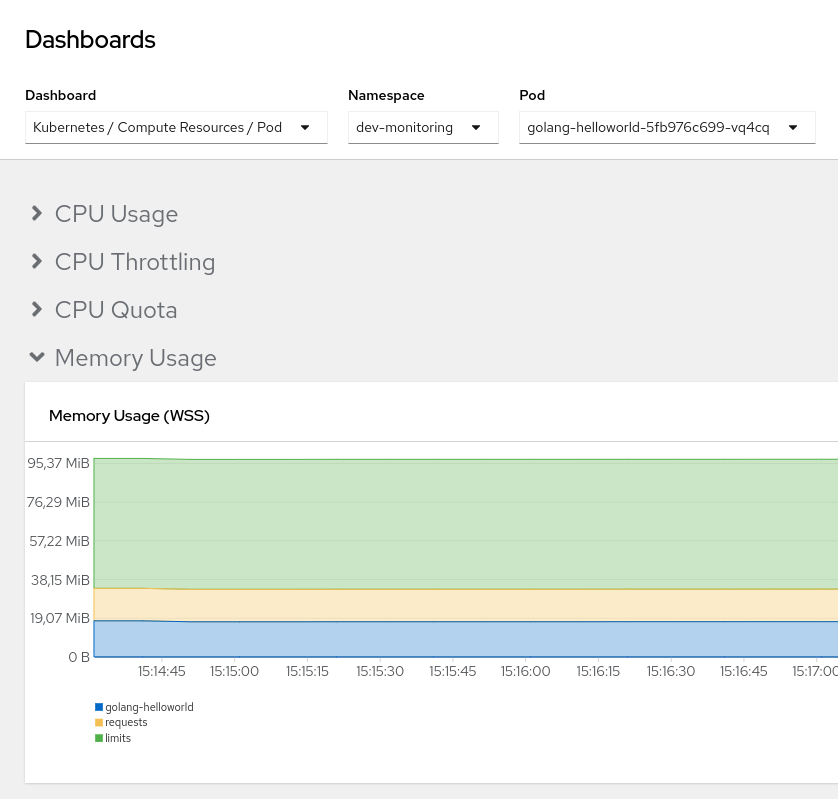
By default, OpenShift offers a set of them, but you can implement as much as you need. To navigate to the dashboard tab: Console > Observe > Dashboards
We can explore all the dashboards, for example, focusing on a terminated pod:


