The observability is composed of the following topics:
- Monitoring: is the capacity to know how many resources are consuming the applications, response times, etc.
- Logging: We need to know what is happening in our applications. It's essential to have the capacity to visualize it as functional pieces, as they could be distributed between many applications or application instances.
- Traceability: is the ability to follow a request and know the different services by which it enters in order. Additionally, some util information could be saved as response time per service, logging, etc.
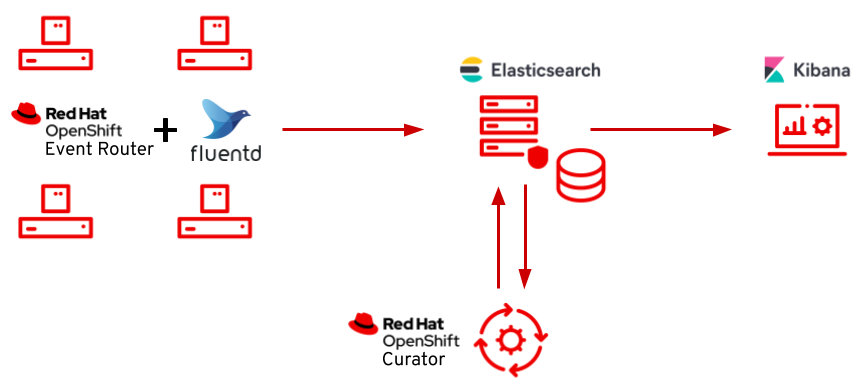
In this repository, we will see how to configure the OpenShift logging stack which is composite for the following Open Source tools:
Firstly, apply the "OpenShift Elasticsearch Operator". The operator installs Elasticseach, which is the database that store the application logs.
It's essential to select a stable channel, in this case, I've chosen the stable-5.7 channel.
oc apply -f operators/elasticsearch.yamlOnce the operator has been installed, you have to label the namespace with openshift.io/cluster-monitoring: "true" to ensure that the namespace will be monitored.
oc label namespace openshift-operators-redhat openshift.io/cluster-monitoring="true"This operator picks up the logs from every pod standard output. Fluentd gets pod logs and sends them wherever we want, by default to Elasticsearch.
Also, you can do some important actions like log forwarding, reformat the structure, etc.
The process to install the "Red Hat OpenShift Logging Operator" is the same as the previous operator.
We will choose the stable-5.7 channel too.
oc apply -f operators/cluster-logging.yamlAnd now, for the same reason, we're going to label the namespace.
oc label namespace openshift-operators-redhat openshift.io/cluster-monitoring="true"An operator is an application that has a controller that checks the state of our CRD to ensure the state of our applications.
We have to create a ClusterLogging instance with the definition of the different pieces:
kind: ClusterLogging
apiVersion: logging.openshift.io/v1
metadata:
  name: instance
  namespace: openshift-logging
spec:
  collection:
    logs:
      type: "fluentd"
  logStore:
    elasticsearch:
      nodeCount: 3
      redundancyPolicy: SingleRedundancy
      resources:
        requests:
          memory: 2Gi
      storage:
        size: 200G
    retentionPolicy:
      application:
        maxAge: 1d
      infra:
        maxAge: 1d
      audit:
        maxAge: 1d
    type: elasticsearch
  managementState: Managed
  visualization:
    type: kibana
    kibana:
      replicas: 1
The previous file shows a basic configuration with the Fluentd, Elasticsearch and Kibana configurations, but you will be able to change some parameters like retention, resources, etc.
We apply it:
oc apply -f cl-instance.yaml -n openshift-loggingAlso, the operator creates some deployments:
oc get deployment -n openshift-logging
NAME                           READY   UP-TO-DATE   AVAILABLE   AGE
cluster-logging-operator       1/1     1            1           16h
elasticsearch-cdm-s9t8jos8-1   1/1     1            1           16h
elasticsearch-cdm-s9t8jos8-2   1/1     1            1           16h
elasticsearch-cdm-s9t8jos8-3   1/1     1            1           16h
kibana 1/1 1 1 16hAfter the operator is configured, we can visualize the different logs in Kibana.
The following command gets the Kibana URL:
oc get route -A | grep kibana | awk '{print $3}' Now, we can put it on our favorite web browser and log in with our OpenShift credentials.
At this point, you will visualize all the logs that the different pods on namespaces labeled with openshift.io/cluster-monitoring="true"
We'll use a demo application that represents a user entity. This application can do all the CRUD operations and save them into a MariaDB database.
The use of this application is simple and we can use it to visualize some different logs.
We need a namespace to deploy the application, this dependencies and visualize the application logs.
We'll deploy all on a namespace called demo. So to create it, we'll use the OpenShift concept of "project":
oc new-project demoAs we have seen in a previous section, we need to label the namespace:
oc label namespace demo openshift.io/cluster-monitoring="true"Once, we have a namespace labeled, we can deploy our application. It needs a database so we'll start deploying it.
To deploy a MariaDB instance we have some possibilities. In this case, I have chosen Helm to deploy the ConfigMap, Deployment, PersistentVolumeClaim, Secret and the Service.
We can modify the default values into de users.values.yaml file.
In short, we'll deploy the database:
helm template -f mariadb/users.values.yaml mariadb | oc apply -f -With the database running, we are going to deploy the application.
The process to deploy the application is very similar to the database. I also used Helm to deploy it:
helm template -f ms-users/gitops/dev.values.yaml ms-users/gitops | oc apply -f -At this point, we can query the application endpoint.
As I've described in this documentation, Kibana shows the application logs.
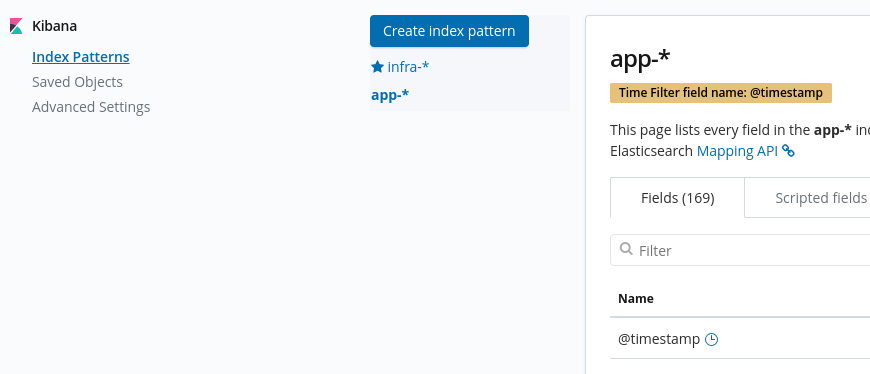
Kibana has a lot of functionalities. In this example, we just query the logs database. So, the first step is to create an index:
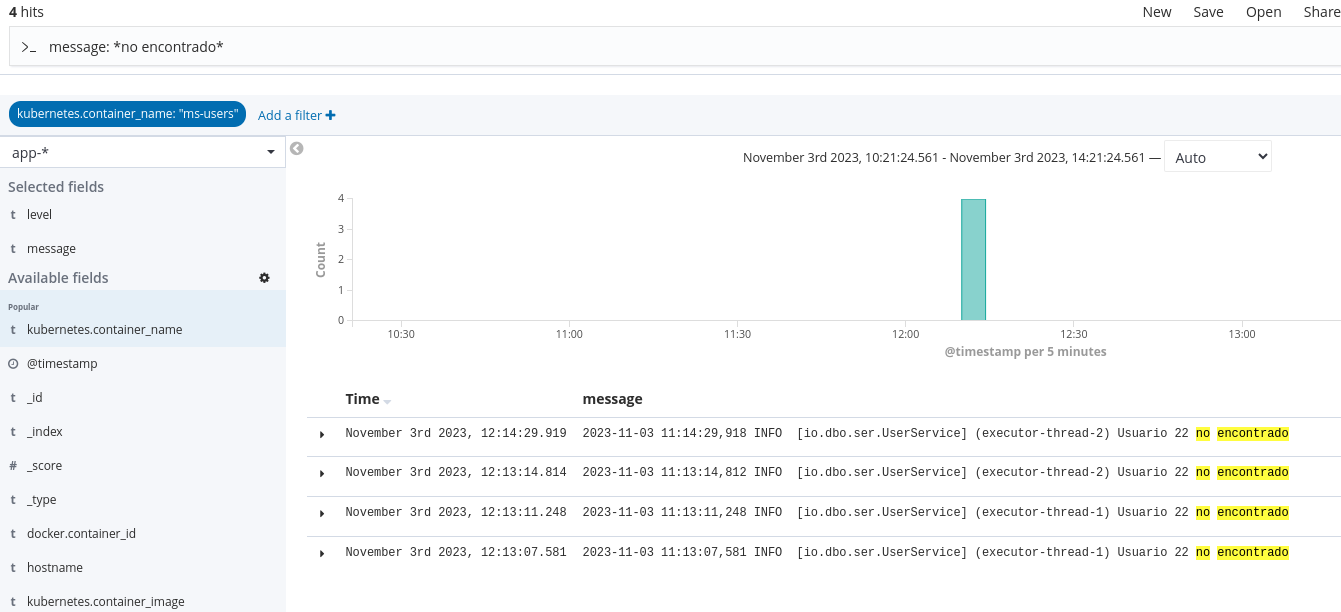
To query the application logs, we have a lot of possibilities. In this example, we're creating a query to consult the specific text:


