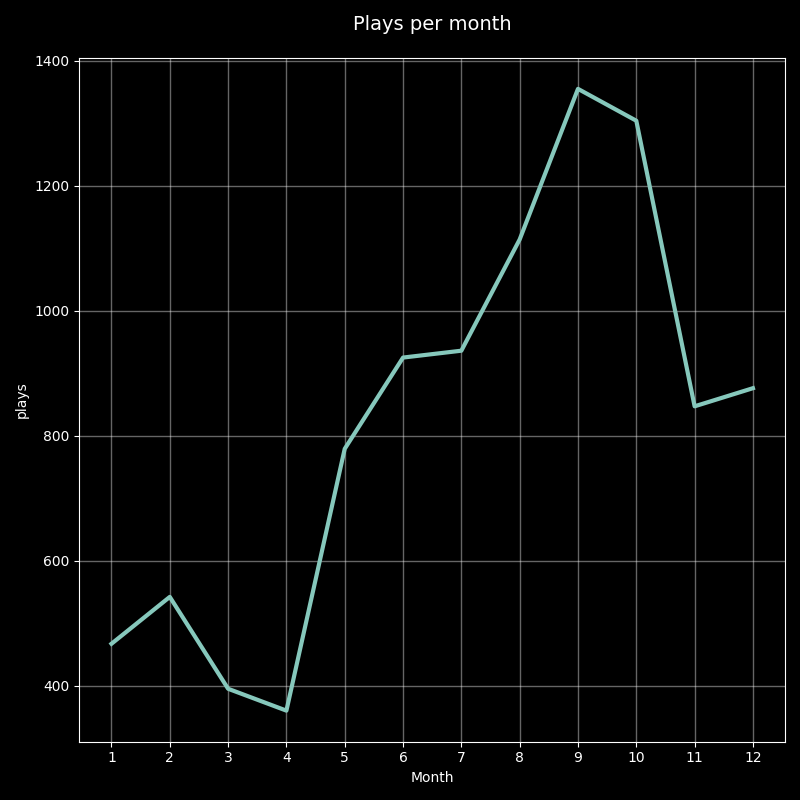
Create three charts to visualize playbacks by day of the week, hour, and month, one card as image with the top songs listented to. Plus, get some simple counts like total play time in days, hours, and minutes, total playbacks, skipped songs, and the number of different artists and songs you've listened to. Optionally you can generate a video.
Updated: December 30th 2022
- In the desktop app, go to the dropdown menu where your profile picture is and select the Account option.
- In the left-hand menu, choose Privacy settings.
- In the Download your data section, pick the Account data option.
- Click on Request data.
- In 5-10 days, they'll send the data to your email (the one linked to your Spotify account).
- Click the "Download" button. A
.zipfile will be downloaded. - Unzip the file and you'll get a folder called my_spotify_data with your data inside.
Requirements
Download the repository
git clone https://github.com/dbetm/spotify-wrapy.gitMove to the repo folder
cd spotify-wrapyCreate virtual environment
virtualenv .venv --python=python3.8Activate virtual environment
source .venv/bin/activateNote: On Windows, running this command might be a bit different.
Install required Python libraries
make installNote: If the previous command gives an error, you can try running:
source .venv/bin/activatepip install -r requirements.txt
- In the folder with your data, look for the files named something like
StreamingHistory.json. It could be only one, example:StreamingHistory0.json. - Copy those files and paste them into the
spotify_data/folder inside the repository. - Activate the virtual environment, if you haven't done so already.
source .venv/bin/activate- In the command line, run:
python3 app.pyIt also supports Spanish language: python3 app.py --lang spanish. If this argument is not passed, it will default to English.
Alternatively, you can pass a start and end date to limit the data used, for example:
python3 app.py --lang english --start-date 2022-01-13 --end-date 2023-01-01And you can generate a video, passing the video flag:
python3 app.py --lang english --video- The results will be saved in a folder (named according to the datetime of execution) inside the output folder.
Important note: The timestamp provided by Spotify uses UTC time. By default, this project calculates the timezone of the computer it's run on; you can use a different timezone by running:
python3 app.py --tz America/New_YorkYou can find the list of timezones at Wikipedia.
This is a non-profit project, made just for fun :) It is not associated with Spotify in any official way.
There are some possible improvements, including generating more charts or with customizable styles. Feel free to contribute:
- Fork the repository.
- Create a new branch from the
mainbranch. - Push your branch and open a Pull Request targeting this repository.
