To check the resources in the app repository, please go here
- Overall Environment Design
- Everything as Code
- Development Workflow
- The Pipeline
- Observability
- Trade-offs and risks
- Showcase
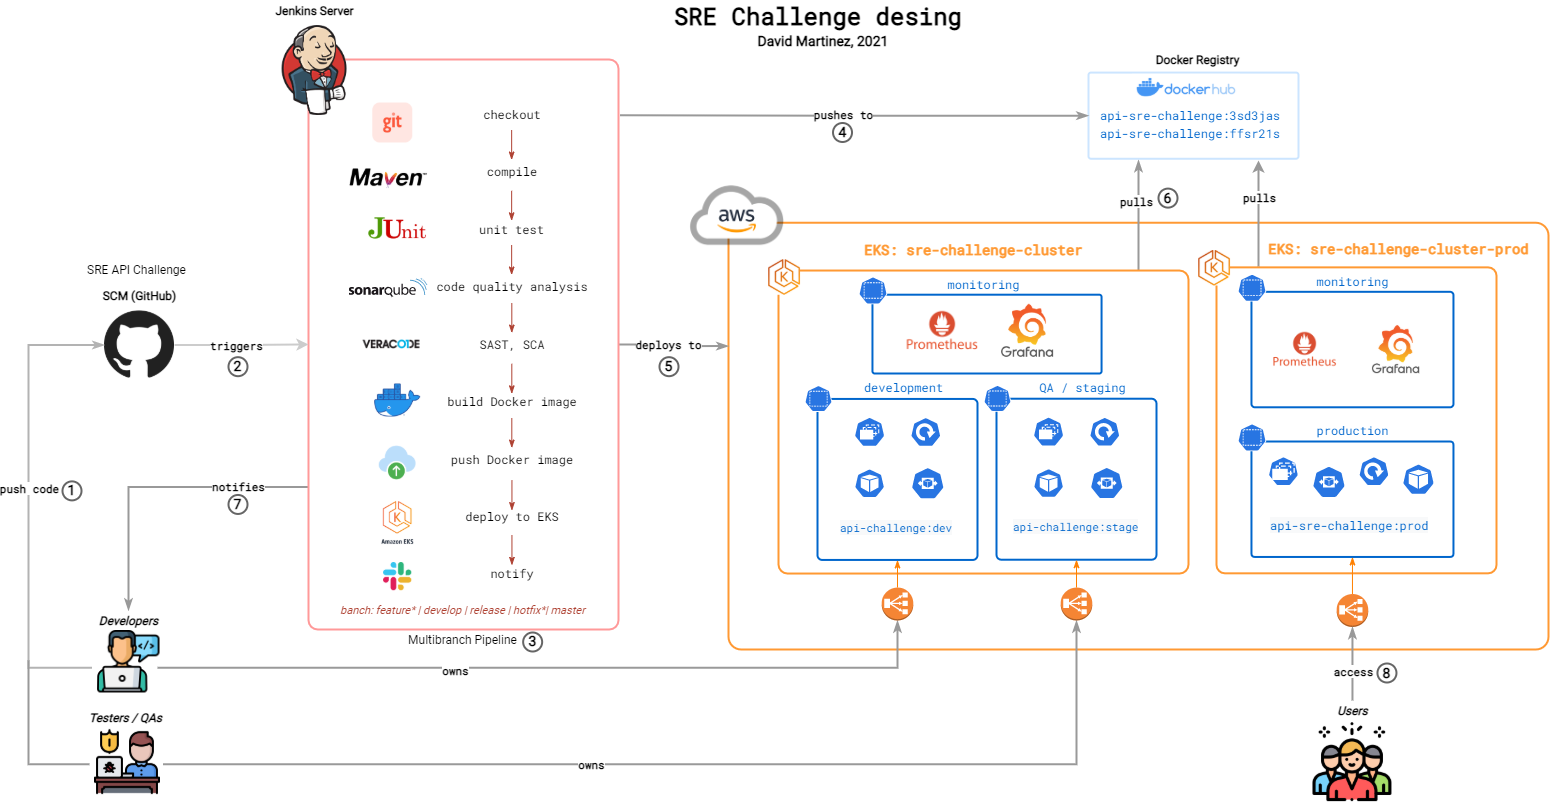
Given a Java Spring Boot application, a group of developers/testers will be working on a GitHub repository with a branching strategy defined in Development Workflow. With every commit, a Jenkins Multibranch Pipeline will be triggered, executing a series of steps defined in The Pipeline. At the end of a successful pipeline run, and based on the branch, the application will be deployed to one of the three environments (develop, staging or production) based in AWS Elastic Kubernetes Service (EKS). This EKS cluster has managed Kubernetes nodes/workes that will elastically scale to meet demand requirements. Internally, there are definitions of Kubernetes resources for the application like Deployments, ReplicaSets, Services or Horizontal Pod Autoscalers, that will and guarantee the resiliency of the service. For Observability, in each of the clusters, there is a namespace with resources for monitoring, metrics, alerts (Prometheus); and analytics and interactive visualizations (Grafana).
I tried to automate as much as possible. Filling up the runtime.env file will be enough to have the Jenkins CI/CD environment completely configured (plugins, configurations, credentials, and also the Jenkins pipeline). I also provide Terraform code to deploy the Kubernetes application infrastructure and environment in the AWS cloud, using EKS.
Requirements
| Name | Version |
|---|---|
| Docker | => 20.10.5 |
| Terraform | => v0.14.10 |
| aws-cli | => 2.1.36 |
| kubectl | => 1.19 |
I built a Jenkins image for this challenge that leverages the JCAC plugin to bundle all dependencies like plugins, configs, and credentials.
The latest image can be pulled from DockerHub at davismar98/Jenkins-challenge or build locally with the provided Dockerfile.
The image is fed with the environment variables located at ./jenkins/env/runtime.env. Most of the variables are credentials. All of them are required to execute the pipeline successfully.
We also will be running Docker commands, thus, it is required to run the Docker in Docker image, sharing the jenkins network. The commands are as follows:
#Create bridge network for Jenkins
docker network create Jenkins

#Lauch the Docker In Docker container
docker run --name jenkins-docker --rm --detach \
  --privileged --network jenkins --network-alias docker \
  --env DOCKER_TLS_CERTDIR=/certs \
  --volume jenkins-docker-certs:/certs/client \
  --volume jenkins-data:/var/jenkins_home \
  --publish 2376:2376 docker:dind --storage-driver overlay2

#Launch custom Jenkins
docker run -d --rm --name jenkins  \
  -p 8080:8080 -p 50000:50000 --network jenkins  \
  -v jenkins-data:/var/jenkins_home -v jenkins-docker-certs:/certs/client:ro  \
  --env-file env/runtime.env davismar98/jenkins-challenge:latest
NOTE. This image can also be run in a Kubernetes cluster and use the Kubernetes Jenkins plugin to execute the jobs in pods. For the scope of the challenge, I used a local deployment of Jenkins.
To deploy the application infrastructure and environment, just set up the credentials for an AWS IAM user that has enough permissions to deploy VPC and EKS resources. Then, inside the ./terraform/sre-challenge-k8s directory and run.
terraform init
terraform plan -out sre-challenge.tfplan
terraform apply sre-challenge.tfplan
I am leveraging the official Terraform AWS modules to abstract VPC and EKS deployments. I also used kubernetes and helm providers to automate all the environment with namespaces and the monitoring solution. terraform apply will deploy around 60 total resources.
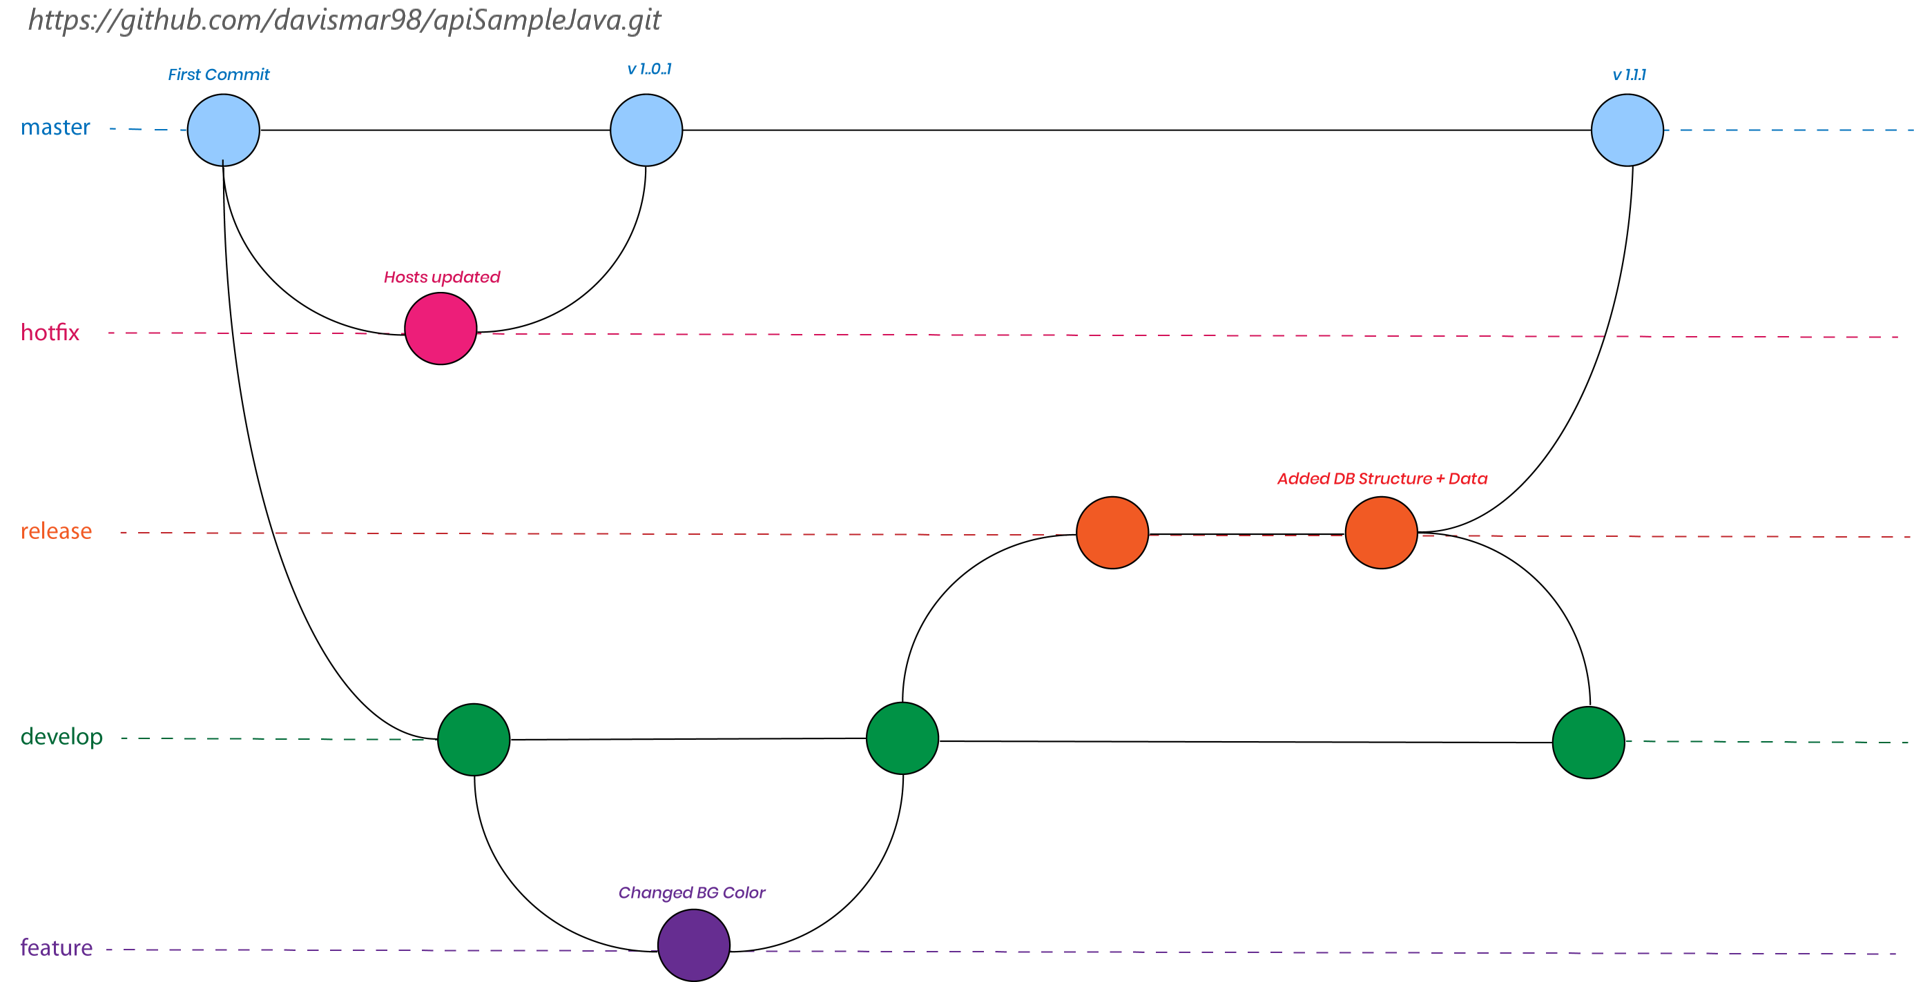
In order to guarantee a high level of consistency in the application environments, developers should strictly follow the git-flow branching strategy describe below. This is important since the Jenkins pipeline will execute the steps with conditionals based on the branch.
- master/main: stores the official release history of the application. This branch will be mapped to the production environment.
- develop: serves as an integration branch for features. This branch will be mapped to the development environment.
- feature-<ticket-number>: feature branches use to develop as their parent branch. Each new feature should reside in its own branch, which can be pushed to the central repository for backup/collaboration. Jenkins will not deploy any changes until feature branches are merged to develop.
- release: when the develop branch has acquired new features for a release, those will be merged to the release branch. Testing and bug fixes will be performed on the branch. This branch will be mapped to the stage environment. Once the release is ready to ship to production, it will get merged into master and develop.
- hotfix<ticket-number>: used to quickly patch production releases. Similar behavior to release branches and feature branches except they're based on master instead of develop. As soon as the fix is complete, it should be merged into both master and develop. Jenkins will not deploy any changes until hotfix branches are merged to master or develop.
For this challenge, I used Jenkins as the automation server for CI/CD.
The pipeline is a Jenkins Multibranch Pipeline that will be a constraint to run on specific branch patterns, according to the defined development branching strategy.
You can find the fully functional Jenkinsfile in the App Repository
-
Compile the Java Spring Boot application. I used Maven 3.6.3 installed a tool in Jenkins.
-
Unit Test. Maven also is used for this stage. Although this app did not include proper unit tests.
-
Code Quality Analysis. (TODO) Integration with a tool like SonarQube to inspect the quality of the code.
-
Application Security Test (SAST, SCA). (TODO) Integration with a tool like Veracode, Checkmarkx, or Black Duck to perform Static application security testing to find flaws and security vulnerabilities. Also, to perform a Software Composition Analysis for risk management, security, and license compliance with opensource software.
-
Build Docker Image. A new image is created with the application name and tag (the short SHA of the git commit was used). Example: davismar98/api-sre-challenge:b0514e3. It only builds new images for branches develop, release, and master/main.
-
Test Docker Image. Performs any test (scripts) that run inside the docker container to validate functionality.
-
Deliver Docker image. Pushes the image to my personal public Docker Hub davismar98/api-sre-challenge
-
Remove local Docker images. Performs a cleanup in the Jenkins executor node since the image is already in the registry.
-
[PARALLEL] Deploy the application to environment. Since it is a Multi-branch Pipeline, the step executed will be base on the current branch. The deployment will be as follows
- branch:develop ==> env:develop
- branch:release ==> env:staging
- branch:master/main ==> env:production
Branches hotfix/* or feature* will only be built and tested, but not deployed. Other branches that don't follow the git-flow naming convention will not be picked up by the Jenkins pipeline.
For this step, Jenkins authenticates to AWS with an IAM user that has enough privileges to update resources within the EKS cluster (roles are mapped during the Terraform execution).
- Slack notifications. It will send a message with the output of the pipeline to a Slack channel. It allows continuous feedback to developers/testers.
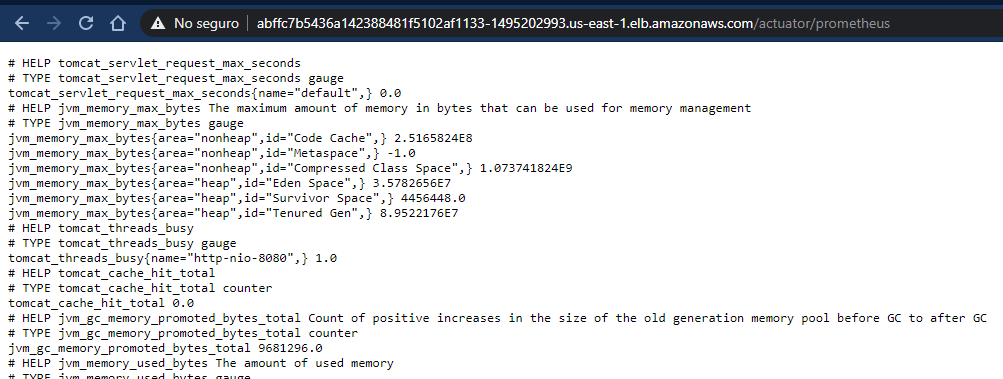
In order to monitor the Sprint application, it is needed to enable HTTP endpoints or the JMX, to gather health, audit, and metrics.
To do so, it was required to add the spring-boot-actuator and micrometer-registry-prometheus dependencies to integrate it with the monitoring solution with Prometheus and Grafana.
...
        <dependency>
            <groupId>org.springframework.boot</groupId>
            <artifactId>spring-boot-starter-actuator</artifactId>
        </dependency>
        <dependency>
            <groupId>io.micrometer</groupId>
            <artifactId>micrometer-registry-prometheus</artifactId>
        </dependency>
...
Also, by default, only health and info web endpoints are exposed, so I had to add the entries in the src/main/resources/application.yml configuration file:
...
endpoints:
    web:
      exposure:
        include: health, metrics, prometheus
...
With this config, we expose metrics like HTTP requests, errors, saturation and latency, that will be used to generate promQL queries and help define Service-Level Indicators and Objectives (SLIs and SLOs).
In the next section, I will showcase the deployed solution and how these metrics are presented in Grafana dashboards.
Since Prometheus and Grafana are deployed in the monitoring namespace of the clusters, we will be exporting metrics for all Kubernetes resources (i.e node-exporter). This will allow for a comprehensive view of the status of the application environment. Proactive monitoring and alerts will help guarantee a highly available and resilient environment with zero downtime.
-
Using EKS, most of the infrastructure and Kubernetes resources are managed by AWS (clontrol-plane, node/workers).
-
Using a managed Kubenertes service allows to deploy services as type LoadBalancer to quicky expose external access to the application without the need of creating and maintaining Ingress resources (although for more complex apps would be required).
-
For a single application like the one provided by the challenge, it would have been better to use a serverless architecture (i.e. Fargate) since you only pay what you use.
-
The implemented solution uses namespaces to segregate the environments. However, in a real life production application, it would be much better to have a cluster per environment to achieve:
- Independent sting new versions of Kubernetes, service mesh or cluster software.
- Full security complience and isolation for production environments.
Since I deployed the infrastructure in a personal AWS, I cannot leave it running for you ($$$). I provided the instructions to deploy it yourself (How to setup this environment), but in case you don't want to, I will be showcasing it in the upcoming sections:
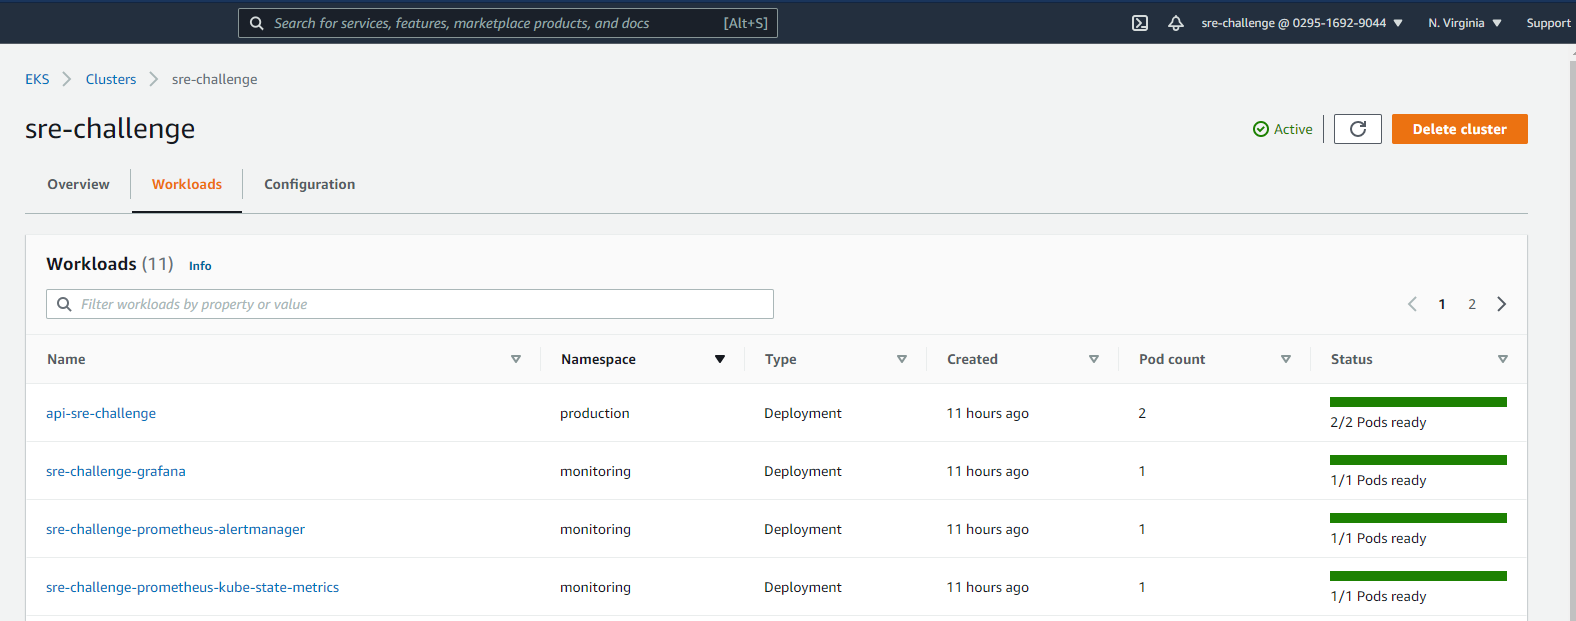
Here, you can see the workloads present in the EKS cluster.
 Querying all the resources created in the production namespace. 2 pods, 1 service, 1 deployment, 1 replicaSet, and 1 HPA.
 The application was exposed with a service of type LoadBalancer, that way we can access it using a Classic Load Balancer provided by AWS.
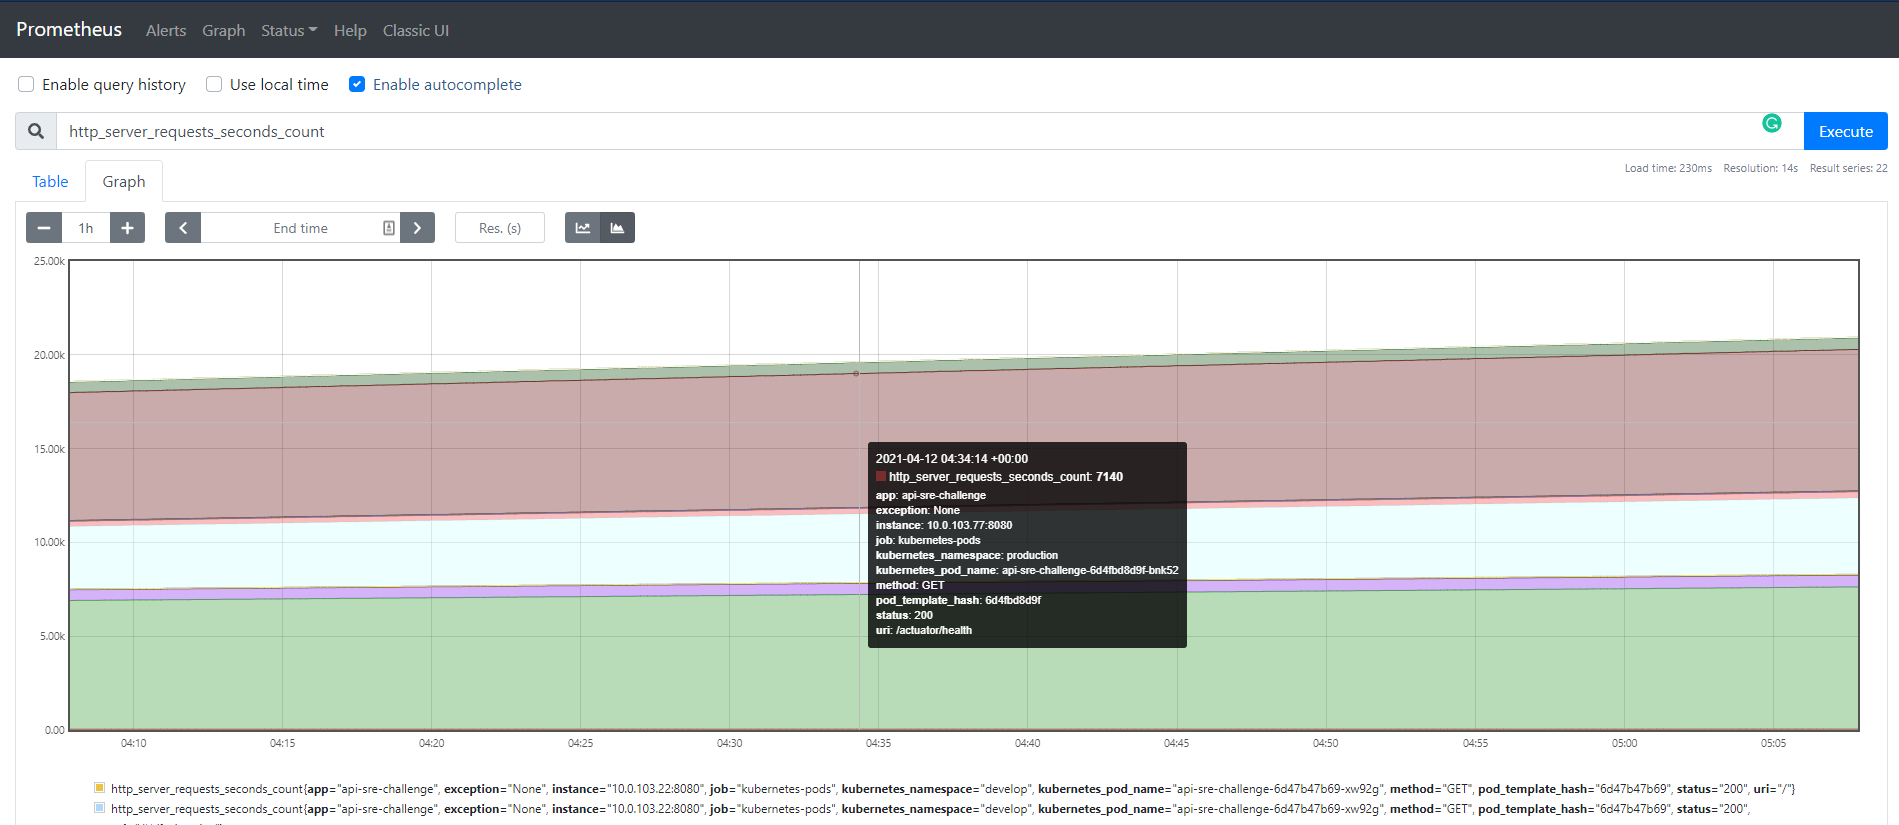 Here, we can start writing promQL queries to extract SLIs.
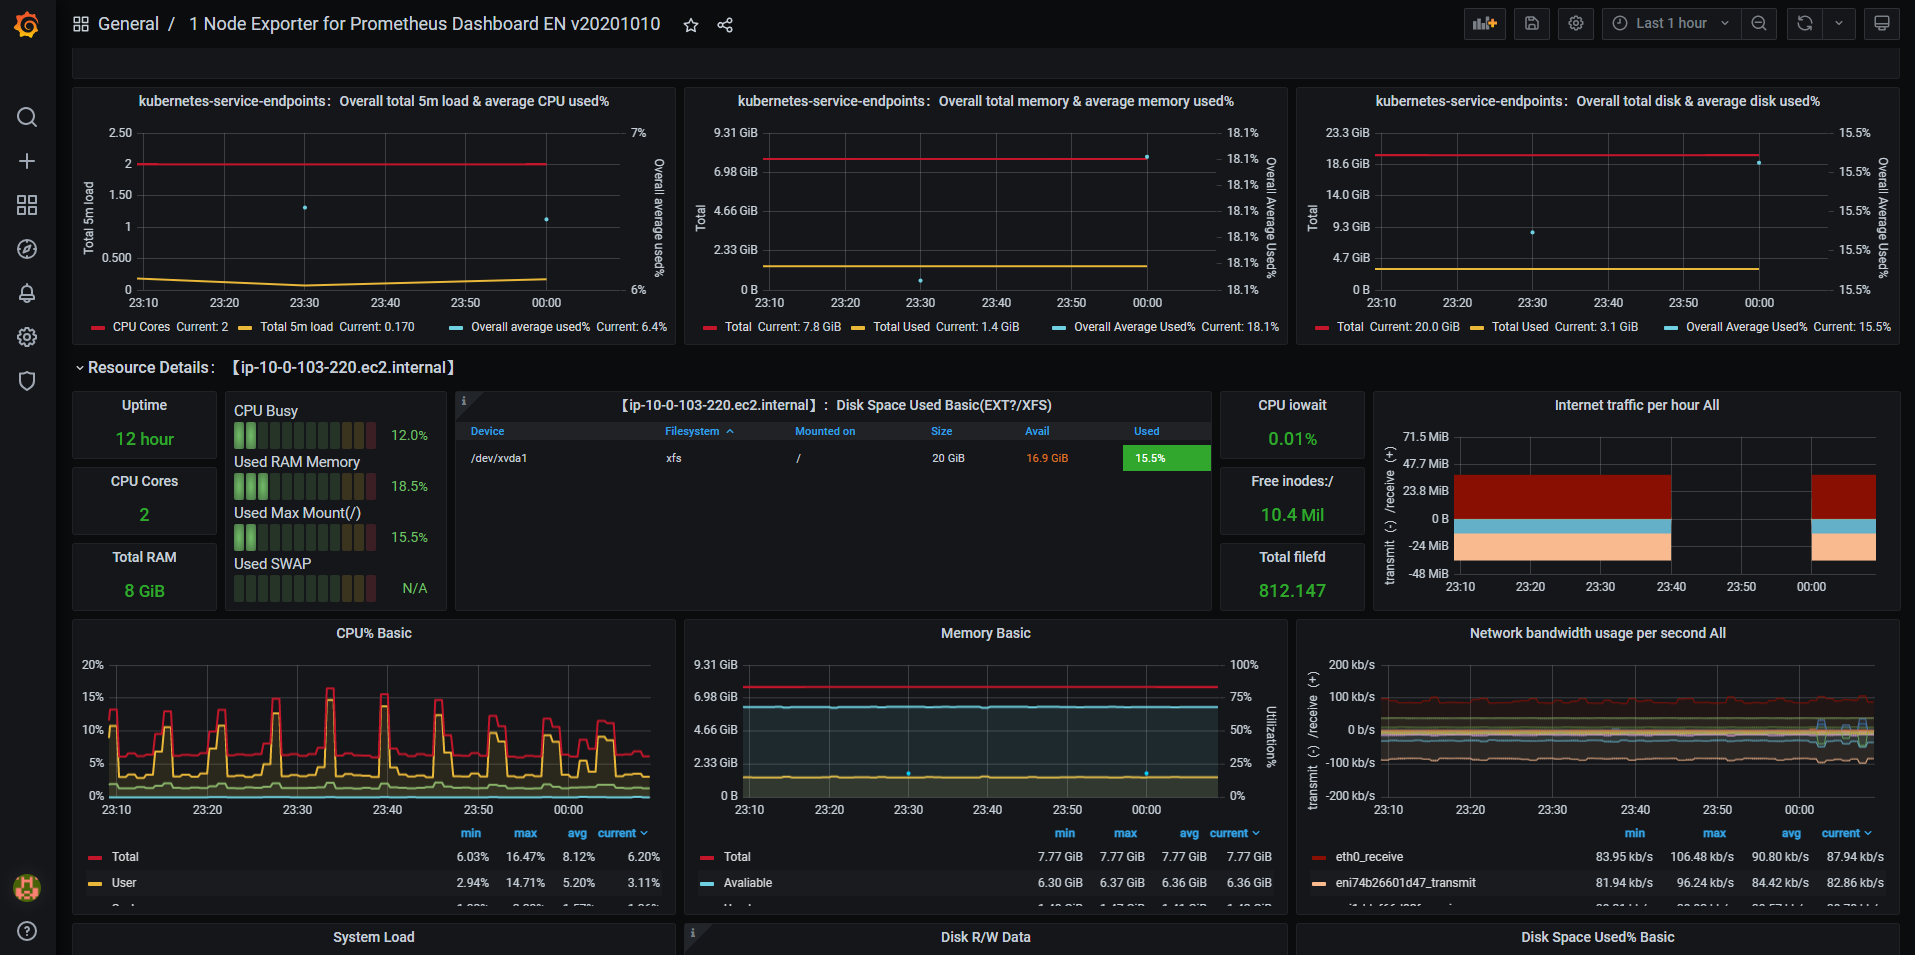 With custom or imported dashboards, we can start observing what is going on in the environment and define alerts.
 Both custom Jenkins and the application were pushed to my personal DockerHub registry.
 New jobs are being executed per branch. Jenkins will perform the CI/CD in a fully automated way.
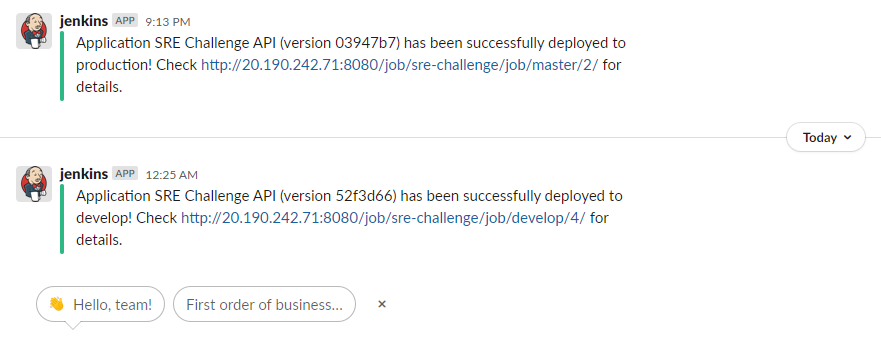 Receiving the results of the deployments in my #challenge channel in Slack.
