![]()
Web application project for analysing logs using time-series analysis. Loaded data kept in memory (h2 persistence option available but is pretty slow compared to in memory). Server side is java, client side is JQuery javascript.
This tool enables guerilla style log analysis. Namely that the tool can be started and load all relevant locally available logs ready for analysis in a minute say for one million records. In the author's work environment we leave the tool running but you could stop it after your analysis is complete if concerned about possible impact on your production instance.
Status: production
Configure to load and tail local files then start a local jetty web server to serve interactive graphs (charts in US speak).
This project was created to perform log-analysis selectively and locally only without the headache and cost (sometimes worth it) of setting up a distributed log gathering system like Splunk. All data is loaded into memory and when more log lines are read than is memory available then the eldest lines are trimmed. Queries are fast (1 second refresh time for many graphs that involve 1 million records).
Ideal for ad-hoc investigations. Edit the configuration on the admin page to narrow your investigation (maximizing history in the area you are interested in) and hit the reload button. Then view graphs generated lightning fast.
Logan is used to visualize performance of production java applications at the Australian Maritime Safety Authority and has been a fantastic addition to our stack. We run logan with about 1.7GB of heap and configure it to load the last million lines of our critical log files. Loads all files ready for graphing in about 1 minute and then stays up to date with latest log lines.
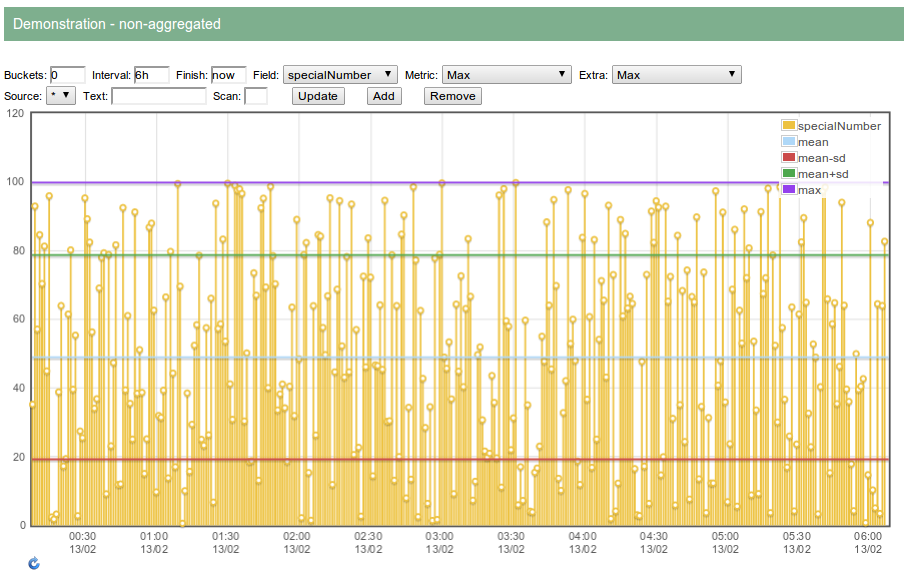
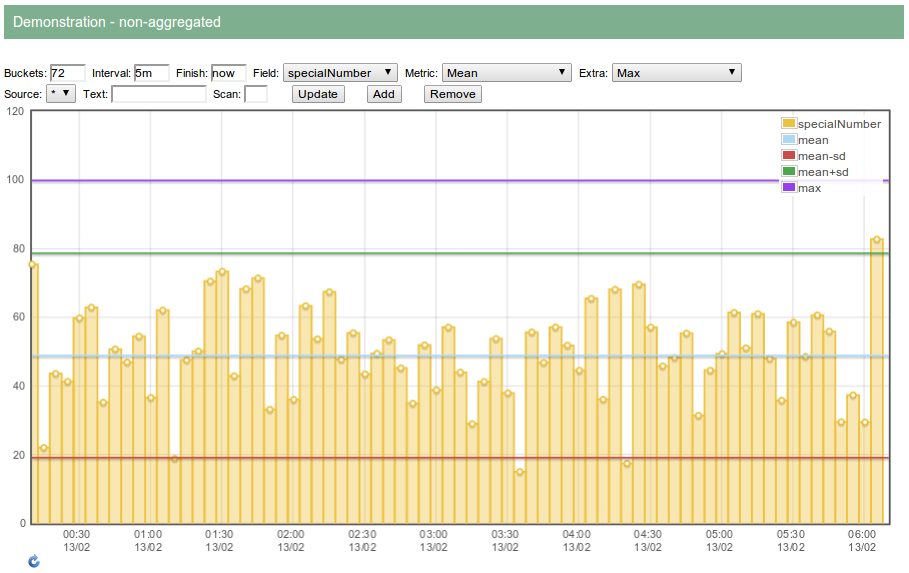
Non-aggregated:
Continuous integration with Jenkins:
- in-memory database
- pattern based log parsing
- fast parsing and query
- simplified datetime input (last day,last hour etc)
- parses single line and two line logging (e.g. java.util.Logging)
- tails log files, handles rollover, deletion (using Apache commons-io Tailer)
- aggregated or non-aggregated graphs
- search by field (key=value patterns in the log lines)
- search by source
- search by text fragment
- extract nth decimal number from line
- zoom in/out and pan
- multiple graphs to a page defined by url parameters
- click on data points shows logs around that time (+/-5min)
- numerous supported aggregation metrics including
- MAX
- MIN
- MEAN
- STANDARD_DEVIATION
- COUNT
- SUM
- VARIANCE
- SUM_SQUARES
- FIRST
- LAST
- EARLIEST
- LATEST
Comprises the following internal components:
- data (in memory database using treemaps)
- watcher (loads logs according to configuration and may continue to watch those files for changes)
- servlet (html/json data services)
- ui (jQuery-UI + flot web front end which communicates exclusively with JSON services)
Distribution tar.gz is here on Maven Central.
tar -xvzf logan-0.3.tar.gz
cd logan
touch configuration.xml
Edit start.sh and stop.sh with your desired ports (make sure the stop ports match).
Edit configuration.xml with your log file names and extraction patterns (see sample-configuration.xml).
To start:
./start.sh &To stop:
./stop.shTo update the distribution you can replace all but your customized start.sh and stop.sh scripts and your configuration.xml file.
Logs are written to daily rolled-over files of the format logan-yyyy-mm-dd.log in the same directory as the start and stop scripts.
On host where logs are:
cd <YOUR_WORKSPACE>
git clone https://github.com/davidmoten/logan.git
cd logan
mvn jetty:run
Go to http://localhost:8080.
To customize with your own configuration and say port 9292:
mvn jetty:run -Djetty.port=9292 -Dlogan.config=<YOUR_CONFIGURATION_XML>
The crux of using a tool like this is really configuration. You have to tell the tool how to extract interesting bits of information out of your logs like timestamps, class names, method names, thread name, log levels, key-value pairs and the like.
The file src/main/resources/sample-configuration.xml contains configuration aimed at parsing log4j style logs and is in use at my workplace. The file has plenty of comments so is a good place to start to understand configuration. Examples are given for parsing:
- log4j java logs
- perl logs
- solaris syslog
Yep. Go to http://localhost:8080/admin and hit the Sample button. This will sample the first 20 lines of all matching log files and show what was parsed from them. This will not change the current configuration till you hit the reload button.
As a rough guide, if
n = the number of files being actively watched,
m = maxSize from configuration (max number of log lines to be kept in memory for queries)
then
maxHeapSize = max(64, (n+10)/4 + m/1000) in MB
For example if n = 100, m = 1000000, then maxHeapSize=1027MB so run logan like this:
export MAVEN_OPTS='-Xmx1027m'
mvn jetty:run <params>
The paths of log files to be analyzed is specified in the <log> element of the configuration file as below:
<log source="test" watch="true">
    <path>PATH/FILENAME_REGEX</path>
</log>
- PATH is the ANT style wildcard path of the directory.
- FILENAME_REGEX is a java regular expression for matching the filename part of the log file.
- source can be extracted automatically from the filename by setting sourcePattern in the parser element in the xml
- If you set watch=false (the default is true) then the file will be processed but further additions to that file will not be detected
An example using directory wildcards and a regular expression:
<log source="test">
    <path>/var/log/myapps/**/log/my.*\.log</path>
</log>
This breaks down into a PATH of /var/log/myapps/** which means /var/log/myapps and all its subdirectories. Note that for a PATH, * denotes any directory and ** denotes any nested sequence of directories including the current.
The FILENAME_REGEX is
my.*\.log
which matches all filenames starting with my and ending in .log.
System properties are substituted in the configuration.xml file at runtime.
For example if you have specified -Dmybase=/var/logs at the command line then all instances of ${mybase} will be substituted with /var/logs at runtime.
The configuration file (here) refers to three patterns. Here's a fragment concerning patterns:
<pattern>^(\d\d\d\d-\d\d-\d\d \d\d:\d\d:\d\d\.\d\d\d) +(\S+) +(\S+)+(\S+)? ?- (.*)$</pattern>
<patternGroups>logTimestamp,logLevel,logLogger,threadName,logMsg</patternGroups>
<messagePattern>(\b[a-zA-Z](?:\w| )*)=([^;|,]*)(;|\||,|$)</messagePattern>
<timestampFormat>yyyy-MM-dd HH:mm:ss.SSS</timestampFormat>
- line pattern (and its pattern groups)
- message pone)attern
<pattern>^(\d\d\d\d-\d\d-\d\d \d\d:\d\d:\d\d\.\d\d\d) +(\S+) +(\S+)+(\S+)? ?- (.*)$</pattern>
<patternGroups>logTimestamp,logLevel,logLogger,threadName,logMsg</patternGroups>
The above pattern is a java regular expression for parsing a typical log4j log line of the form below:
2012-11-29 04:39:19.846 INFO au.gov.amsa.er.craft.tracking.CraftpicProviderDirect - number of craft = 7379
Looking at the patternGroups the first matching group will be identified as the logTimestamp, second matching group as the logLevel (INFO in this case), and so on:
- logTimestamp = 2012-11-29 04:39:19.846 (actually the epoch ms value)
- logLevel = INFO
- logLogger = au.gov.amsa.er.craft.tracking.CraftpicProviderDirect
- threadName = null (not present)
- logMsg = 'number of craft = 7379'
The key-value parts of the logMsg are parsed by the message pattern described below.
Logan supports one or two line patterns.
The default java.util.logging pattern is a multiline (two line) pattern. Here's an example of a two line log:
23/12/2012 6:58:04 AM org.moten.david.log.core.Database persistDummyRecords
INFO: persisted random values=1000 from the last hour to table Dummy
Two line patterns are configured as below:
<pattern>^(\d\d/\d\d/\d\d\d\d \d\d?:\d\d:\d\d (?:(?:AM)|(?:PM))) +(\S+) +(\S+)ZZZ(\S+): (.*)$</pattern>
<patternGroups>logTimestamp,logLogger,logMethod,logLevel,logMsg</patternGroups>
<timestampFormat>dd/MM/yyyy hh:mm:ss a</timestampFormat>
<multiline>true</multiline>
Take special note of the ZZZ which delimits line 1 from line 2 in the pattern. The two lines are concatenated using ZZZ between them and then matched against the pattern. In the same way the pattern groups refer to the groups found in the concatenation of the two lines.
<messagePattern>(\b[a-zA-Z](?:\w| )*)=([^;|,]*)(;|\||,|$)</messagePattern>
Above is the default message pattern used by log-persister. A matching key-value pair in a log message satisfies these properties:
- key must start with a letter and be preceded by a word boundary
- key can contain whitespace and any legal java identifier character
- key is separated from value by =
- value part is delimited at its termination by semicolon (;), comma (,), vertical bar(|) or end of line
<timestampFormat>dd/MM/yyyy hh:mm:ss a</timestampFormat>
The format is as defined for the SimpleDateFormat class.
- complete javadoc
- add more documentation to this site!
- improve unit test coverage
- multiple field criteria support
- use NIO for tailing files