This documentation will guide you on how to install Metrics Server on the IBM Cloud using the Kubernetes Service. Simple and effective.
You must have an account created in IBM Cloud. The account needs to either be Pay-As-You-Go or Subscription. Click here to read more. If you have a Lite account, you can upgrade it. Click here to learn how to upgrade.
- Click on the search section at the top of the main page, type Kubernetes, and then choose Kubernetes Service.
- In the new window, select between the free and standard type under "Pricing plan". Once selected, click on create.
We'll choose the Standard Plan for this documentation as the Free Plan may fall short of resources when deploying your pods. We highly recommend using a Standard Plan with the hardware that suits you the best. If you're selecting the Standard Plan, please make sure you select the adequate requirements,
- Select your Kubernetes Version to be the latest available or the required one by your application. In this example, we have set it to be '1.18.13'.
- Select Infrastructure as 'Classic'.
- Leave Resource Group to 'Default'.
- Select Geography to the one that suits you better or that fits your infrastructure.
- Select Availability to be 'Single Zone' or 'Multi Zone' depending on your needs.
- Select a Worker Zone that suits you better or that fits your infrastructure.
- Select the number of workers in Worker Pool.
- Give your Worker Pool a name.
- Leave the Encrypt Local Disk option 'On'
- Choose 'Both private and public endpoints' on Master Service Endpoint
- Give your cluster a name in 'cluster-name'
- Provide the tags to your cluster and click on Create.
Wait a few minutes while your cluster is deployed.
The following checkmark and the word 'normal' will appear once the Kubernetes Cluster is deployed. You can check it under your cluster section which is located in your Resources List.
- Click on the search section at the top of the main page, select IBM Cloud Block Storage, and click on it.
- A new window opens, select the cluster and enter the name you want for this workspace, in this case, it will be called metrics-example, accept the terms, click Install and wait a few minutes.
- Click on the search section at the top of the main page, type Metrics Server, and click on it.
- A new window opens, select the cluster and enter the name you want for the Metrics Server workspace, in this case, it will be called metrics-example, accept the terms and click on Install. You can modify the different installation parameters at the bottom. We will leave them by default as shown below, but you can read more about setting up the parameters here.
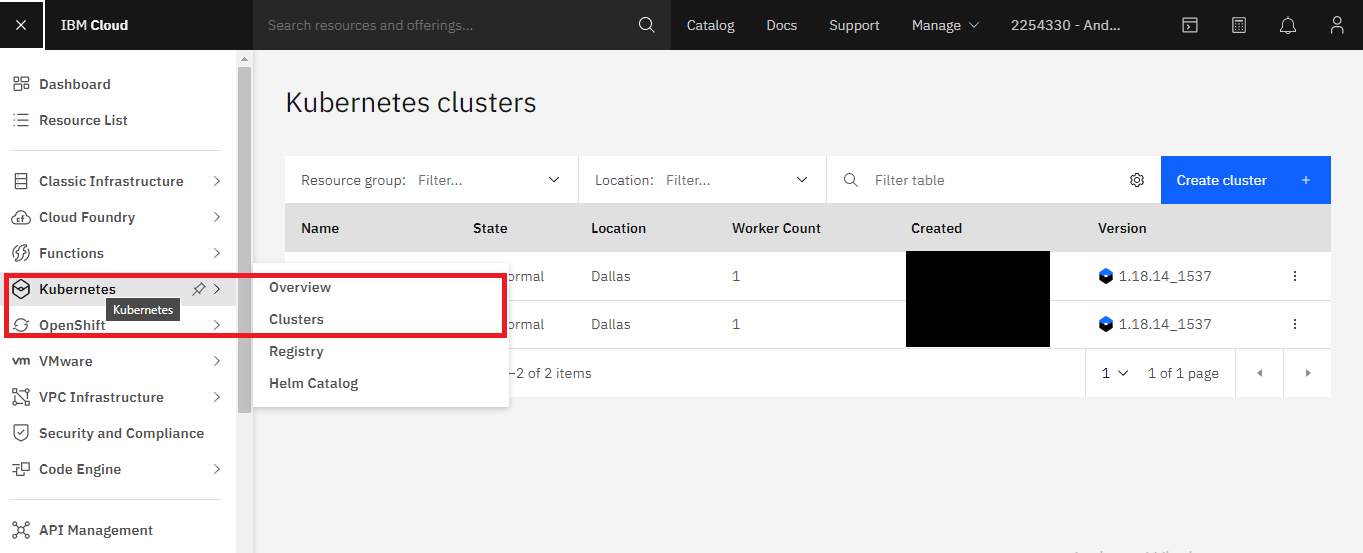
- Go to Resources List in the Left Navigation Menu and click on Kubernetes.
- Click the Actions button and select Web terminal.
- A window opens to install the web terminal, click on install and wait a few minutes. The window will pop up at the buttom If the web terminal is already installed.
- Once you have installed the terminal, open it, and type the following command. It will show you the workspaces of your cluster. You can see metrics-example is now active.
$ kubectl get ns
- You can then obtain more data about the service and it's pods.
$ kubectl get pod -n NAMESERVICE -o wide
$ kubectl get service -n NAME SERVICE
- Select the pod within your service using bash so you can check the installation from the terminal.
$ kubectl exec --stdin --tty PODNAME -n NAMESPACE -- /bin/bash
- Select the pod within your service using bash so you can check the installation from the terminal.
- You can now use the Metrics Server to its API to read the Kubernetes Cluster metrics. You can edit the configuration file to fine tune and adjust what you need. You can read more about it here.
$ kubectl edit configmap metrics-server-config -n kube-system
You have finished the installation, enjoy your Metrics Server Installation.
