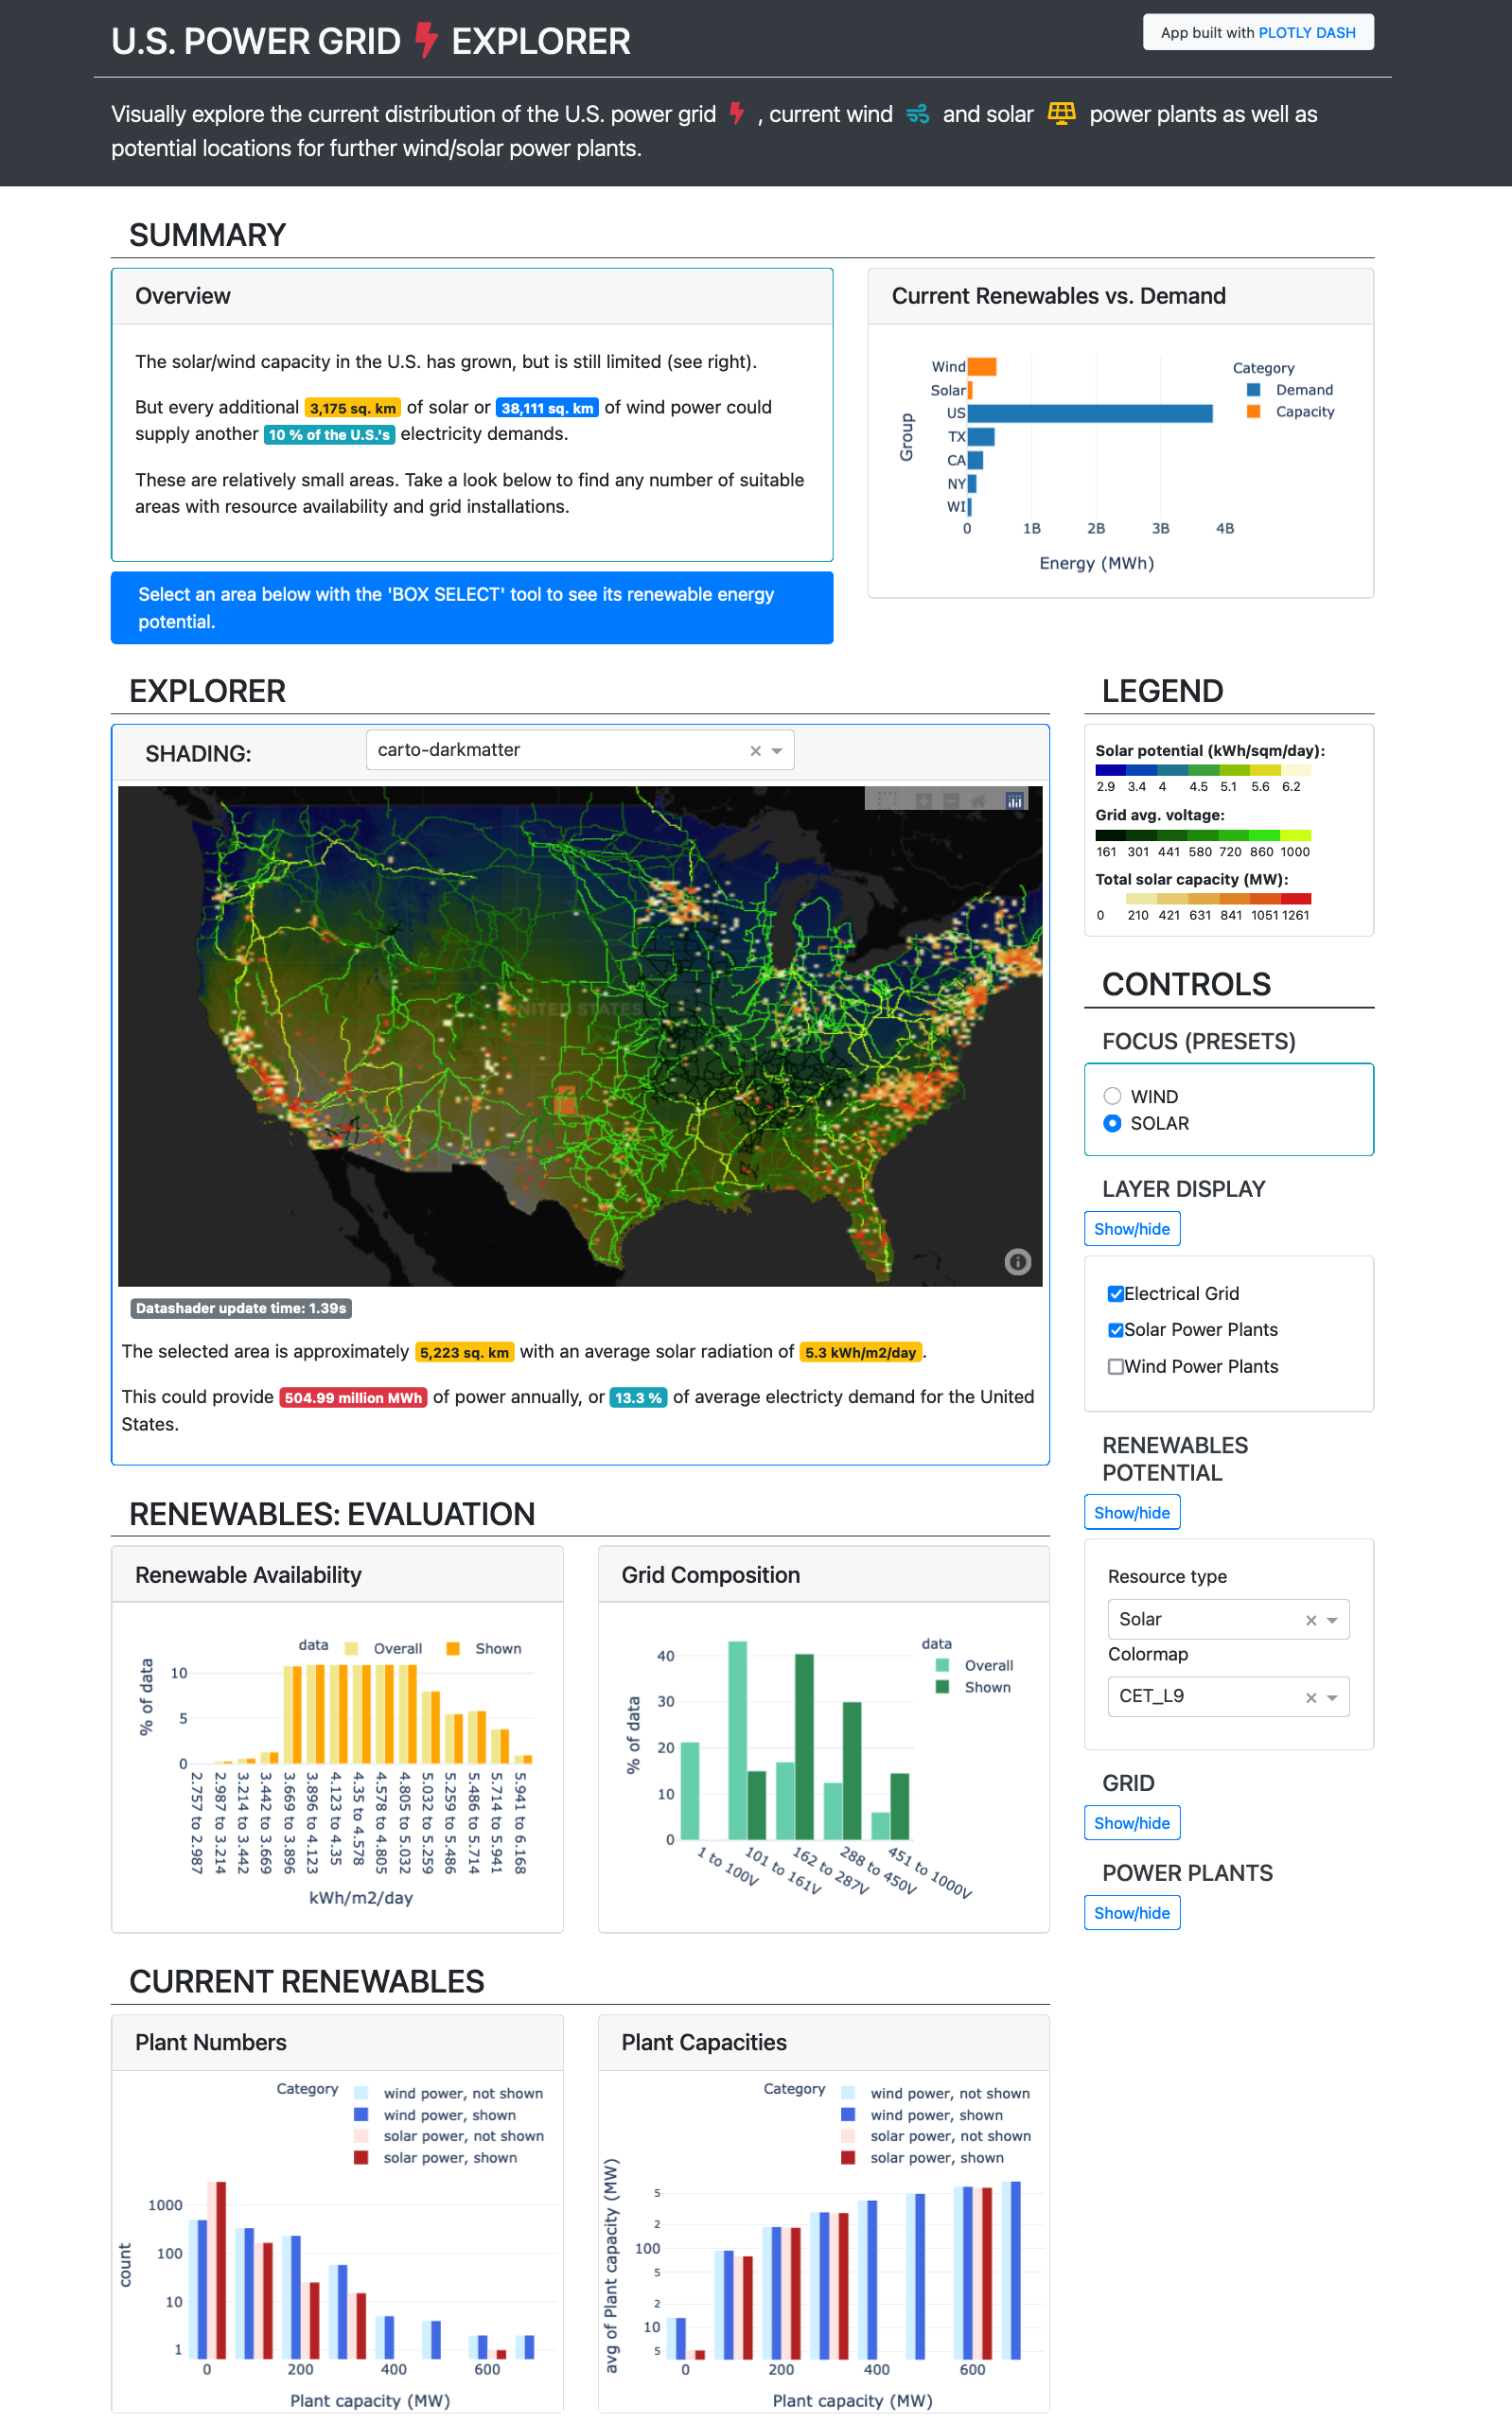
This app allows interactive exploration of the power grid data as well as renewable (solar and wind) power plant data throughout the United States.
The grid data (as lines) and power plant data (as points) are aggregated through DataShader and interactively overlaid onto a Mapbox map in real-time.

Dash handles the front end, while Dask handles the compute requirements at the back end.
The code base also provides code for optionally using Coiled.io's cloud clusters instead of a local server.
For convenience, the code is provided as one branch and the user can see in app.py and launch.sh the commented portions which can be changed to adjust between a local cluster and a Coiled cluster.
As coiled_login.py reads the Coiled.io token as an environmental variable, it must be saved as appropriate for your OS.
- Plotly Dash (https://plotly.com/)
- Dask (https://dask.org/)
- Coiled (https://coiled.io/)
- Datashader (https://datashader.org/)
- https://atlas.eia.gov/datasets/geoplatform::electric-power-transmission-lines/about
- https://atlas.eia.gov/datasets/eia::solar-2/about
- https://atlas.eia.gov/datasets/eia::wind-2/about
- https://www.nrel.gov/gis/solar-resource-maps.html
- https://www.nrel.gov/gis/wind-resource-maps.html
- https://ourworldindata.org/energy-production-consumption
- https://www.eia.gov/energyexplained/use-of-energy/electricity-use-in-homes.php
- https://www.nrel.gov/pv/cell-efficiency.html
- https://www.nrel.gov/docs/fy09osti/45834.pdf
Built with Plotly Dash