Welcome to the Github Repository of the Python Graph Gallery.
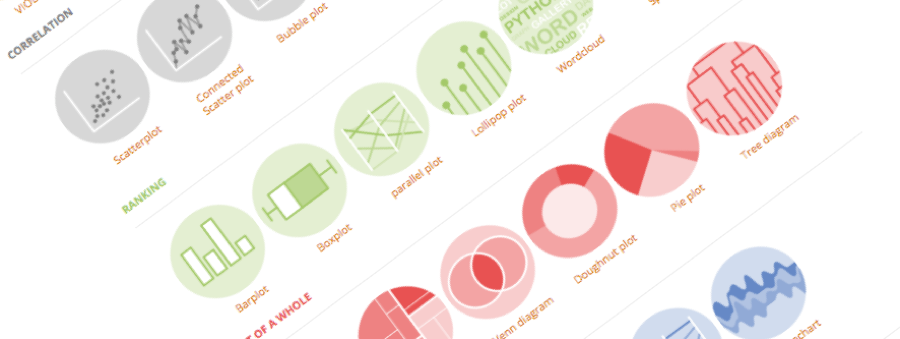
The Python Graph Gallery is a website that showcases hundreds of graphics, all made using python. Charts are displayed in ~40 categories, and are always accompanied with their reproducible code. It allows users to quickly copy and paste a snippet of code and adapt it to their dataset.
The Python Graph Gallery is a work developped by Yan Holtz during its nights, week-ends and holidays. Thus, please be indulgent if you find any bug, inconsistency or potential improvement. By definition, this project will never be finished (datavis possibilities are infinite!)
I would be really happy to receive new chart examples that you consider as missing to the gallery. Please note that they must respect certain features:
- Code must be fully reproducible: a copy and paste must be enough to get the figure
- Code must be as effective as possible AND well commented
- Chart must be clearly different from the ones already existing
- It is a plus if the chart is accompanied by a few explanation on how the code works
Please send me any suggestion to yan.holtz.data@gmail.com OR add the code to the CONTRIBUTION folder through a pull request. Please note that I keep the decision to add the chart or not, since I want to keep the selection of the charts present in the gallery as efficient as possible.
Last but not least, you probably notices that my english is terrible. I apologize for that, and any mistake feedback is welcome!
Thank you very much for any contribution!
Feel free to reuse any of the chart displayed in the gallery at your convenience! However, please don't forget to give credit to this work by citing it! Most importantly, add links to the gallery since it allows the website to grow.
There are many people I would like to acknowledge:
-
Creators of Matplotlib, Seaborn, and Pandas. Awesome tools, without them python would be way different, and the gallery would not exist. Sometimes, my examples can be close from their documentation, but I always link toward their webpages.
-
Creators of other libraries and blog who accepted that I share their creations.
-
People who already sent me some feedbacks / bug reports / proposition of improvement.
-
People who said me thank you! Without that I would not developp this resource...
-
My friend Guillaume Guimzu Debreu without who I would never have had the Idea to make the galleries.
-
My friend Conor Healy, best designer ever, who did the awesome set of Logo.
-
My friend Jean-Phi for his precious advices.
-
My wife Mel Mulot who bears me even when I code by night
-
All my english speaker friends who correct me with patience (Lou Papéou, Annie-Rose, Cherelle, Kath, Shenfa)
