DMS DAppNode Package
DAppNode Monitoring Service
This package privately and locally collects and displays metrics related to your dappnode and its packages. Based on Grafana and Prometheus
How does it work?
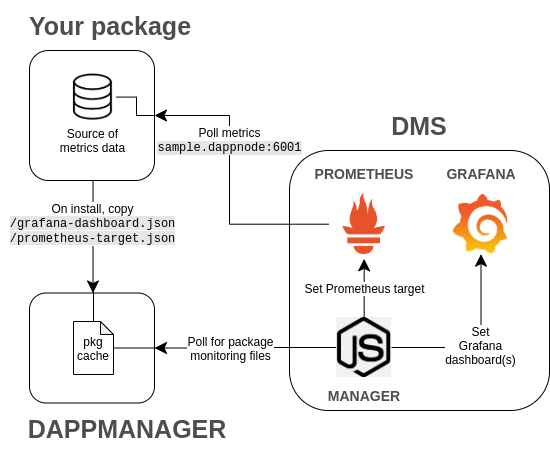
According to the following diagram, the DMS package provides a high level of abstraction, allowing any new DAppNode package developed to easily implement grafana and prometheus.
Instructions to implement Grafana and Prometheus in your DAppNode package:
- prometheus-targets.json file: specifying the domain and the port where the data will be published.
- name-grafana-dashboard.json file: specifying the grafana dashboard to be used.
If you want to learn more about how do Grafana and Prometheus work, visit this link
How to add a custom prometheus endpoint
In order to add a custom path to prometheus you need to overwrite the __metrics_path__ label (by default /metrics), so that you can define diferent and specific metrics paths per target, like this:
[
    {
        "labels": {
            "package": "tg.turbo-geth.dnp.dappnode.eth",
            "service": "tg.turbo-geth.dappnode",
            "__metrics_path__": "/debug/metrics/prometheus"
        },
        "targets": [
            "tg.turbo-geth.dappnode:6060"
        ]
    }
]
Note
This is early stage software and it's just a PoC
License
This project is licensed under the GNU General Public License v3.0 - see the LICENSE file for details

