gotraceui - an efficient frontend for Go execution traces
Gotraceui is a tool for visualizing and analyzing Go execution traces. It is meant to be a faster, more accessible, and
more powerful alternative to go tool trace. Unlike go tool trace, Gotraceui doesn’t use deprecated browser APIs (or a
browser at all), and its UI is tuned specifically to the unique characteristics of Go traces.
Use
Gotraceui is still a work in progress with many sharp corners, but you can already try it out. Simply build
honnef.co/go/gotraceui/cmd/gotraceui and run it, passing the path to a trace file as the only argument. See the
documentation of runtime/trace on how to obtain traces, and see Gio's
instructions to figure out the dependencies required for building Gotraceui.
Controls
None of these controls are final. Users without a middle mouse button will have a bad experience right now.
| Key | Function |
|---|---|
| Left mouse button (hold) | Pan the view |
| Ctrl/Command + left mouse button (drag) | Draw a zoom selection |
| Ctrl/Command + left mouse button | Zoom to clicked span or activity |
| Scroll wheel | Scroll up and down |
| Ctrl/Command + Scroll wheel | Zoom in and out |
| Home | Scroll to top of activity list |
| Ctrl/Command + Home | Zooms to fit current activities |
| Shift + Home | Jump to timestamp 0 |
| X | Toggle display of all activity labels |
| C | Toggle compact display |
| G | Open an activity selector |
| T | Toggle displaying tooltips; only spans -> none -> both spans and activities |
| O | Toggle displaying STW and GC overlays |
| S | Toggle displaying sampling-based timelines |
| Ctrl/Command + Z | Undo navigations (works most of the time) |
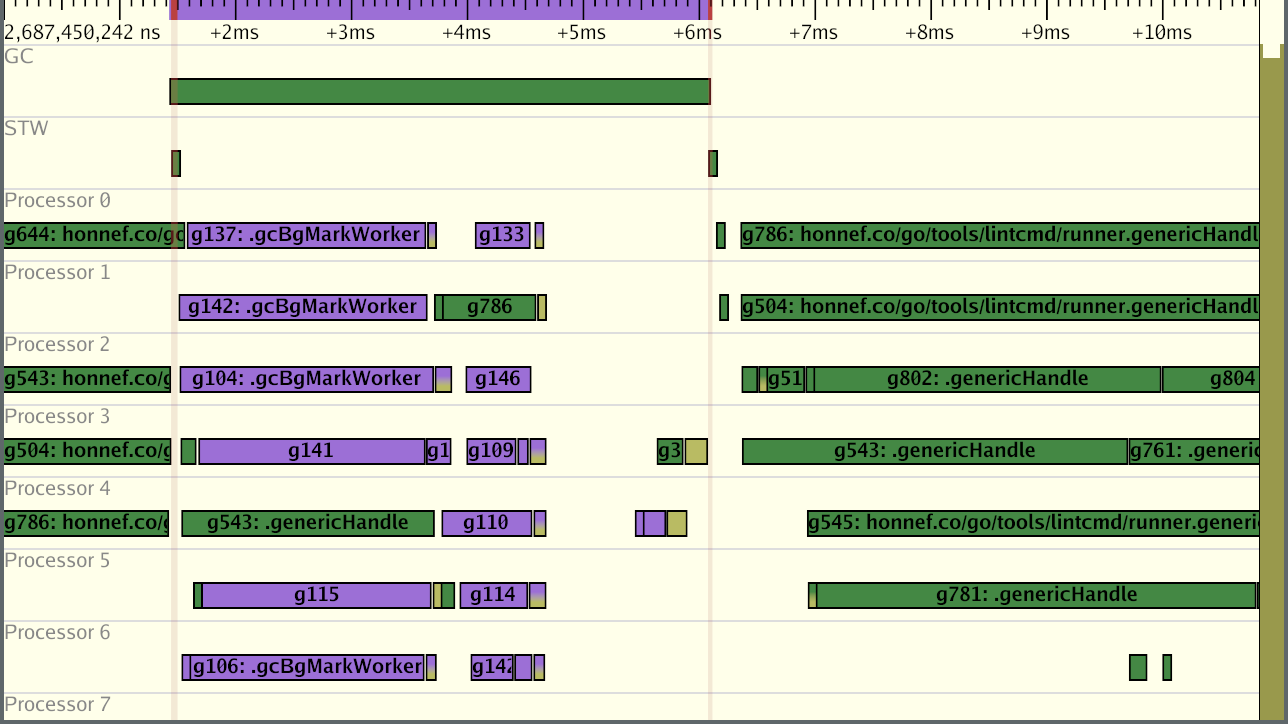
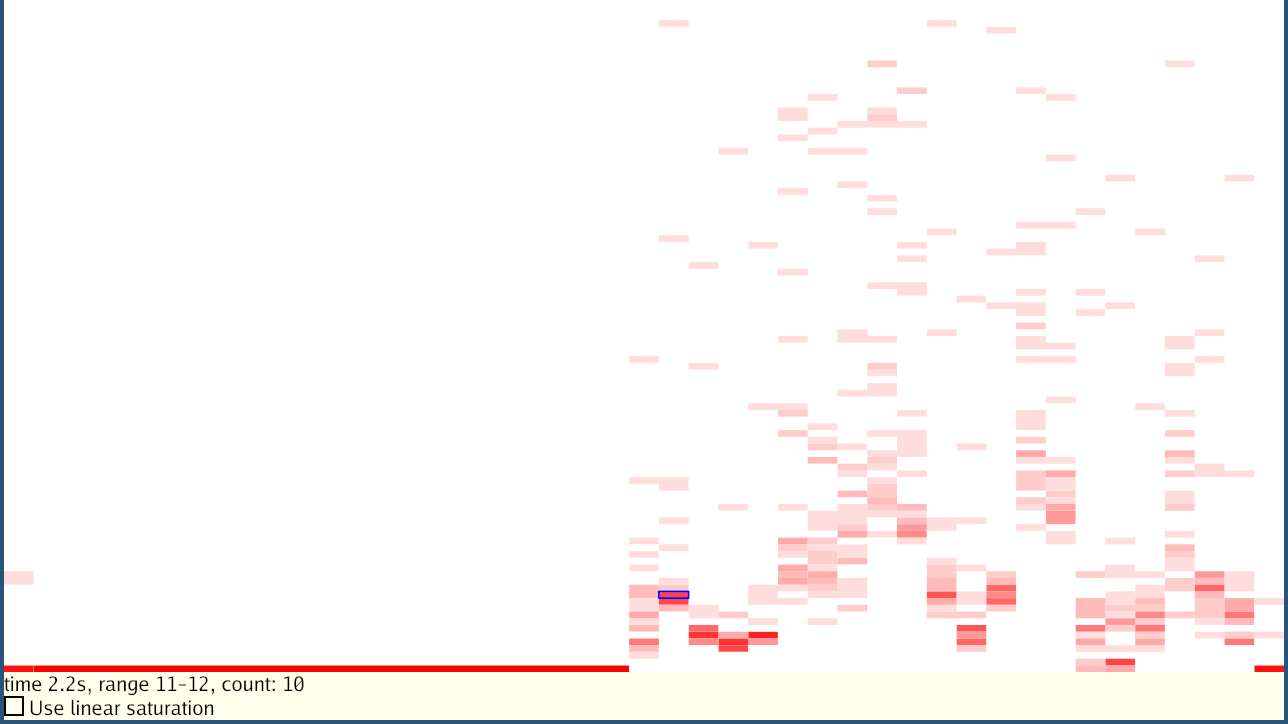
Screenshots
Enjoy some of these screenshots.


Notes
No aspect of Gotraceui is final yet, but do note that bright pink and bright yellow are debug colors and I never thought they were a good idea. The rest of the color scheme is actually meant to be pleasant.
Known issues
- runtime/trace: time stamps out of order
- Timelines with millions of events can be a bit slow to render