The Poverty Research Unit web app is currently a beta version of an online interactive companion to the annual Poverty Measure report.
It was initially developed by Civic Innovation Corps fellow Daniel J Wilson over the summer of 2021.
The app can be viewed at this link.
The data for the app comes from two sources.
- A publicly available dataset from NYC Open Data which contains basic demographic information and calculated indicators related to poverty developed by the Poverty Research Unit. The data is available here from 2005.
- An internal dataset which is used to augment the open data with additional information, such as respondant Public Use Microdata Areas (kind of like neighborhoods), employement sector, etc.
Most of the data used in both datasets originates from the American Community Survey.
The data_cleaning.Rmd file imports, cleans, and combines the data that is used in the R Shiny web app.
The columns that are to be used in the web app are initially declared in an external Google Sheet - you can duplicate and edit this file if you wish to change the data available to the app.
The data munging process consists of the following steps (the numbers below match the sections of the .Rmd file):
- File Specification
- Set file paths for both the open and internal datasets
- Create lists of all available files
- Pull out years for both open and internal files and test if they match
- Column Specification
- Import column selections from the Google Sheet
- Create separate lists of columns for both the open and internal datasets
- Import and Aggregate Data
- Loop through all years of the open dataset (which we treat as a "master")
- Starting with the open dataset select the columns specified by the Google Sheet
- Clean any funky data and convert categorical columns to factors
- Translate indicator codings to meaningful text descriptions using the relevant data dictionary
- Repeat for the internal dataset
- Join the two datasets
- Add
yearandpopulationcolumns - Append the data, then start on the following year
- Save Data
- We're done! Save the full dataframe to an
.RDSfile (much smaller than.csv)
- We're done! Save the full dataframe to an
The R Shiny web app consists of two main elements, the ui and the server. In fact every Shiny app has the same structure: an app.R file that contains ui and server.
The ui or User Interface, is what the user sees when using/interaction with the web app.
More info about how this functions in R can be found here.
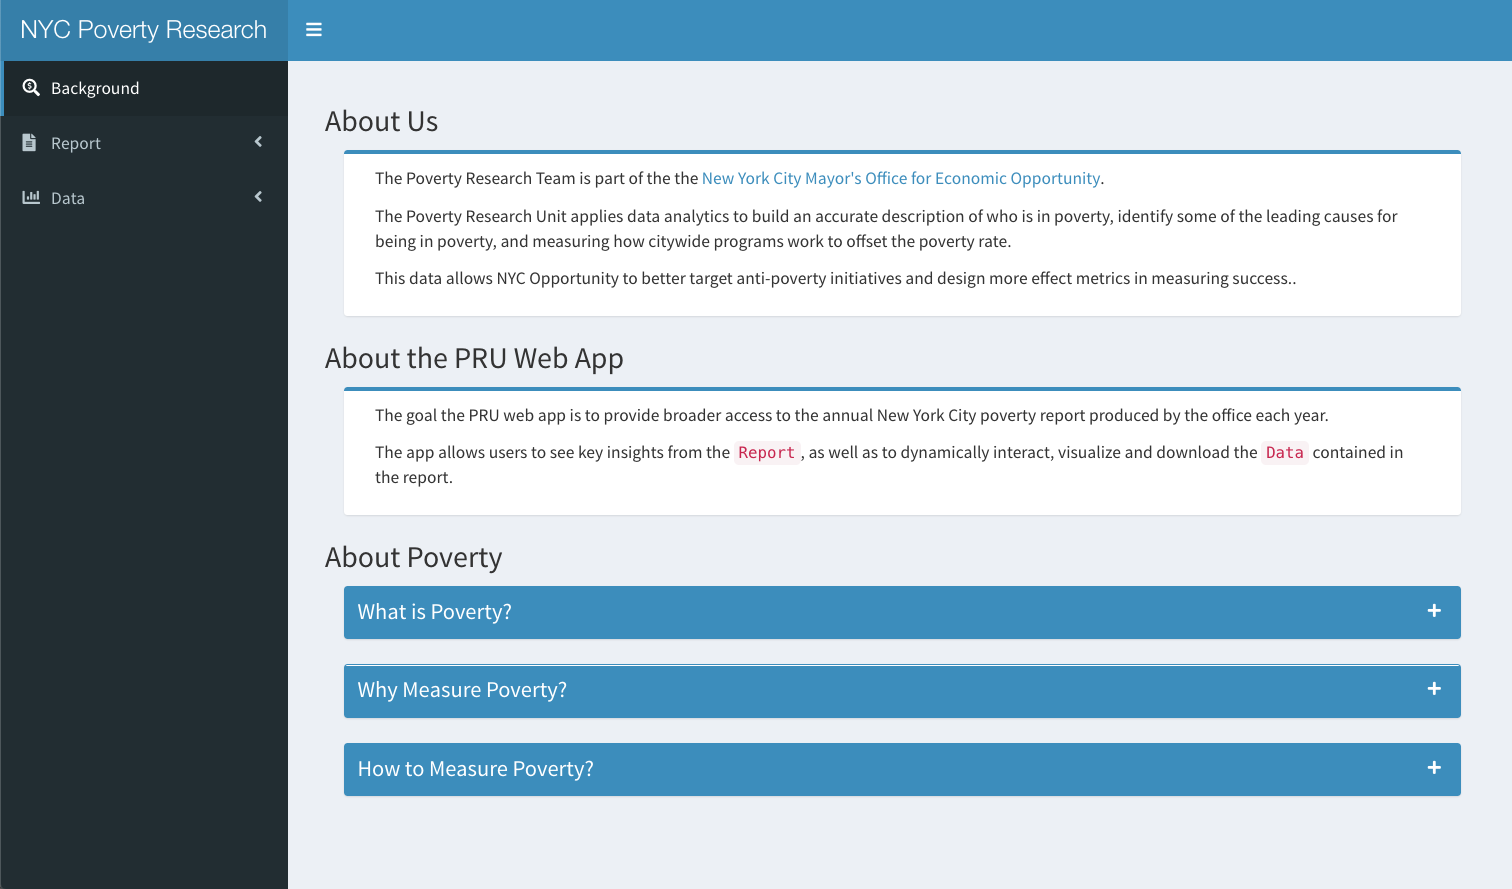
For the PRU Web App, the basic interface when you arrive on the page looks like this:
The ui is built using shinydashboard, whose basic structure follows this pattern:
dashboardPage(
  dashboardHeader(),
  dashboardSidebar(),
  dashboardBody()
)
The basic layout of the ui for the PRU App is:
dashboardPage()
    dashboardHeader()
        app title
    dashboardSidebar()
        Poverty
        Report
        Data
    dashboardBody()
        Poverty
            Poverty About
        Report
            Poverty About
            Key Findings
            Measuring Poverty
            Appendices
        Data
            Spotlight
            Detail
            Comparison
            Map
The dashboardBody() is where all of the visual content and text is specified, with the key elements being fluidRow() and box(). More info on how to use these elements can be found here.
Note on Text
One thing to note is that all of the text from the PRU report is included directly in box() elements using the p() tag. This makes it easy to see where things are but creates very long lines that are not terribnly legible. A better method could be to convert the report to Markdown which can then be saved as individual files and accessed using the includeMarkdown functionality of the markdown library. Examples and info here.
Also a minimal example is included in the PRU Web App in the Report: Appendices section:
includeMarkdown('markdown/appendices.md')If you are new to using Markdown there are many tools that help you visualize the text while typing, such as VS Code and Typora.
The server function contains the instructions that your computer needs to build your app. This allows content to be dynamic.
The PRU App
The Poverty Research Unit applies data analytics to build an accurate description of who is in poverty, identify some of the leading causes for being in poverty, and measuring how citywide programs work to offset the poverty rate. This data allows NYC Opportunity to better target anti-poverty initiatives and design more effect metrics in measuring success.
The Poverty Research team produces the annual official poverty measure of the New York City government, the NYCgov Measure, that provides a more nuanced understanding of poverty in New York City than the federal rate allows. Our poverty research also informs the City's understanding of inequality and the effectiveness of policies in addressing disparities among local residents and communities.


