Build the container image with
mvn clean installand run the container using (either docker, podman):
docker run -p 8080:8080 --env STORAGE_FORMAT=CSV \
    --env MODEL_NAME=example \
    --env KSERVE_TARGET=localhost \
    trustyai/trustyai-service:1.0.0-SNAPSHOT -d
There is also a compose configuration which install the service, Prometheus and Grafana.
To run it, use:
docker-compose compose.yaml up -d # or podman-composeIn order to setup MinIO for local development, first install the MinIO client mc.
Run the MinIO server with
docker run \
   -p 9000:9000 \
   -p 9090:9090 \
   --name minio \
   -v ~/minio/trustyai-service/data:/data \
   -e "MINIO_ROOT_USER=minioadmin" \
   -e "MINIO_ROOT_PASSWORD=minioadmin" \
   quay.io/minio/minio server /data --console-address ":9090"
Connect to MinIO using:
mc alias set local http://127.0.0.1:9000 minioadmin minioadminNow create a bucket, for instance, inputs:
mc mb local/inputsCopy a file into the bucket:
mc cp data/income-biased-inputs.csv local/inputsOptionally, check the file was successfully copies:
mc ls local/inputsWhich should produce:
[2023-02-09 23:01:49 GMT] 68KiB income-biased-inputs.csv
The OpenAPI schema can be displayed using
curl -X GET --location "http://localhost:8080/q/openapi"Each of the metrics default bounds can be overriden with the corresponding environment variable, e.g.
SPD_THRESHOLD_LOWERSPD_THRESHOLD_UPPER- etc
Get statistical parity difference at /metrics/spd
curl -X POST --location "http://localhost:8080/metrics/spd" \
    -H "Content-Type: application/json" \
    -d "{
          \"protectedAttribute\": \"gender\",
          \"favorableOutcome\": 1,
          \"outcomeName\": \"income\",
          \"privilegedAttribute\": 1,
          \"unprivilegedAttribute\": 0
        }"
Returns:
HTTP/1.1 200 OK
content-length: 199
Content-Type: application/json;charset=UTF-8

{
  "type": "metric",
  "name": "SPD",
  "value": -0.2531969309462916,
  "timestamp": 1675850601910,
  "thresholds": {
    "lowerBound": -0.1,
    "upperBound": 0.1,
    "outsideBounds": true
  },
  "id": "ec435fc6-d037-493b-9efc-4931138d7656"
}curl -X POST --location "http://localhost:8080/metrics/dir" \
-H "Content-Type: application/json" \
-d "{
\"protectedAttribute\": \"gender\",
\"favorableOutcome\": 1,
\"outcomeName\": \"income\",
\"privilegedAttribute\": 1,
\"unprivilegedAttribute\": 0
}"HTTP/1.1 200 OK
content-length: 197
Content-Type: application/json;charset=UTF-8
{
"type": "metric",
"name": "DIR",
"value": 0.3333333333333333,
"id": "15f87802-30ae-424b-9937-1589489d6b4b",
"timestamp": 1675850775317,
"thresholds": {
"lowerBound": 0.8,
"upperBound": 1.2,
"outsideBounds": true
}
}In order to generate period measurements for a certain metric, you can send a request to the /metrics/$METRIC/schedule.
Looking at the SPD example above if we want the metric to be calculated periodically we would request:
curl -X POST --location "http://localhost:8080/metrics/spd/schedule" \
    -H "Content-Type: application/json" \
    -d "{
          \"protectedAttribute\": \"gender\",
          \"favorableOutcome\": 1,
          \"outcomeName\": \"income\",
          \"privilegedAttribute\": 1,
          \"unprivilegedAttribute\": 0
        }"
We would get a response with the schedule id for this specific query:
HTTP/1.1 200 OK
content-length: 78
Content-Type: application/json;charset=UTF-8

{
  "requestId": "3281c891-e2a5-4eb3-b05d-7f3831acbb56",
  "timestamp": 1676031994868
}
The metrics will now be pushed to Prometheus with the runtime provided METRICS_SCHEDULE configuration (e.g. METRICS_SCHEDULE=10s)
which follows the Quarkus syntax.
To stop the periodic calculation you can issue a request to the /metrics/$METRIC/unschedule endpoint, with the id of periodic task we want to cancel.
For instance:
curl -X POST --location "http://{{host}}:8080/metrics/spd/unschedule" \
    -H "Content-Type: application/json" \
    -d "{
          \"requestId\": \"3281c891-e2a5-4eb3-b05d-7f3831acbb56\"
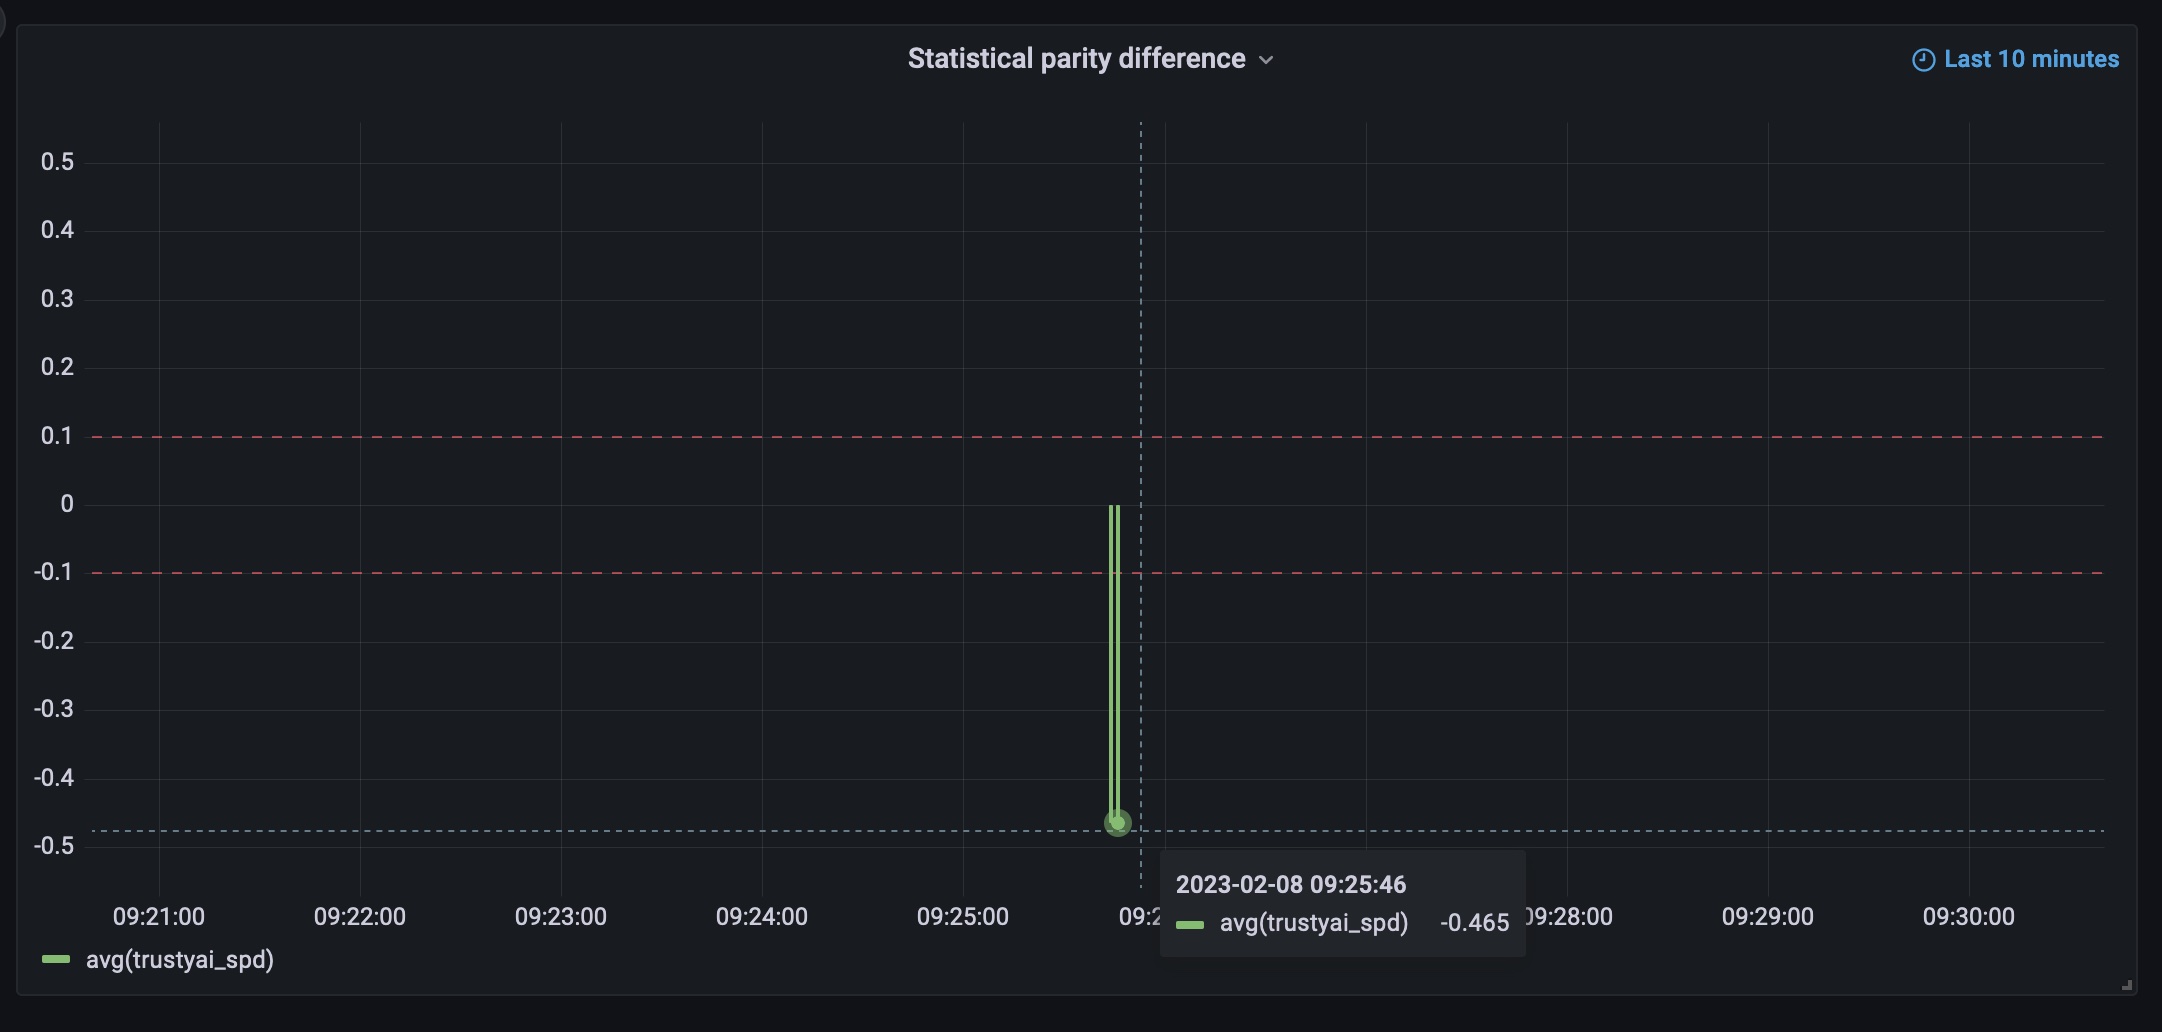
}"Whenever a metric endpoint is called with a HTTP request, the service also updates the corresponding Prometheus metric.
The metrics are published at /q/metrics and can be consumed directly with Prometheus.
The examples also include a Grafana dashboard to visualize them.
Each Prometheus metric is scoped to a specific model and attributes using tags.
For instance, for the SPD metric request above we would have a metric:
trustyai_spd{instance="trustyai:8080",
    job="trustyai-service",
    model="example",
    outcome="income",
    protected="gender"}
Data source extend the base AbstractDataReader which has the responsibility
of converting any type of data source (flat file on PVC, S3, database, etc) into a TrustyAI Dataframe.
The type of datasource is passed with the environment variable STORAGE_FORMAT.
For demo purposes we abstract the data source to STORAGE_FORMAT=RANDOM_TEST
which generates in memory new data points for each request.
An explainer can be linked to the service using the enviroment
variables KSERVE_TARGET and MODEL_NAME.
These will be used by the service's gRPC client which can natively
query KServe and ModelMesh using that endpoint.
To deploy in Kubernetes or OpenShift, the connection information can be passed in the manifest as enviroment variables:
apiVersion: apps/v1
kind: Deployment
spec:
  template:
    spec:
      containers:
        - env:
            - name: KUBERNETES_NAMESPACE
              valueFrom:
                fieldRef:
                  fieldPath: metadata.namespace
            - name: KSERVE_TARGET
              value: localhost
            - name: STORAGE_FORMAT
              value: RANDOM_TEST
            - name: MODEL_NAME
              value: example
          image: trustyai/trustyai-service:1.0.0-SNAPSHOT
          name: trustyai-service
          ports:
            - containerPort: 8080
              name: http
              protocol: TCP