This extension allows you to convert your ASP answer sets into various visualizations. The available visualizations are:
- Graph - a graph representation of the answer set
- Table - a table representation of the answer set
- Matrix - a matrix representation of the answer set
- Image - a image representation of the answer set
- Gif - a gif representation of the image answer set
The visualizations have some customizations available, such as the ability to change the color of the nodes and edges, the theme, the color of the table, and the ability to choose to use images or colors for AS visualization.
In order to use this extension, you need to have the following installed:
- DLV Solver
- A Chromium-based browser (Google Chrome, Microsoft Edge, etc.)
- FFMPEG (optional for GIF creation)
At the start of the extension, you will be required to create a folder for the extension's files. This folder will be used to store the configuration files to run the extension with the same setting every time.
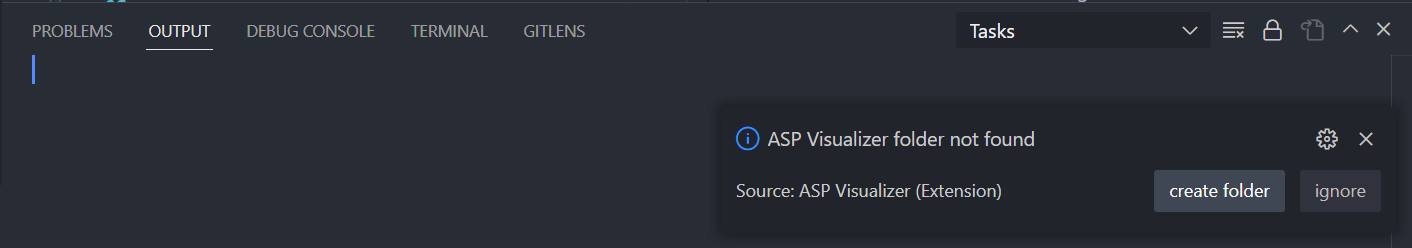
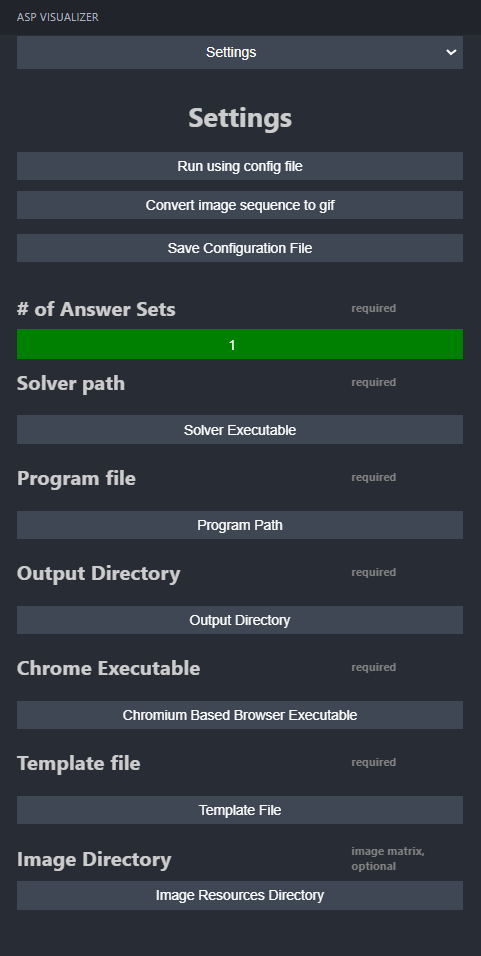
After creating the folder for the extension's files, the extension will look like this:
In order to allow the gif creation you need to set execute permission on gif.sh script contained in the extension folder (the one that the extension creates when you start it), the execute permission can be setted in this way:
- chmod +x gif.sh
All the mandatory settings are marked with the required keyword. In particular, you need to set the following:
-
# of Answer Sets: the number of answer sets to be visualized
-
Solver Path: the path to the DLV solver based on the operating system you are using.
-
Program File: the path to the ASP program file that contains the rules and facts to be visualized
-
Output directory: the path to the folder where the visualizations will be saved
-
Chrome Executable: the path to the Chrome executable file based on the Chromium-based browser you are using.
-
Template file: the path to the file containing the mapping for the execution to be runned. It's suggested to generate the file using the extension appropriate menu.
- The first dropdown menu allows you to choose the type of visualization you want to generate.
- Clicking Save template file will ask you a name for the json file that will be saved in the extension's folder.
- You can select this file in the dropdown menu to use it as a template for the execution.
-
Image Directory: the path to the folder containing the images to be used in the image visualization. It's suggested to name the files in the folder with the same name of the node in the ASP program in order to have an easier configuration.
After all of this you are ready to run the extension with the template file you just created.
The extension is capable of generating various visualizations, each with its own features.
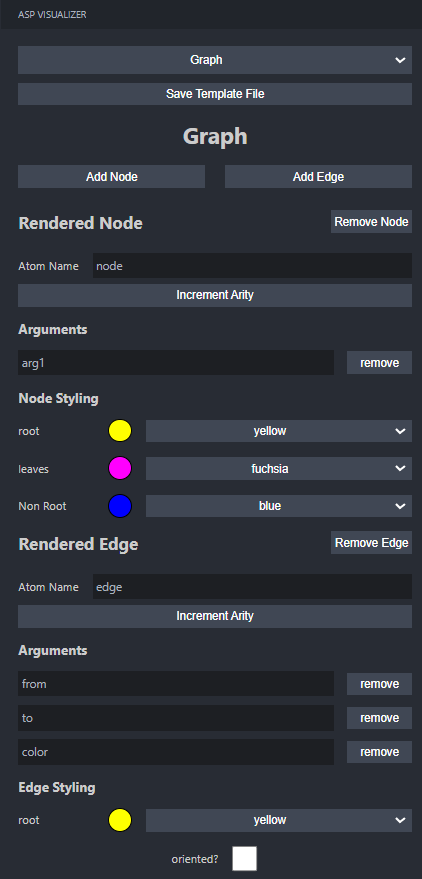
In the Graph menu it's possible to Add or Remove nodes and edges from the visualization.
It's is possible to set the name of the atom and, for each atom, add or remove arguments.
For each node, it's possible to style it with different color for:
- Root node
- Leaves node
- Non root node
For each edge, you can set the atom name and the attributes for each edge. It's possible to setup the color of the edges and to choose if the edge is oriented or not.
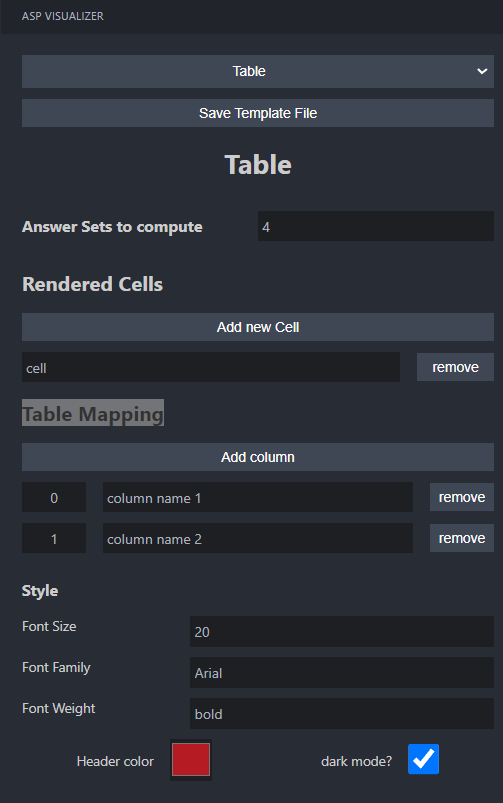
In the Table menu it's possible to Add or Remove cells from the visualization. It's mandatory to map the cells to the atoms in the ASP program.
In the Table Mapping section, it's possible to setup the columns of the table and set a name for each coulmn.
It's possible to style the table with:
- The color of the table's header
- The font size
- The font family
- The font weight
- Choose to use dark mode or not
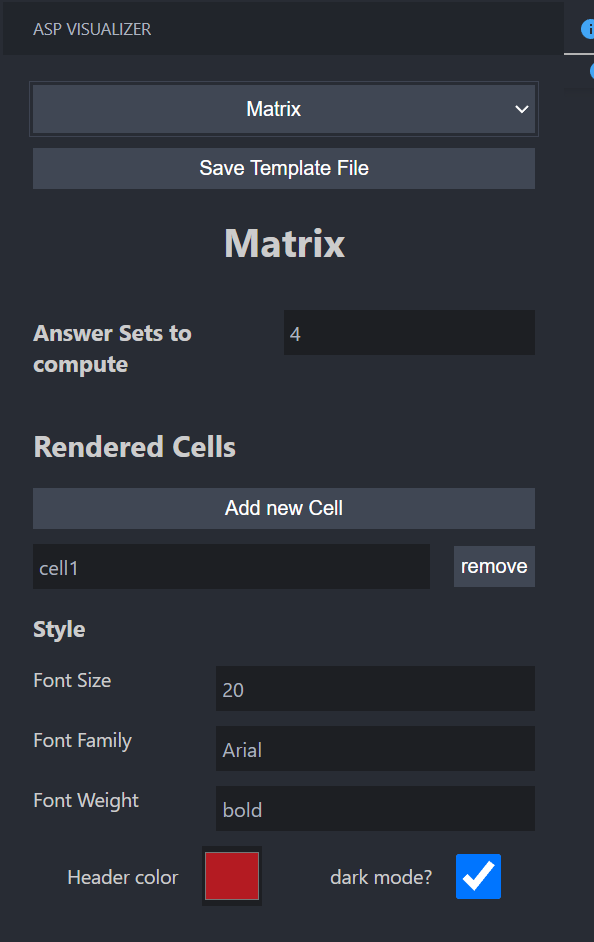
In the Matrix menu it's possible to Add or Remove cells from the visualization. It's mandatory to map the cells to the atoms in the ASP program.
Here is added the possiblity to choose the number of answer sets to compute.
It's possible to style the matrix with:
- The color of the table's header
- The font size
- The font family
- The font weight
- Choose to use dark mode or not
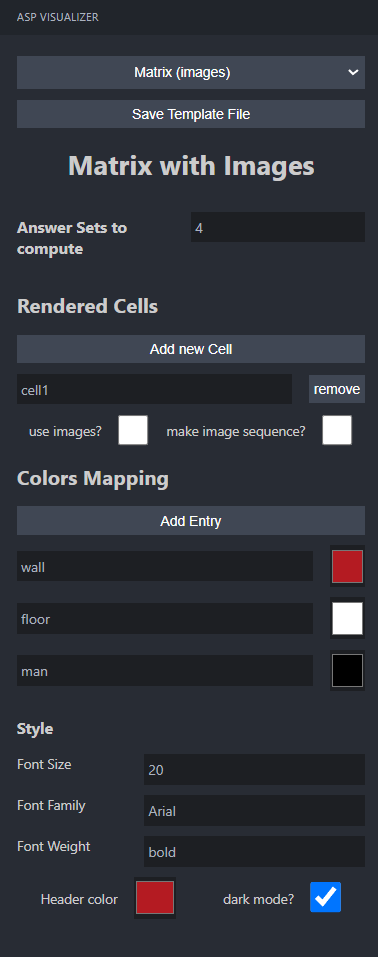
In the Matrix Image menu it's possible to Add or Remove cells from the visualization. It's mandatory to map the cells to the atoms in the ASP program.
Here is added the possiblity to choose the number of answer sets to compute.
It's possible to choose to use images or colors for the visualization.
If you choose to use images, you need to set the image directory in the initial configuration. Plus, you need to set the image name for each attribute.
If you choose to use colors, you need to set the color for each attribute.
It's possible to style the matrix changing:
- The color of the table's header
- The font size
- The font family
- The font weight
- Choose to use dark mode or not
It's possible to check the Make image sequence checkbox to prepare the files for the gif creation.
For advanced usages, instead of using the UI you can create a JSON template to achieve a fine grained personalization.
{
    "template": "graph",
    "layout": "string",
    "nodes": [
        {
            "atom": {
                "name": "string",
                "variables": ["string"]
            },
            "style": {
                "color": {
                    "node_type": {
                        "if": [
                            {"variable": "string", "condition": "string" | number, "then": "string"}
                        ],
                        "else": "string"
                    },
                }
            }
        },
    ],
    "edges": [
        {
            "atom": {
                "name": "string",
                "variables": ["string"]
            },
            "style": {
                "color": {
                    "if": [
                        {"variable": "string", "condition": "string" | number, "then": "string"},
                    ],
                    "else": "string"
                },
                "oriented": boolean
            }
        },
    ]
}-
layout:
- Specifies the layout of the nodes in the output image
- Can be dagre or avsdf
- Required: True
-
atom.name:
- Name of the atom that we want to map as a nodes/edge of the graph
- Pattern: "^[A-Za-z][A-Za-z0-9_]{0,19}$"
- Required: False, if omitted the atom node will be mapped by default
-
nodes.atom.variables:
- Represents the predicates of the atom
- Must contain at least label
- Can contain color to specify the color of the node
- Other user defined parameters can be referred inside IF condition operators
- Example: node(name,Y,color), we can map X as the node label using variables = ['label', 'param1','color'].
- Required: False, if omitted ['label'] is used
-
style:
- Required: False, the default style is used
-
node_type:
- Can be root, non-root, leaf, all and specify what type of node we want to target with this specific style
-
edges.atom.variables:
- Represents the predicates of the atom
- Must contain at least from and to
- Can contain color to specify the color of the edge
- Can contain weight to specify the weight of the edge
- Other user defined parameters can be referred inside IF condition operators
- Required: False, if omitted ['from', 'to'] is used
-
oriented:
- True if the graph is oriented, false otherwise
- Required: False, if omitted the default value is True
Is it possible to specify colors of root, leaves and non-root by using simple if conditions. Only the first satisfied condition is applied, if none of the if conditions are met then the else is executed.
| IF Condition operator | Description and example |
|---|---|
matches: foo |
True if the fact variable is exactly foo (case sensitive equal comparator) |
imatches: foo |
True if the fact variable is FOO or foo (case insensitive equal comparator) |
contains: bar |
True if the fact variable contains bar, example: foobar (case sensitive) |
icontains: bar |
True if the fact variable contains bar or BAR, example: fooBAR (case insensitive) |
lt: 25 |
True if the fact variable is less than 25, example: 24 |
lte: 25 |
True if the fact variable is less than 25 or equal to 25, example: 25 or 24 |
gt: 50 |
True if the fact variable is greater than 50, example: 51 |
gte: 50 |
True if the fact variable is greater than 50 or equal to 50, example: 51 or 52 |
{
"template": "graph",
"layout": "dagre",
"nodes": [
{
"atom": {
"name": "inNode",
"variables": ["label", "weight"]
},
"style": {
"color": {
"root": {
"if": [
{"variable": "label", "matches": "a", "then": "green"}
],
"else": "orange"
},
"nonRoot": {
"if": [
{"variable": "weight", "lte": 5, "then": "yellow"},
{"variable": "weight", "gt": 6, "then": "red"}
],
"else": "orange"
}
}
}
},
{
"atom": {
"name": "outNode",
"variables": ["label"]
},
"style": {
"color": {
"all": "grey"
}
}
}
],
"edges": [
{
"atom": {
"name": "inEdge",
"variables": ["from", "to", "weight","my_predicate"]
},
"style": {
"color": {
"if": [
{"variable": "weight", "gte": 6, "then": "red"},
{"variable": "weight", "gte": 4, "then": "orange"},
{"variable": "weight", "gte": 2, "then": "yellow"},
{"variable": "my_predicate", "icontains": "example", "then": "purple"}
],
"else": "green"
},
"oriented": true
}
},
{
"atom": {
"name": "outEdge",
"variables": ["from", "to", "color"]
}
}
]
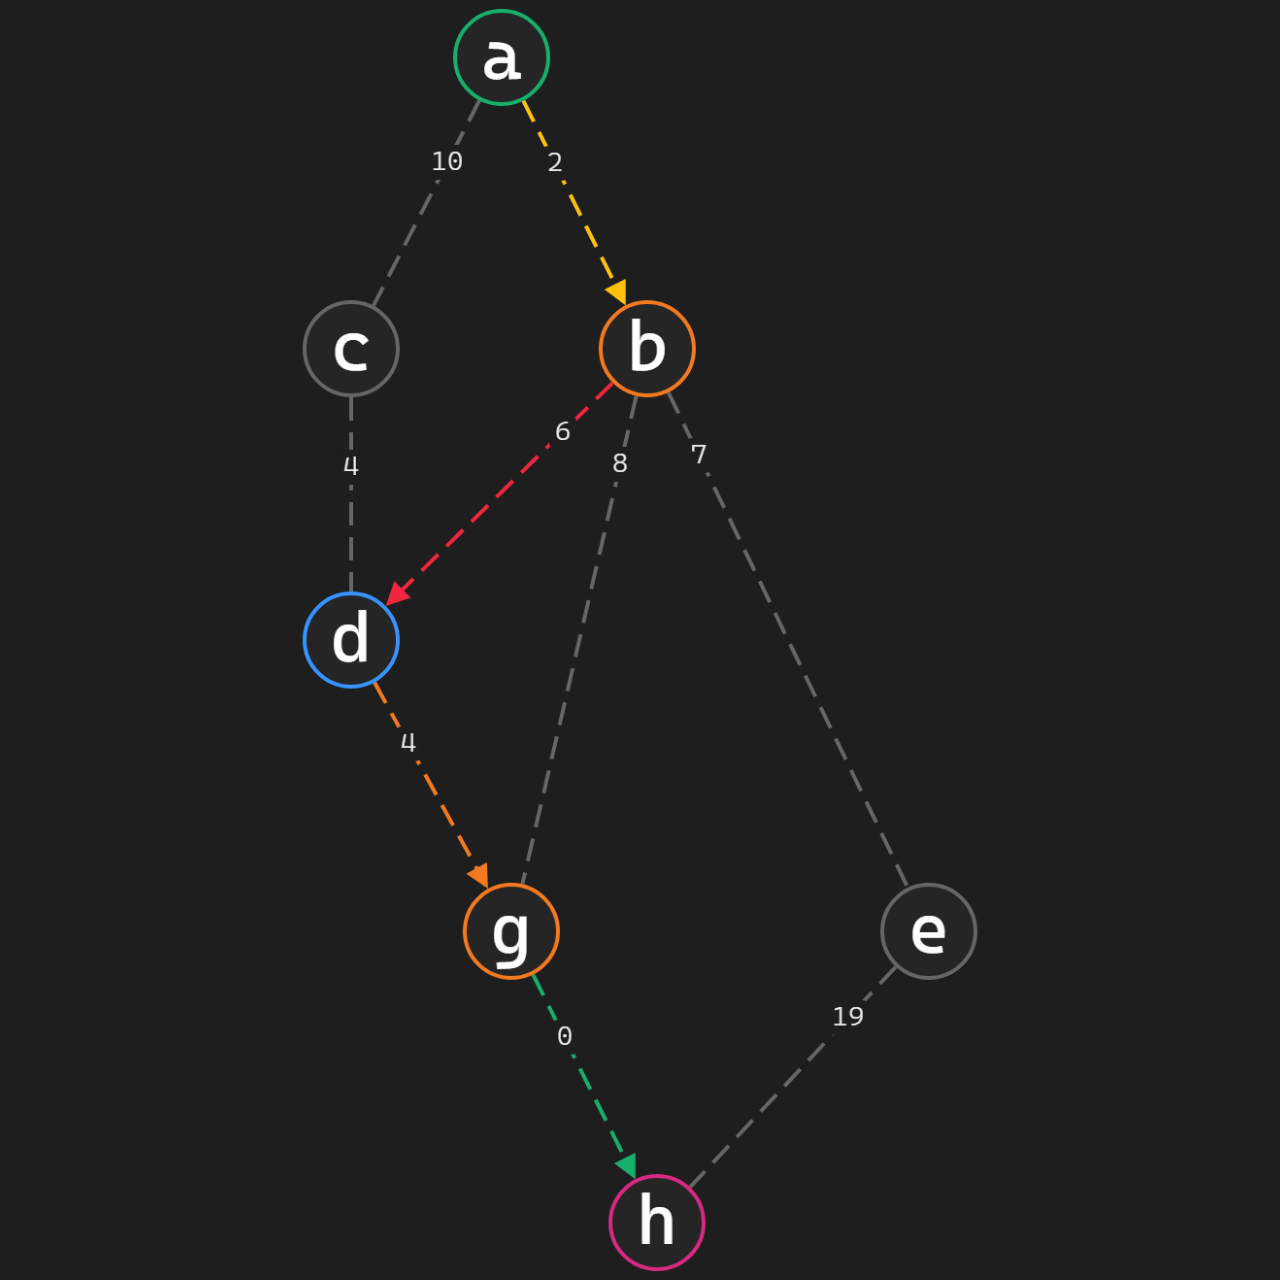
}This template can be used to visualize this answer set
inNode(a).
inNode(b).
inNode(g).
inNode(d).
inNode(h).
inEdge(a,b,2).
inEdge(b,d,6).
inEdge(d,g,4).
inEdge(g,h,0).
outNode(c).
outNode(e).
outEdge(b,e,7).
outEdge(a,c,10).
outEdge(c,d,4).
outEdge(e,h,19).
outEdge(b,g,8).
Resulting in this output image
{
    "template" : "matrix",
    "cell" : ["string"],
    "maxNumOfAnswerSetToConvert" : number,
    "style": {
        "header_color": "string",
        "header_font_size": number,
        "header_font_family": "string",
        "header_font_weight": "string",
        "dark_mode": boolean
    }
}-
cell:
- Array of atom names that will be mapped into a matrix, every atom will be mapped in a different matrix. All the mapped atoms must be of arity 3, having fields row, column, value.
- Required: True
-
maxNumOfAnswerSetToConvert:
- Number of maximum answer set mapped into an image
- Required: True
-
style.header_color:
- Color of the matrix header
- Required: False
-
style.header_font_size:
- Font size of the matrix header
- Required: False
-
style.header_font_family:
- Font family of the matrix header
- Required: False
-
style.header_font_weight:
- Font weight of the matrix header
- Required: False
-
style.dark_mode:
- True if we want dark theme, false otherwise
- Required: True
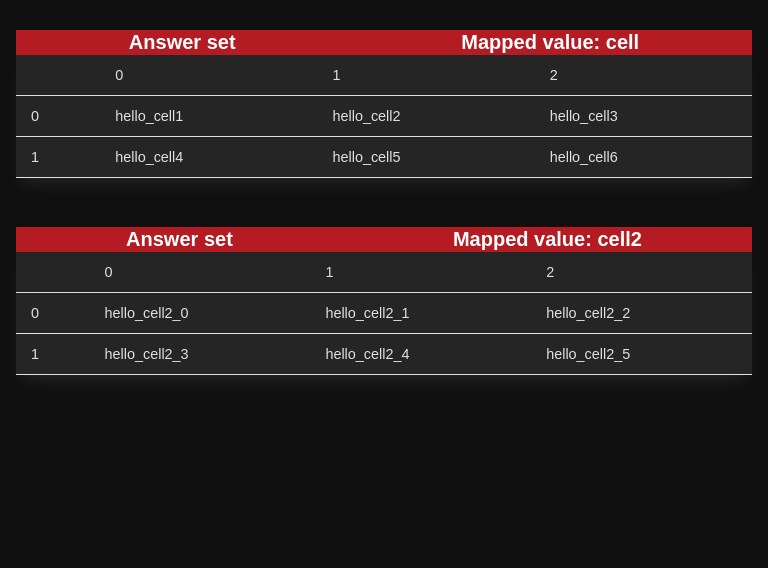
{
    "template" : "matrix",
    "cell" : ["cell", "cell2"],
    "maxNumOfAnswerSetToConvert" : 4,
    "style": {
        "header_color": "#b41b22",
        "header_font_size": 20,
        "header_font_family": "Arial",
        "header_font_weight": "bold",
        "dark_mode": true
      }
}
We can use this template to map the following answer set
cell(0,0, hello_cell1).
cell(0,1,hello_cell2).
cell(0,2,hello_cell3).
cell(1,0,hello_cell4).
cell(1,1,hello_cell5).
cell(1,2,hello_cell6).
cell2(0,0,hello_cell2_0).
cell2(0,1,hello_cell2_1).
cell2(0,2,hello_cell2_2).
cell2(1,0,hello_cell2_3).
cell2(1,1,hello_cell2_4).
cell2(1,2,hello_cell2_5).
Resulting in the following image
{
    "template": "table",
    "cell": ["string"],
    "maxNumOfAnswerSetToConvert": number,
    "style": {
        "header_color": "string",
        "header_font_size": number,
        "header_font_family": "string",
        "header_font_weight": "string",
        "dark_mode": boolean
    },
    "table_field_mapping": {
        "0": "string",
        "1": "string",
        ...
    }
}-
cell:
- Array of atom names that will be mapped into a table, every atom will be mapped in a different table
- Required: True
-
maxNumOfAnswerSetToConvert:
- Number of maximum answer set mapped into an image
- Required: True
-
style.header_color:
- Color of the table header
- Required: False
-
style.header_font_size:
- Font size of the table header
- Required: False
-
style.header_font_family:
- Font family of the table header
- Required: False
-
style.header_font_weight:
- Font weight of the table header
- Required: False
-
style.dark_mode:
- True if we want dark theme, false otherwise
- Required: True
-
table_field_mapping:
- Dictionary of indexes and corresponding names that we want to give to each column
- Required: True (but could be empty)
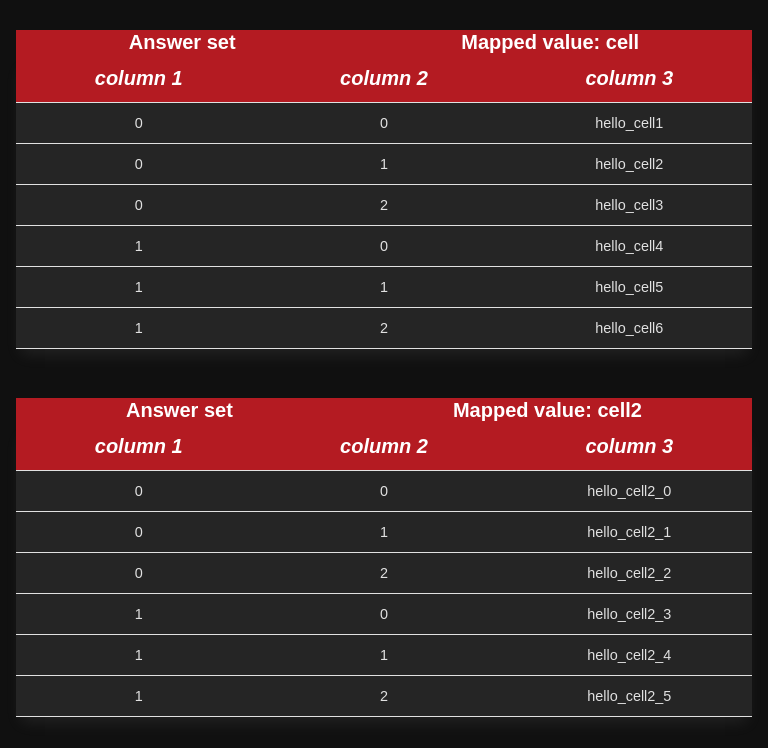
{
    "template": "table",
    "maxNumOfAnswerSetToConvert": 4,
    "cell": [
        "cell",
        "cell2"
    ],
    "style": {
        "header_color": "#b41b22",
        "header_font_size": 20,
        "header_font_family": "Arial",
        "header_font_weight": "bold",
        "dark_mode": true
    },
    "table_field_mapping": {
        "0": "column 1",
        "1": "column 2",
        "2": "column 3"
    }
}
We can use this template to map the following answer set
cell(0,0, hello_cell1).
cell(0,1,hello_cell2).
cell(0,2,hello_cell3).
cell(1,0,hello_cell4).
cell(1,1,hello_cell5).
cell(1,2,hello_cell6).
cell2(0,0,hello_cell2_0).
cell2(0,1,hello_cell2_1).
cell2(0,2,hello_cell2_2).
cell2(1,0,hello_cell2_3).
cell2(1,1,hello_cell2_4).
cell2(1,2,hello_cell2_5).
Resulting in the following image
{
    "template": "matrix_images | gif",
    "maxNumOfAnswerSetToConvert": number,
    "cell": [
        "string"
    ],
    "style": {
        "header_color": "string",
        "header_font_size": number,
        "header_font_family": "string",
        "header_font_weight": "string",
        "dark_mode": boolean
    },
    "useImages": boolean,
    "colors_binding": {
        "string": "string",
    },
    "images_binding": {
        "string": "string",
    }
}-
cell:
- Array of atom names that will be mapped into an image, every atom will be mapped in a different image. All mapped atoms must be of arity 3 having row, column, value order if matrix_images is used, otherwise if gif is used then they must be of arity 4 having on fourth place also the "time" to build the image sequence, like time 1, 2 and so on.
- Required: True
-
maxNumOfAnswerSetToConvert:
- Number of maximum answer set mapped into an image
- Required: True
-
style.header_color:
- Color of the image header
- Required: False
-
style.header_font_size:
- Font size of the image header
- Required: False
-
style.header_font_family:
- Font family of the image header
- Required: False
-
style.header_font_weight:
- Font weight of the image header
- Required: False
-
style.dark_mode:
- True if we want dark theme, false otherwise
- Required: True
-
useImages:
- If true, colors_binding is skipped and images_binding is used
- Required: False, colors_binding will be used by default
-
color_binding:
- If useImages is False, we can map an atom value to a color, so, if we have cell(X,Y,wall), we can specify "wall": "#FFFFFF" to visualize all mapped atoms that contains wall with the specified color
- Required: False if useImages is True
-
images_binding:
- If useImages is True, we can map an atom value to an image, so, if we have cell(X,Y,wall), we can specify "wall": "wall.png" to visualize all mapped atoms that contains wall as the specified image. NB: the images directory path is given inside the config file of the extension.
- Required: False if useImages is False
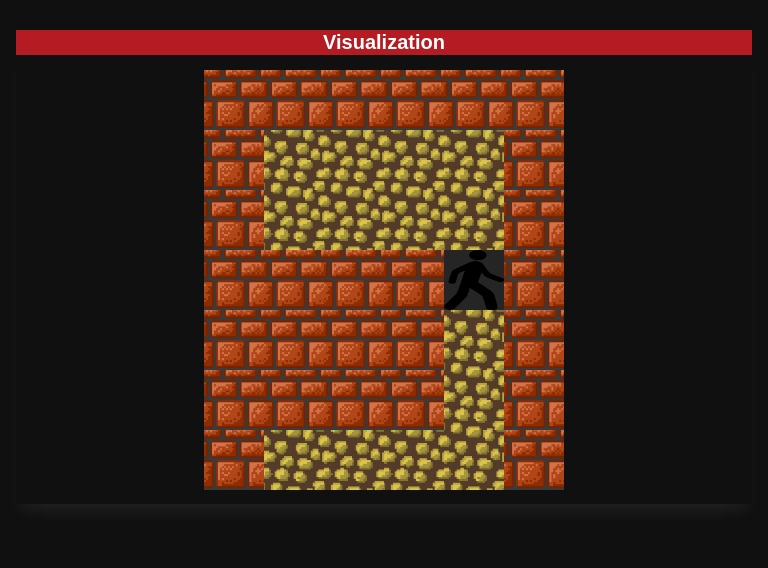
{
    "template": "matrix_images",
    "maxNumOfAnswerSetToConvert": 4,
    "cell": [
        "cell"
    ],
    "style": {
        "header_color": "#b41b22",
        "header_font_size": 20,
        "header_font_family": "Arial",
        "header_font_weight": "bold",
        "dark_mode": true
    },
    "useImages": true,
    "images_binding": {
        "wall": "wall.png",
        "floor": "floor.png",
        "man": "hero.png"
    }
}
We can use this template to map the following answer set
cell(0,0,wall).
cell(0,1,wall).
cell(0,2,wall).
cell(0,3,wall).
cell(0,4,wall).
cell(0,5,wall).
cell(1,0,wall).
cell(1,1,floor).
cell(1,2,floor).
cell(1,3,floor).
cell(1,4,floor).
cell(1,5,wall).
cell(2,0,wall).
cell(2,1,floor).
cell(2,2,floor).
cell(2,3,floor).
cell(2,4,floor).
cell(2,5,wall).
cell(3,0,wall).
cell(3,1,wall).
cell(3,2,wall).
cell(3,3,wall).
cell(3,4,man).
cell(3,5,wall).
cell(4,0,wall).
cell(4,1,wall).
cell(4,2,wall).
cell(4,3,wall).
cell(4,4,floor).
cell(4,5,wall).
cell(5,0,wall).
cell(5,1,wall).
cell(5,2,wall).
cell(5,3,wall).
cell(5,4,floor).
cell(5,5,wall).
cell(6,0,wall).
cell(6,1,floor).
cell(6,2,floor).
cell(6,3,floor).
cell(6,4,floor).
cell(6,5,wall).
Resulting in the following image
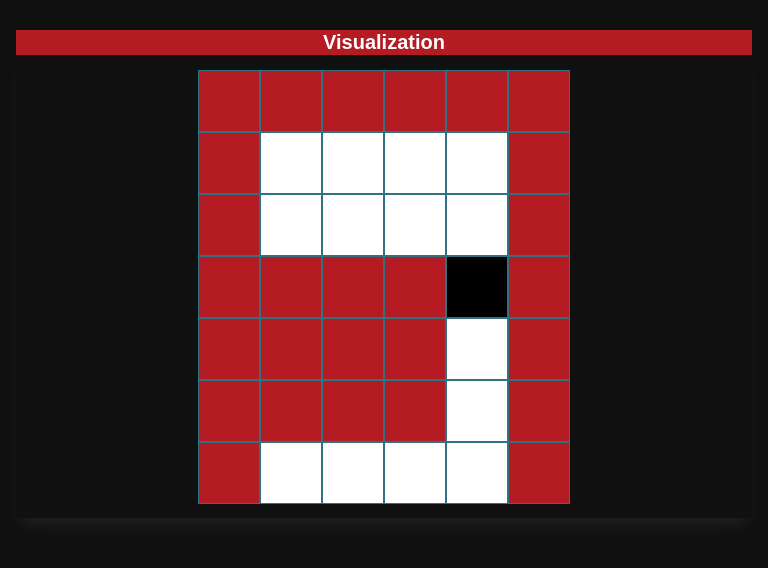
Instead, if we use
{
    "template": "matrix_images",
    "maxNumOfAnswerSetToConvert": 4,
    "cell": [
        "cell"
    ],
    "style": {
        "header_color": "#b41b22",
        "header_font_size": 20,
        "header_font_family": "Arial",
        "header_font_weight": "bold",
        "dark_mode": true
    },
    "useImages": false,
    "colors_binding": {
        "wall": "#b41b22",
        "floor": "#FFFFFF",
        "man": "#000000"
    },
}
We get the following output
 If we want to use GIFs we can build the template as follows:
{
    "template": "gif",
    "maxNumOfAnswerSetToConvert": 4,
    "cell": [
        "cell"
    ],
    "style": {
        "header_color": "#b41b22",
        "header_font_size": 20,
        "header_font_family": "Arial",
        "header_font_weight": "bold",
        "dark_mode": true
    },
    "useImages": false,
    "colors_binding": {
        "wall": "#b41b22",
        "floor": "#FFFFFF",
        "man": "#000000"
    },
}
And using this answer set:
cell(0,0,wall,1).
cell(0,1,wall,1).
cell(0,2,floor,1).
cell(0,3,floor,1).
cell(1,0,wall,1).
cell(1,1,man,1).
cell(1,2,floor,1).
cell(1,3,wall,1).
cell(2,0,wall,1).
cell(2,1,floor,1).
cell(2,2,floor,1).
cell(2,3,wall,1).
cell(0,0,wall,2).
cell(0,1,wall,2).
cell(0,2,floor,2).
cell(0,3,floor,2).
cell(1,0,wall,2).
cell(1,1,floor,2).
cell(1,2,man,2).
cell(1,3,wall,2).
cell(2,0,wall,2).
cell(2,1,floor,2).
cell(2,2,floor,2).
cell(2,3,wall,2).
cell(0,0,wall,3).
cell(0,1,wall,3).
cell(0,2,floor,3).
cell(0,3,floor,3).
cell(1,0,wall,3).
cell(1,1,floor,3).
cell(1,2,floor,3).
cell(1,3,wall,3).
cell(2,0,wall,3).
cell(2,1,floor,3).
cell(2,2,man,3).
cell(2,3,wall,3).
We will have this result
 The images binding can be used as explained before.