Weather_Graphs
This code plots temperature, radiation, wind, rain and humidity graphs using R and a map.
Getting started
- Install R;
- Install RStudio;
- Open the file server.R or ui.R using RStudio;
- Clink in "Run App" in RStudio. RStudio will download all necessary libraries and will open a UI.
Observation: you can load other files (with the same structure) of different dates. These particulars .Rda files are from March 21th to 24th of 2017.
Graphs
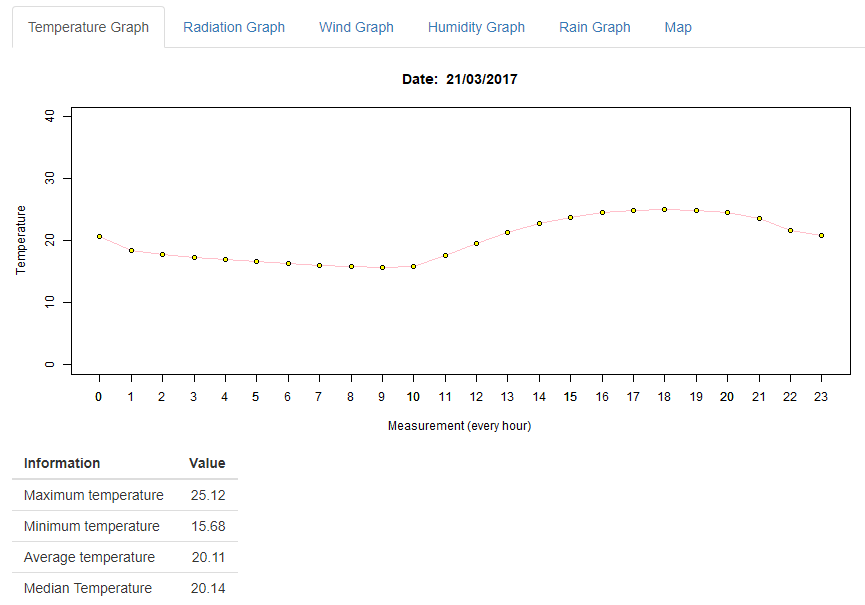
Temperature:
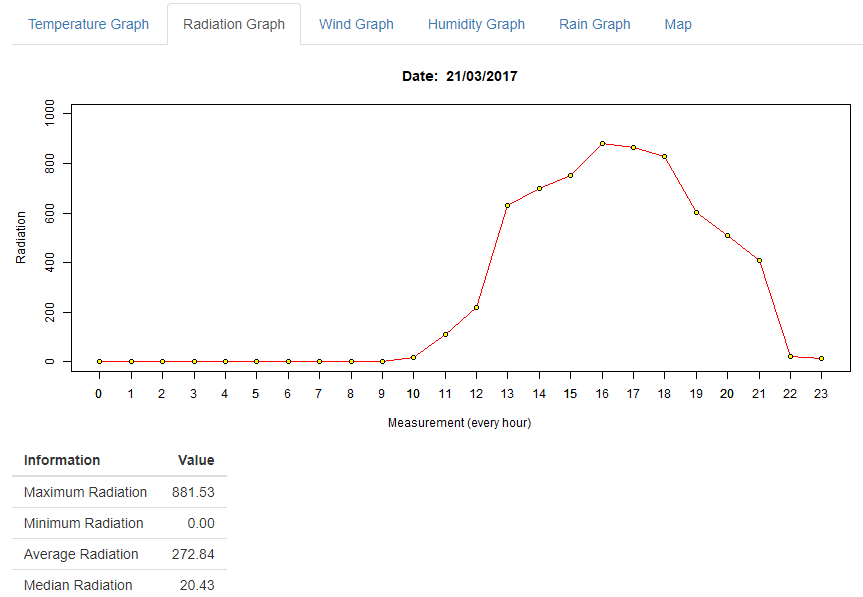
Radiation:
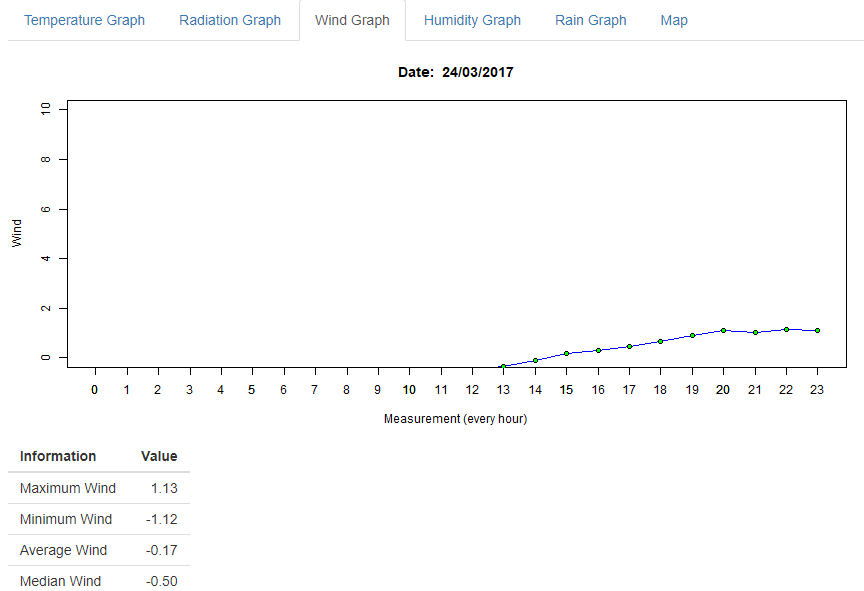
Wind:
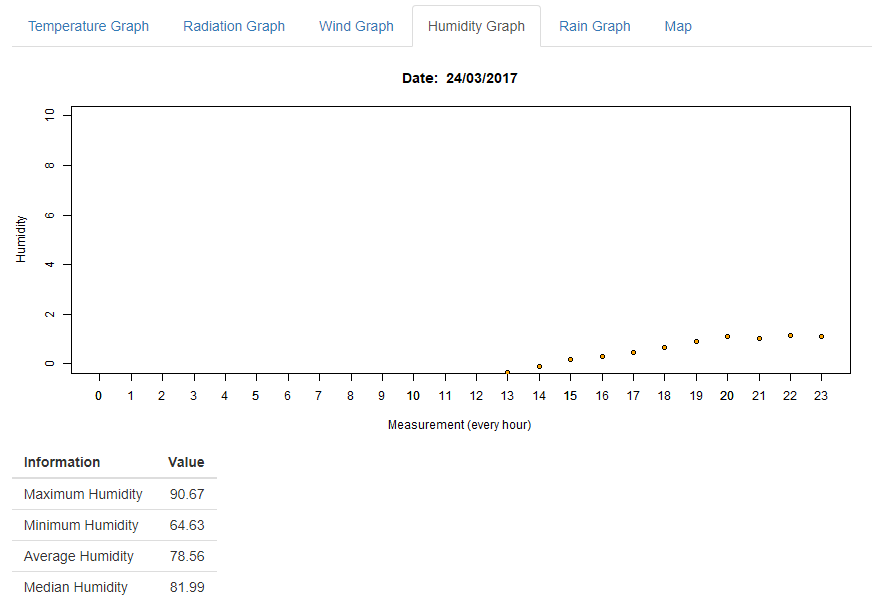
Humidity:
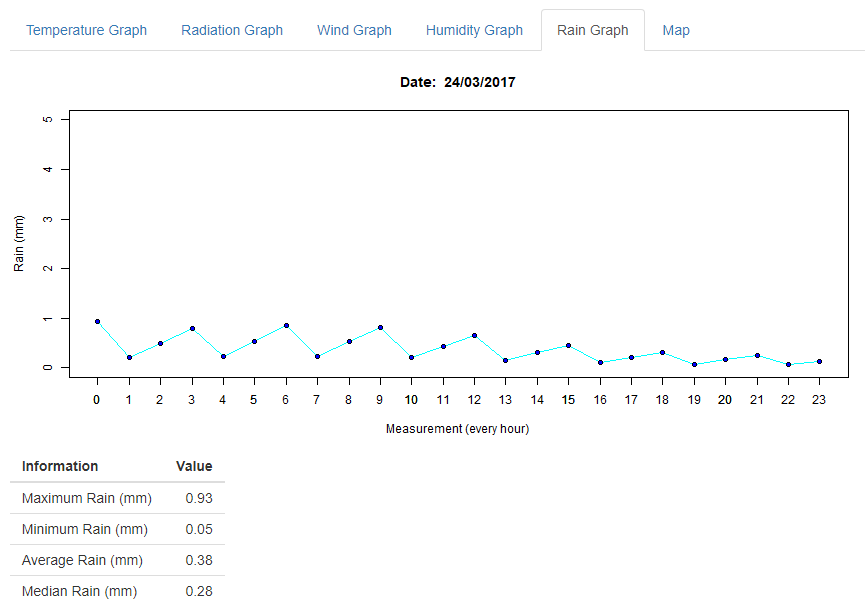
Rain:
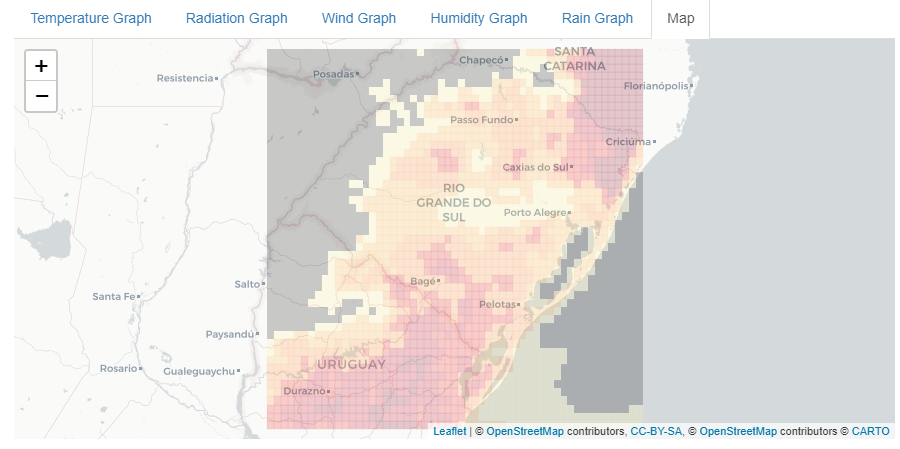
Map:
Observation: you can set the longitude and latitude of any place. This particular map is from Rio Grande do Sul, Brazil.
