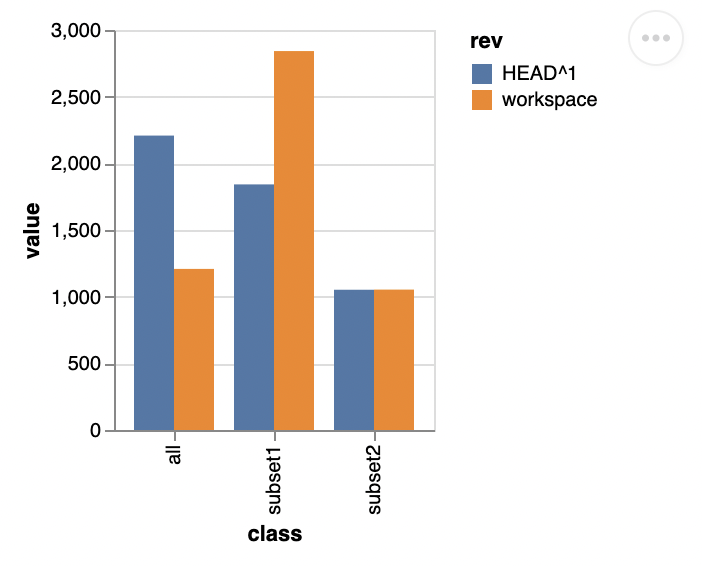
This example shows how to use DVC to create bar plots. The bar plots can be diff'ed between different data revitions to see how the distributions has changed.
This example is dependent on the latest master of the DVC-render (which is installed by the DVC package) since it needs the vega-lite xOffset parameter, this was added in vega-lite release 5.2.0. DVC (by DVC-render) bumped the version of vega-lite in this Pull Request. Therefore, create a virtual environment and install the latest master branch of DVC and DVC-render:
python -m venv venv
source venv/bin/activate
pip install git+https://github.com/iterative/dvc.git@main
pip install git+https://github.com/iterative/dvc-render.git@main
If you rather want to use an older release of DVC prior to the merge of the change, you can do so by using custom HTML templates. You can see that on the dvc-2.11.0-and-before branch.
To create a side-by-side bar plot, run:
dvc plots diff HEAD~3The diff'ed plots look like this:

The plot of a single data commit looks like this:

The plot is definied in the vega-lite format in the file specified in the .dvc/plots/bar.json file.