![]()

![]()
FMskill is a python package for scoring MIKE FM models.
Read more about the vision and scope. Contribute with new ideas in the discussion, report an issue or browse the API documentation.
FMskill would like to be your companion during the different phases of a MIKE FM modelling workflow.
- Model setup - exploratory phase
- Model calibration
- Model validation and reporting - communicate your final results
From pypi:
> pip install fmskill
Or the development version:
> pip install https://github.com/DHI/fmskill/archive/main.zip
- Quick_and_dirty_compare.ipynb
- SW_DutchCoast.ipynb
- Multi_model_comparison.ipynb
- Multi_variable_comparison.ipynb
- Track_comparison.ipynb (including global wave model example)
- Spatial_skill.ipynb (satellite tracks, skill aggregated on spatial bins)
- NetCDF_ModelResult.ipynb
- Combine_comparers.ipynb
- DMI_observations.ipynb (download data from REST api)
- Altimetry_data.ipynb (download data from altimetry api)
- Define ModelResults
- Define Observations
- Connect Observations and ModelResults
- Extract ModelResults at Observation positions
- Do plotting, statistics, reporting using a Comparer
Read more about the workflow in the getting started guide.
Start by defining model results and observations:
>>> from fmskill.model import ModelResult
>>> from fmskill.observation import PointObservation, TrackObservation
>>> mr = ModelResult("HKZN_local_2017_DutchCoast.dfsu", name="HKZN_local", item=0)
>>> HKNA = PointObservation("HKNA_Hm0.dfs0", item=0, x=4.2420, y=52.6887, name="HKNA")
>>> EPL = PointObservation("eur_Hm0.dfs0", item=0, x=3.2760, y=51.9990, name="EPL")
>>> c2 = TrackObservation("Alti_c2_Dutch.dfs0", item=3, name="c2")
Then, connect observations and model results, and extract data at observation points:
>>> from fmskill import Connector
>>> con = Connector([HKNA, EPL, c2], mr)
>>> comparer = con.extract()
With the comparer, all sorts of skill assessments and plots can be made:
>>> comparer.skill().round(2)
               n  bias  rmse  urmse   mae    cc    si    r2
observation
HKNA         385 -0.20  0.35   0.29  0.25  0.97  0.09  0.99
EPL           66 -0.08  0.22   0.20  0.18  0.97  0.07  0.99
c2 113 -0.00 0.35 0.35 0.29 0.97 0.12 0.99con.plot_observation_positions(figsize=(7,7))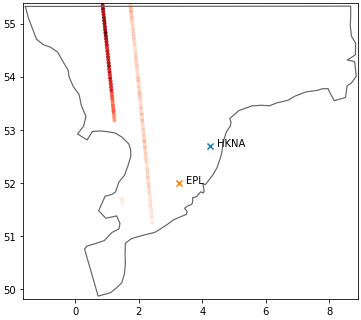
comparer.scatter()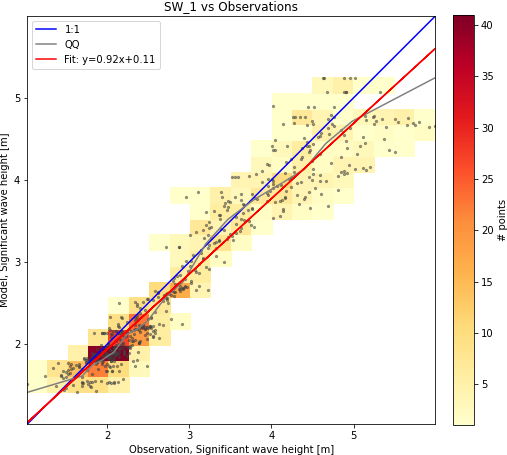
Timeseries plots can either be static and report-friendly (matplotlib) or interactive with zoom functionality (plotly).
comparer["HKNA"].plot_timeseries(width=1000, backend="plotly")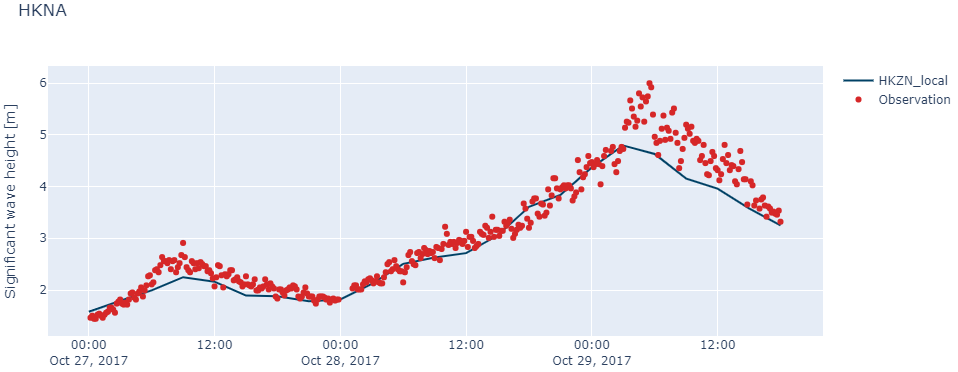
With a few lines of code, it will be possible to generate an automated report.
from fmskill.report import Reporter

rep = Reporter(mr)
rep.to_markdown()