Create the scatterplots used in NYTimes' Follower Factory.
Install dependencies.
pip install TwitterAPI # or pip install -r requirements.txt
Edit ff.py for your account. Go to https://apps.twitter.com/ to get your API keys.
Don't forget to fill in your screen name (or someone else's).
CONSUMER_KEY = ''
CONSUMER_SECRET = ''
ACCESS_TOKEN = ''
ACCESS_TOKEN_SECRET = ''

SCREEN_NAME = 'eiaine'
Run!
python ff.py
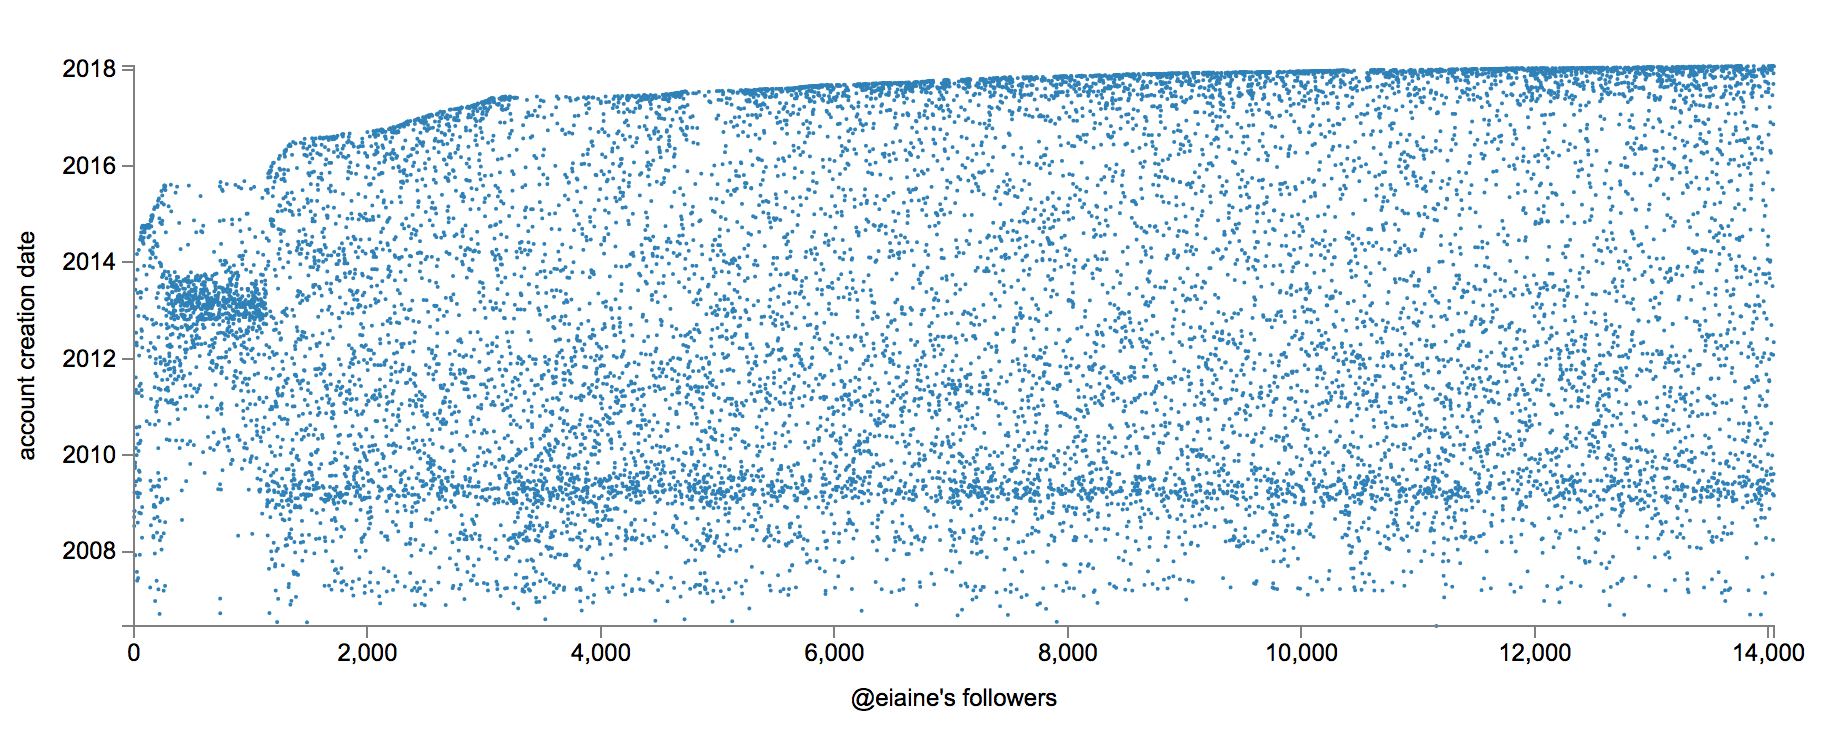
This can take a long time due to Twitter's rate-limiting, so expect to wait about an hour for every 12,000 followers. When the script is complete, view the results by opening index.html in your web browser. Your plot will look something like this:
If the chart fails to load, you may be getting an error along the lines of Cross origin requests are only supported for protocol schemes: http, data, chrome, chrome-extension, https. To fix this, either open index.html in firefox, or start chrome with --allow-file-access-from-files, or try some of the other suggestions listed here.
Another way to avoid the Cross origin error is to run python -m SimpleHTTPServer and navigate to http://localhost:8000.