A demo project showing how to use Prometheus to monitor a machine learning system.
You should be able to view the dev and prod distributions on Grafana in real time.

Run python train.py and python deploy.py in seperate terminals and leave them running.
Follow the Starting Prometheus guide, using the prometheus.yml in this repository as the config file when starting Prometheus locally.
Follow the Install Grafana guide to both install and start Grafana locally.
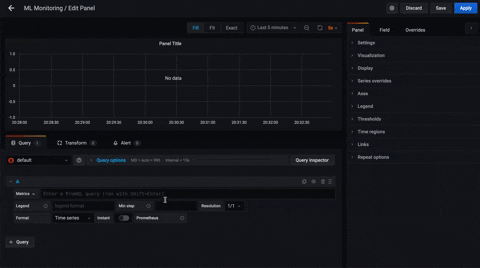
You can then add a Prometheus data source and create a panel. Create two panels with the following queries:
PromQL query for dev distribution
model_feature_bucket{env="dev"}
PromQL query for prod distribution
model_feature_bucket{env="prod"}
Select Heatmap for both Visualization and Format, legend to {{le}} and Data Format to Time series buckets, like so:
Grafana doesn't allow for alerts to be set on heatmaps.
One option for detecting data drift is to write an exporter, which takes the exported metrics (on ports 8000 and 8001 in the demo), augmenting them (with e.g. distance between dev and prod using the KS test) and exposing them on another endpoint.
For more information on exporters, see Prometheus - Writing Exporters.