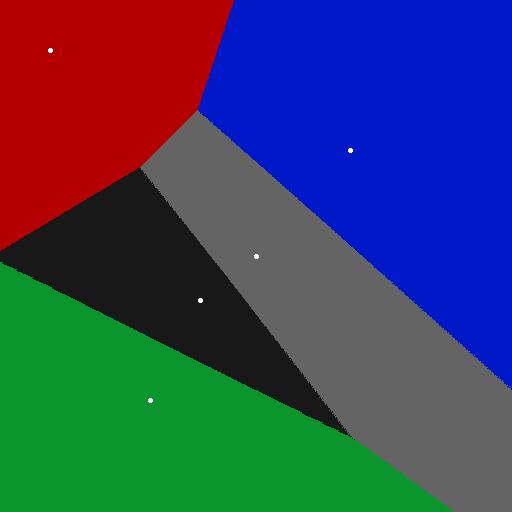
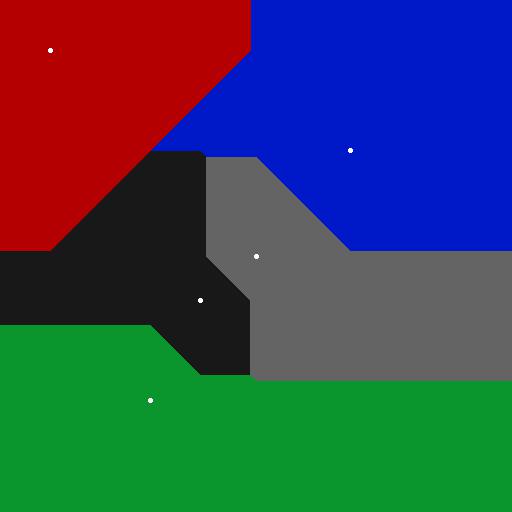
First implementation is a brute force calculation of the distance to each seed point for every pixel. Specify the seedpoints at the top of the file in the 'points' numpy array and the the color corresponding to each one using the 'colors' array. Pixel map is RGB. Example pictures are provided to show roughly what one will expect when executing the file
The second implementation using k-nearest-neighbors (but only looking at closest neighbor) is WAY faster than the brute force implementation, however I cannot make a manhattan version with it. Check out the image files in this repo to get an idea of the images that can be generated! :D
Here's a Voronoi plot generated using Eulidean distance
Here's a Voronoi plot generated using Manhattan distance

