Refer to the issue, this document will reproduce functional analysis using DOSE and clusterProfiler packages.
The paper and supplemental files are located at paper folder.
In page 63 of supplemental file, the authors mentioned that genes with high contribution of individuals to splicing variation were used in GO enrichment analysis.
The Individual and Tissue contribution to variation of splicing was stored in supplemental table 17, which was exported as a csv file.
require(magrittr)
require(DOSE)
require(RDAVIDWebService)
require(clusterProfiler)

table17 <- read.csv("paper/tableS17.csv")

gene <- with(table17, gene_id[ Individuals > quantile(Individuals, 0.98)])
gene %<>% as.character %>% gsub("\\.\\d+", "", .)

head(gene)

## [1] "ENSG00000002586" "ENSG00000011007" "ENSG00000014164" "ENSG00000042753"
## [5] "ENSG00000051620" "ENSG00000055130"

length(gene)

## [1] 212
The authors did not mention how they define high contribution, here I use the top 2% of genes and get 212 genes with 168 genes that could be mapped in the DAVID database. Slightly large than the number (139) reported in supplemental file.
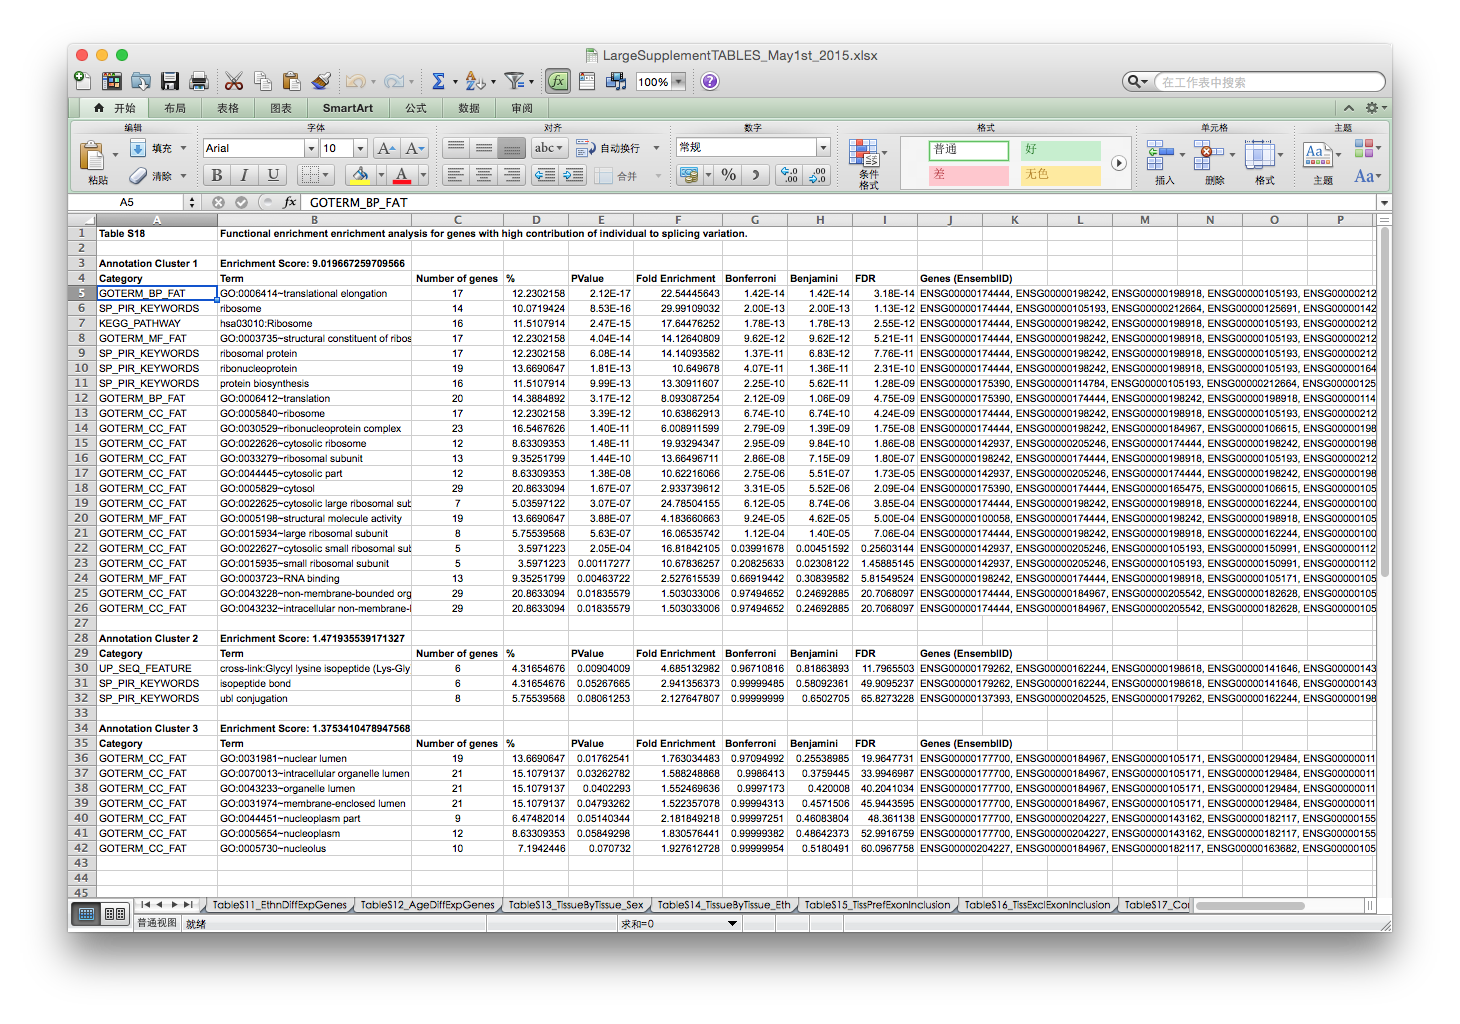
The GO enrichment result reported in supplemental table 18 is:
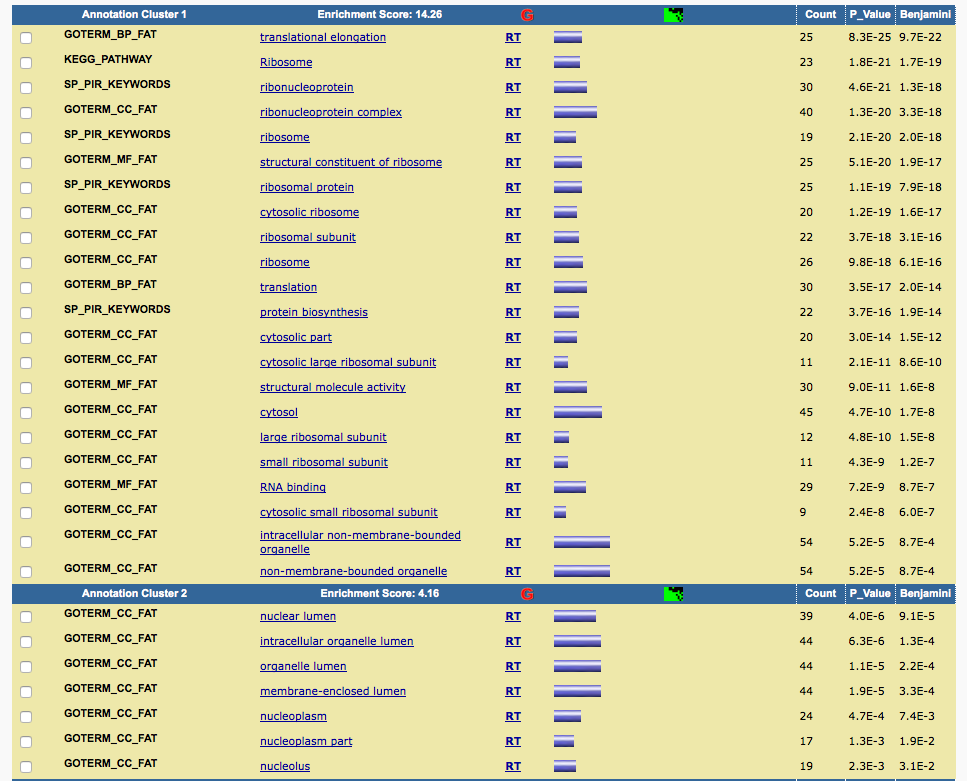
I pasted the genes into DAVID and got similar results.
Although the gene list I selected here is slighly different from the one author selected (which we don't know), it can reproduce the results reported in the paper.
david_bp <- enrichDAVID(gene, idType="ENSEMBL_GENE_ID", annotation="GOTERM_BP_ALL", qvalueCutoff=0.05, david.user="gcyu@connect.hku.hk")

summary(david_bp)[, -8]

##                    ID                                      Description
## GO:0006414 GO:0006414                         translational elongation
## GO:0006412 GO:0006412                                      translation
## GO:0010467 GO:0010467                                  gene expression
## GO:0006396 GO:0006396                                   RNA processing
## GO:0044085 GO:0044085                    cellular component biogenesis
## GO:0022613 GO:0022613             ribonucleoprotein complex biogenesis
## GO:0044267 GO:0044267               cellular protein metabolic process
## GO:0042254 GO:0042254                              ribosome biogenesis
## GO:0016070 GO:0016070                            RNA metabolic process
## GO:0044260 GO:0044260         cellular macromolecule metabolic process
## GO:0034645 GO:0034645      cellular macromolecule biosynthetic process
## GO:0009059 GO:0009059               macromolecule biosynthetic process
## GO:0006397 GO:0006397                                  mRNA processing
## GO:0032268 GO:0032268 regulation of cellular protein metabolic process
##            GeneRatio    BgRatio       pvalue     p.adjust       qvalue
## GO:0006414    25/168  101/14116 4.833921e-25 6.298599e-22 9.718725e-23
## GO:0006412    30/168  331/14116 1.916789e-17 1.248788e-14 1.926877e-15
## GO:0010467    66/168 2999/14116 1.313901e-07 5.706548e-05 8.805443e-06
## GO:0006396    20/168  547/14116 2.561454e-05 8.309328e-03 1.287468e-03
## GO:0044085    28/168 1001/14116 4.549872e-05 1.178722e-02 1.829527e-03
## GO:0022613    11/168  180/14116 5.566722e-05 1.201662e-02 1.844751e-03
## GO:0044267    49/168 2355/14116 6.422825e-05 1.188482e-02 1.844751e-03
## GO:0042254     9/168  122/14116 9.956471e-05 1.608661e-02 2.434515e-03
## GO:0016070    26/168  938/14116 1.089796e-04 1.565485e-02 2.434515e-03
## GO:0044260    86/168 5214/14116 1.478656e-04 1.908386e-02 2.972876e-03
## GO:0034645    54/168 2812/14116 1.896884e-04 2.222098e-02 3.467032e-03
## GO:0009059    54/168 2832/14116 2.282688e-04 2.448429e-02 3.824503e-03
## GO:0006397    13/168  321/14116 4.392293e-04 4.307854e-02 6.792939e-03
## GO:0032268    16/168  474/14116 5.095183e-04 4.632629e-02 7.317143e-03
##            Count
## GO:0006414    25
## GO:0006412    30
## GO:0010467    66
## GO:0006396    20
## GO:0044085    28
## GO:0022613    11
## GO:0044267    49
## GO:0042254     9
## GO:0016070    26
## GO:0044260    86
## GO:0034645    54
## GO:0009059    54
## GO:0006397    13
## GO:0032268    16

dotplot(david_bp, showCategory=12)
eg=bitr(gene, "ENSEMBL", "ENTREZID", "org.Hs.eg.db")[, "ENTREZID"]
clusterProfiler_bp <- enrichGO(eg, ont="BP")

dotplot(clusterProfiler_bp, showCategory=20)
merge_result(list(david=david_bp, clusterProfiler=clusterProfiler_bp)) %>%
    plot(., showCategory=10)
date()

## [1] "Wed Jul 15 21:15:17 2015"

sessionInfo()

## R version 3.2.1 (2015-06-18)
## Platform: x86_64-apple-darwin14.3.0 (64-bit)
## Running under: OS X 10.10.4 (Yosemite)
##
## locale:
## [1] en_US.UTF-8/en_US.UTF-8/en_US.UTF-8/C/en_US.UTF-8/en_US.UTF-8
##
## attached base packages:
## [1] stats4    parallel  stats     graphics  grDevices utils     datasets
## [8] methods   base
##
## other attached packages:
##  [1] clusterProfiler_2.3.6  RDAVIDWebService_1.6.0 ggplot2_1.0.1
##  [4] GOstats_2.34.0         Category_2.34.2        GO.db_3.1.2
##  [7] AnnotationDbi_1.30.1   GenomeInfoDb_1.4.1     IRanges_2.2.5
## [10] S4Vectors_0.6.1        Matrix_1.2-2           Biobase_2.28.0
## [13] BiocGenerics_0.14.0    graph_1.46.0           DOSE_2.7.9
## [16] RSQLite_1.0.0          DBI_0.3.1              rmarkdown_0.7
## [19] roxygen2_4.1.1         magrittr_1.5           BiocInstaller_1.18.3
##
## loaded via a namespace (and not attached):
##  [1] KEGGREST_1.8.0         qvalue_2.0.0           genefilter_1.50.0
##  [4] reshape2_1.4.1         splines_3.2.1          rJava_0.9-6
##  [7] lattice_0.20-31        colorspace_1.2-6       htmltools_0.2.6
## [10] XML_3.98-1.3           RBGL_1.44.0            survival_2.38-3
## [13] topGO_2.20.0           plyr_1.8.3             stringr_1.0.0
## [16] zlibbioc_1.14.0        Biostrings_2.36.1      munsell_0.4.2
## [19] GOSemSim_1.27.4        gtable_0.1.2           evaluate_0.7
## [22] labeling_0.3           knitr_1.10.5           SparseM_1.6
## [25] GSEABase_1.30.2        proto_0.3-10           Rcpp_0.11.6
## [28] xtable_1.7-4           scales_0.2.5           formatR_1.2
## [31] DO.db_2.9              annotate_1.46.1        XVector_0.8.0
## [34] png_0.1-7              digest_0.6.8           stringi_0.4-1
## [37] grid_3.2.1             tools_3.2.1            MASS_7.3-42
## [40] httr_1.0.0             AnnotationForge_1.10.1 R6_2.1.0
## [43] igraph_1.0.1


