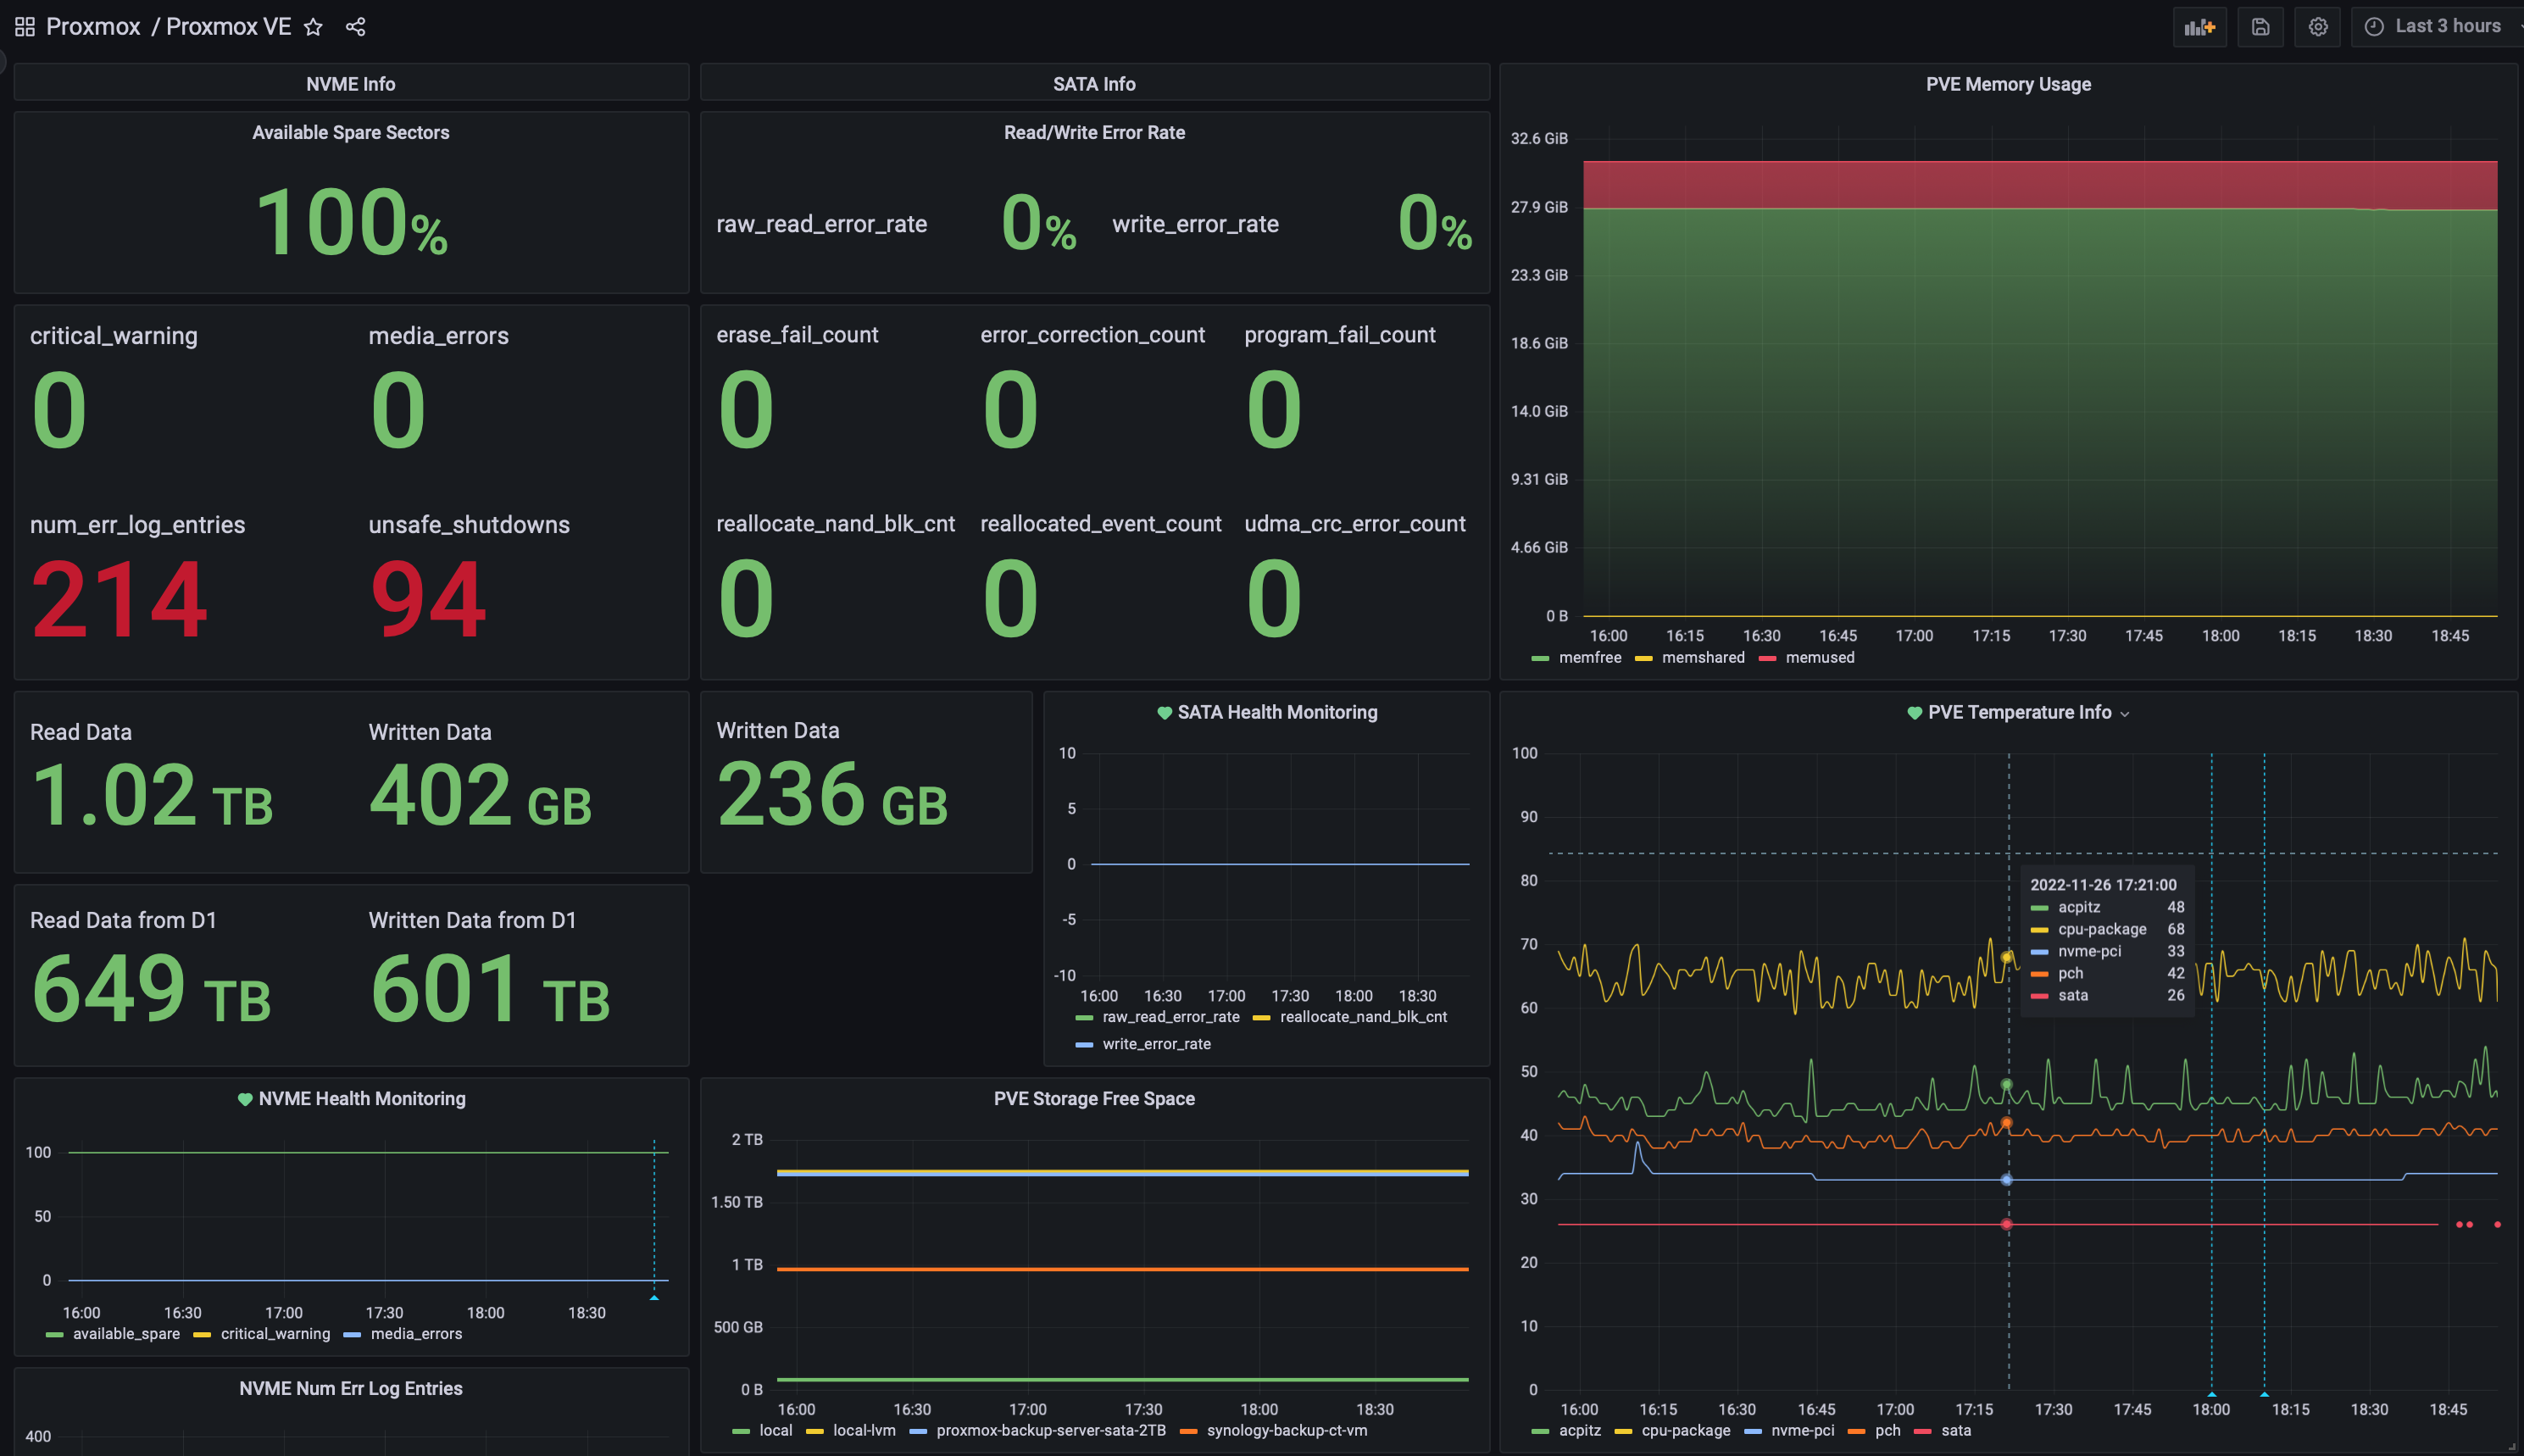
Proxmox VE temperature and disk-health stats upload to influxdb2
DISCLAIMER: this tool has been developed to monitor my own Intel NUC with a SATA and an NVME disk. You can freely use and modify it to your needs, but I hold no responsibility if not used properly.
The script requires the module influxdb-client to be installed on your PVE hosts, with pip:
apt install pip lmsensors smartctl nvme-cli -y
pip install influxdb-client
And a functioning InfluxDB v2 instance hosted on your local LAN.
This script retrieves data from sata disks using smartctl and from nvme disks via nvmcli tools. You can modify the DEVICES dictionary by changing the path of the sata or nvme disk or by removing one of the two entries. Multiple disks per device type are supported by adding the device path to the array.
This script uses the lm_sensors command to retrieve temperature info from the device. It has been tailored for the output of the command executed on an Intel NUC i7 10th Gen device, so it may not work for your device without proper changes to the code
You will need to create these scripts on each host in your PVE cluster (or on your singular host).
This location will be used throughout this guide for variable replacements.
For the purpose of this guide, we will assume /home/scripts, make sure you are replacing this particular path with your path of choice.
Both tools requires you to set some environment variables You can either set these directly in Bash (below #1), or directly editing each script (further below #2)
| Variable | What to input |
|---|---|
| INFLUX_HOST | The host URL or IP for your InfluxDb instance |
| INFLUX_PORT | The port for your InfluxDB instance |
| INFLUX_TOKEN | The admin token for your InfluxDB instance |
| INFLUX_ORGANIZATION | Your InfluxDB Org Name |
| INFLUX_BUCKET | Your InfluxDB Bucket Name |
| HOST_TAG | The name of your PVE Host |
| DATA_UNITS_READ_BASE | Set it to the read bytes if you want to count read bytes from a non zero value. Otherwise set it to 0. Ex: 300_000_000_000 is 300GB |
| DATA_UNITS_WRITTEN_BASE | Set it to the written bytes if you want to count written bytes from a non zero value. Otherwise set it to 0 |
| CPU_CORES | Set it to the number of CPU cores on your machine |
| SATA_DISKS | Comma-separated list of sata disk paths |
| NVME_DISKS | Comma-separated list of nvme disk paths |
nano /home/scripts/pve_disks_stats_to_influxdb2.sh
#!/bin/bash

export INFLUX_HOST="influx_IP_or_DNS"
export INFLUX_PORT="influx_PORT"
export INFLUX_ORGANIZATION="influx_organization"
export INFLUX_BUCKET="influx_bucket"
export INFLUX_TOKEN="influx_token"
export HOST_TAG="measurements_host_tag"
export SATA_DISKS="/dev/sda,/dev/sdb"
export NVME_DISKS="/dev/nvme0,/dev/nvme1"

# I've introduced the following variables since my NVME disk was bought from another person
# and had a lot of read/written TBs.
# This variables hold the amount of read/written bytes the day I've received it, so I can know
# the amount of data read/written by myself.
# If your drive is new, set it to 0.
export DATA_UNITS_READ_BASE="0"
export DATA_UNITS_WRITTEN_BASE="0"

python3 /home/scripts/pve_disks_stats_to_influxdb2.py $*
Edit the 'export' lines to you the variables that are applicable to your environment.
nano /home/scripts/pve_temp_stats_to_influxdb2.sh
#!/bin/bash

export INFLUX_HOST="influx_IP_or_DNS"
export INFLUX_PORT="influx_PORT"
export INFLUX_ORGANIZATION="influx_organization"
export INFLUX_BUCKET="influx_bucket"
export INFLUX_TOKEN="influx_token"
export HOST_TAG="measurements_host_tag"
export CPU_CORES="6"

python3 /home/scripts/pve_temp_stats_to_influxdb2.py $*
Edit the 'export' lines to you the variables that are applicable to your environment.
Taking from this repository, create the two python files, pve_disks_stats_to_influxdb2.py & pve_temp_stats_to_influxdb2.py on your system, on the paths used in your environment files/scripts.
(from your scripts directory) -
chmod +x ./*.sh
This is an important step, to allow you to DRY-RUN: see the what the scripts will upload to influxdb2.
Both scripts (and also both wrappers) can be launched with -t flag, in order to print the collected data (measurements) that will be uploaded to influxdb2.
- pve_disks_stats_to_influxdb2.sh
# /home/scripts/pve_disks_stats_to_influxdb2.sh -t

Measurements for host pve
[
    {
        "measurement": "disks",
        "tags": {
            "host": "pve",
            "devtype": "nvme",
            "devpath": "/dev/nvme0"
        },
        "fields": {
            "critical_warning": 0,
            "temperature": 35,
            "available_spare": 100,
            "available_spare_threshold": 5,
            "percentage_used": 100,
            "data_units_read_from_day1": 649318117888000,
            "data_units_read": 1022190592000,
            "data_units_written_from_day1": 600541940736000,
            "data_units_written": 401684992000,
            "host_read_commands": 2156546787,
            "host_write_commands": 1595165397,
            "controller_busy_time": 43706,
            "power_cycles": 141,
            "power_on_hours": 8347,
            "unsafe_shutdowns": 94,
            "media_errors": 0,
            "num_err_log_entries": 214
        }
    },
    {
        "measurement": "disks",
        "tags": {
            "host": "pve",
            "devtype": "sata",
            "devpath": "/dev/sda"
        },
        "fields": {
            "raw_read_error_rate": 0,
            "reallocate_nand_blk_cnt": 0,
            "power_on_hours": 249,
            "power_cycle_count": 18,
            "program_fail_count": 0,
            "erase_fail_count": 0,
            "ave_block-erase_count": 0,
            "unexpect_power_loss_ct": 1,
            "unused_reserve_nand_blk": 121,
            "sata_interfac_downshift": 0,
            "error_correction_count": 0,
            "reported_uncorrect": 0,
            "temperature_celsius": 26,
            "reallocated_event_count": 0,
            "current_pending_ecc_cnt": 0,
            "offline_uncorrectable": 0,
            "udma_crc_error_count": 0,
            "percent_lifetime_remain": 0,
            "write_error_rate": 0,
            "success_rain_recov_cnt": 0,
            "total_lbas_written": 461738011,
            "host_program_page_count": 3699503,
            "ftl_program_page_count": 461048
        }
    }
]- pve_temp_stats_to_influxdb2.sh
# /home/scripts/pve_temp_stats_to_influxdb2.sh -t

Measurements for host pve
[
    {
        "measurement": "temp",
        "tags": {
            "host": "pve",
            "service": "lm_sensors"
        },
        "fields": {
            "cpu-package": 67,
            "core0": 50,
            "core1": 49,
            "core2": 51,
            "core3": 67,
            "core4": 48,
            "core5": 49,
            "pch": 42,
            "acpitz": 49,
            "nvme-pci": 34
        }
    }
]I've put the two scripts in the following /etc/cron.d/influx_stats crontab file in order to upload stats every minute:
# Upload stats to InfluxDB2

* * * * * root /home/scripts/pve_disks_stats_to_influxdb2.sh >/dev/null 2>&1

* * * * * root /home/scripts/pve_temp_stats_to_influxdb2.sh >/dev/null 2>&1Once you have your data on influxdb2, you can build your Grafana Dashboard and keep an eye on the health of your PVE box.
You can also add alarms to warn you about high temperatures, low disk space available etc. Remember to configure your PVE to upload data to influxdb2 too, in order to have a complete set of data like cpu, memory and disk usage. It can be setup from GUI under Server View -> Datacenter -> Metric Server.
 (I've uploaded the json source for the above dashboard in grafana folder)