This library provides HTTP request metrics to export into Prometheus. It can also track method invocations using convenient functions.
from flask import Flask, request
from prometheus_flask_exporter import PrometheusMetrics

app = Flask(__name__)
metrics = PrometheusMetrics(app)

# static information as metric
metrics.info('app_info', 'Application info', version='1.0.3')

@app.route('/')
def main():
    pass  # requests tracked by default

@app.route('/skip')
@metrics.do_not_track()
def skip():
    pass  # default metrics are not collected

@app.route('/<item_type>')
@metrics.do_not_track()
@metrics.counter('invocation_by_type', 'Number of invocations by type',
         labels={'item_type': lambda: request.view_args['type']})
def by_type(item_type):
    pass  # only the counter is collected, not the default metrics

@app.route('/long-running')
@metrics.gauge('in_progress', 'Long running requests in progress')
def long_running():
    pass

@app.route('/status/<int:status>')
@metrics.do_not_track()
@metrics.summary('requests_by_status', 'Request latencies by status',
                 labels={'status': lambda r: r.status_code})
@metrics.histogram('requests_by_status_and_path', 'Request latencies by status and path',
                   labels={'status': lambda r: r.status_code, 'path': lambda: request.path})
def echo_status(status):
return 'Status: %s' % status, statusThe following metrics are exported by default
(unless the export_defaults is set to False).
flask_http_request_duration_seconds(Histogram)
Labels:method,pathandstatus.
Flask HTTP request duration in seconds for all Flask requests.flask_http_request_total(Counter)
Labels:methodandstatus. Total number of HTTP requests for all Flask requests.flask_exporter_info(Gauge)
Information about the Prometheus Flask exporter itself (e.g.version).
By default, the metrics are exposed on the same Flask application on the
/metrics endpoint and using the core Prometheus registry.
If this doesn't suit your needs, set the path argument to None and/or
the export_defaults argument to False plus change the registry
argument if needed. The group_by_endpoint constructor flag makes
the default request duration metric tracked by endpoint (function)
instead of URI path.
The register_endpoint allows exposing the metrics endpoint on a specific path.
It also allows passing in a Flask application to register it on but defaults
to the main one if not defined.
Similarly, the start_http_server allows exposing the endpoint on an
independent Flask application on a selected HTTP port.
It also supports overriding the endpoint's path and the HTTP listen address.
When defining labels for metrics on functions, the following values are supported in the dictionary:
- A simple static value
- A no-argument callable
- A single argument callable that will receive the Flask response as the argument
Label values are evaluated within the request context.
The PrometheusMetrics.info(..) method provides a way to expose
information as a Gauge metric, the application version for example.
The metric is returned from the method to allow changing its value
from the default 1:
metrics = PrometheusMetrics(app)
info = metrics.info('dynamic_info', 'Something dynamic')
...
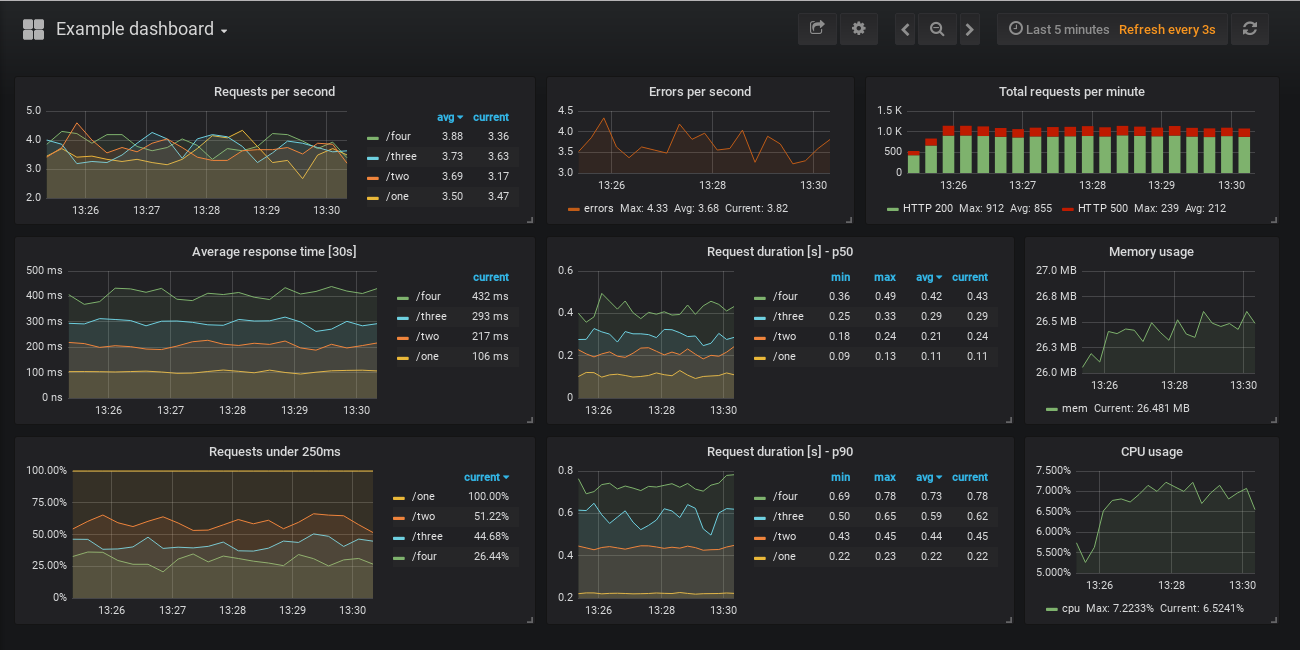
info.set(42.1)See some simple examples visualized on a Grafana dashboard by running the demo in the examples/sample-signals folder.
Please note, that changes being live-reloaded, when running the Flask
app with debug=True, are not going to be reflected in the metrics.
See rycus86#4
for more details.
Getting accurate metrics for WSGI apps might require a bit more setup.
See a working sample app in the examples folder, and also the
prometheus_flask_exporter#5 issue.
MIT


