This is an example Grafana connector for ArangoDB that can be used with the Simple JSON Data Source plugin.
First install the Simple JSON Data Source plugin using the grafana-cli:
$ grafana-cli plugins install grafana-simple-json-datasourceYou may have to restart Grafana for the new data source to become available.
The Grafana connector can be installed as a Foxx service using the ArangoDB web interface or the Foxx CLI:
$ npm install --global foxx-cli
$ foxx install -u root -P -H http://localhost:8529 -D _system /grafana \
https://github.com/arangodb-foxx/grafana-connector/archive/master.zip

# or without installing foxx-cli:

$ npx foxx-cli install -u root -P -H http://localhost:8529 -D _system /grafana \
https://github.com/arangodb-foxx/grafana-connector/archive/master.zipBefore you can use the ArangoDB connector in Grafana you need to configure the service using the web interface or the Foxx CLI.
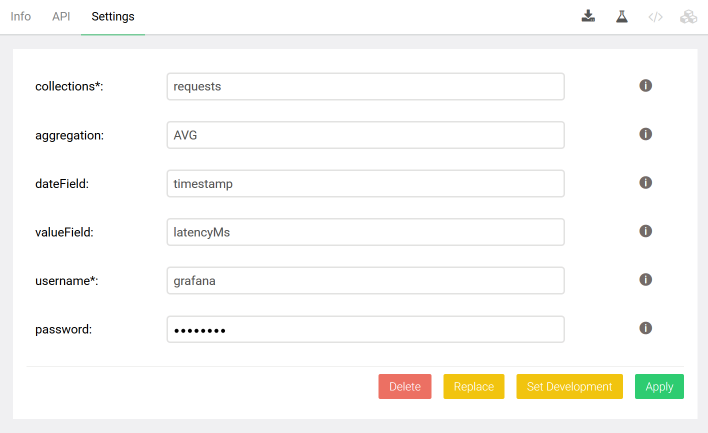
To configure the service in the ArangoDB web interface, open the service details and then navigate to the Settings tab in the top bar.
-
username and password: credentials that will be used by the Grafana data source to authenticate against this service.
Note: These credentials will only be used by the Grafana data source and should not match the ArangoDB user credentials used to access ArangoDB itself.
-
target: Name of the target as shown in the Grafana Metric field. Please note that the name can contain template variables.
-
alias: Name of the target as shown in the Grafana graph. Please note that the name can contain template variables.
-
collection: Name of the collection. Please note that the name can contain template variables.
-
aggregation (default:
SUM): AQL aggregation function that will be used to aggregate results for Grafana. Should be one of AVG, COUNT, COUNT_DISTINCT, MAX, MIN, SORTED_UNIQUE, STDDEV, STDDEV_SAMPLE, SUM, UNIQUE, VARIANCE, VARIANCE_SAMPLE, NONE. You can use '*' to get them all defined except 'NONE'. -
filterExpression (default: empty): An AQL expression used to filter data. The current document is called 'doc'. You can use a Mustache like syntax to include variables. For example, doc.name == '{{grafana.name}}'.
-
dateName: Name of the field containing the date time for each data point. This is only used for Grafana to name the data-point.
-
dateField (default:
date): Name of the field containing the date time for each data point. Either a top-level attribute name or an AQL expression. In the latter case, The current document is called 'doc'. The value of this field should be expressed in milliseconds since the start of the UNIX epoch. -
valueField (default:
value): Name of the field containing the numerical value for each data point. Either a top-level attribute name or an AQL expression. In the latter case, The current document is called 'doc'. -
multiValueTemplateVariables (default: empty): A comma-separated list of template variables that should be treated as multi-target variables. For example, if you have a Grafana variable 'size' which contains 'small' and 'big', then two runs will be done for the above expressions. The first one will set 'grafana.size' to 'small' and the second to 'big'.
-
templateVariables (default: empty): A JSON object that describes the values for template variables. In Grafana create a Query named QUERY (in Query Options). For each such query, create a key QUERY and an AQL as value. For example, { "size": "FOR doc IN sizes RETURN DISTINCT doc.name" }.
To add the connector as a data source in Grafana, navigate to Configuration > Date Sources and press the Add data source button, then select the SimpleJson data source.
Enter the URL of the service, e.g. http://localhost:8529/_db/_system/grafana, and tick the checkbox for Basic Auth, then enter the credentials you defined while configuring the service.
Press the button Save & Test to create the data source and use it in your dashboards.
Note: The collections exposed by the Grafana connector will appear in the
select metric dropdown. The connector supports both the timeserie and
table modes of the Simple JSON Data Source. If you're not sure which mode
to use, you should probably use timeserie.
This code is licensed under the Apache License, Version 2.0.
