A server side component for interactive data reduction queries. Work in progress - it doesn't actually work yet, but this repo contains design ideas and partial implementations.
This project is essentially a server for Chiasm that is designed such that it can integrated with Chorus, a collaboration platform for Big Data.
Organization:
dataReductionServiceThe Spark-based data reduction service.visEngineThe Rails Engine for integration with Chorus.
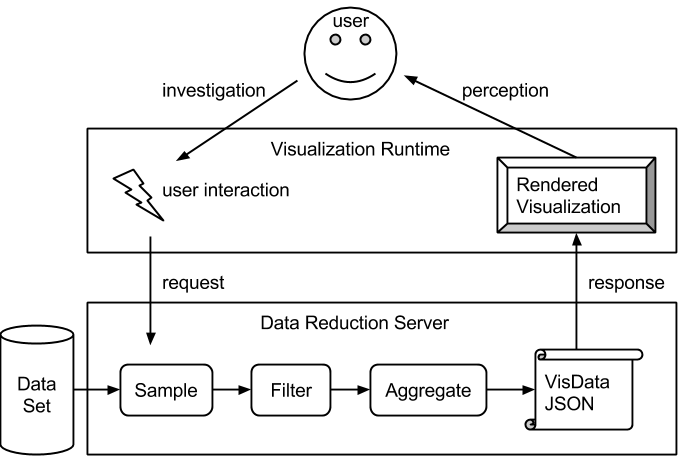
The overall architecture for interactive Big Data visualization with Chiasm. The goal is to establish an interactive feedback loop between the user and the data that enables rapid visual data exploration.
Chorus is designed to handle large data sets that reside in clusters and may be terabytes in size. It is not feasible to transfer the entire data set to the client for visualization. It would be possible to render the visualization on the server side, however with this approach interactive response times would be lost. Also, the argument could be made that a human could not perceive all the data points anyway, and there are not enough pixels to represent every point. Therefore the visualizations will reside entirely on the client side, and data reduction methods must be employed on the server side. Data reduction methods are surveyed nicely in the paper imMens: Real‐time Visual Querying of Big Data.
VisEngine supports three data reduction methods that visualizations will sit on top of:
- Sampling
- Filtering
- Aggregation
Sampling involves selecting a random subset of rows from the table to be visualized. This is great for preserving the distribution, but may remove outliers that are important to retain for certain analyses.
Filtering involves including only rows that meet certain criteria. For example, if a data set contains rows covering an entire year, a filter might choose to only view rows for a single day. Multiple columns can be filtered simultaneously.
Aggregation involves on-demand data cube computation. This can compute counts, sums, and averages over multidimensional groupings. For example, rows with timestamps can be binned into hours or days, or rows with location information can be binned into geographic regions. Also, any categorical field can be used to compute counts or sums to, for example, power a Bar Chart.

The data reduction service pipeline, implemented in Scala using Apache Spark.
This data reduction service runs within an instance of Spark-Jobserver. The VisEngine Ruby middleware provides a REST API for the Chiasm client to access the data reduction service.
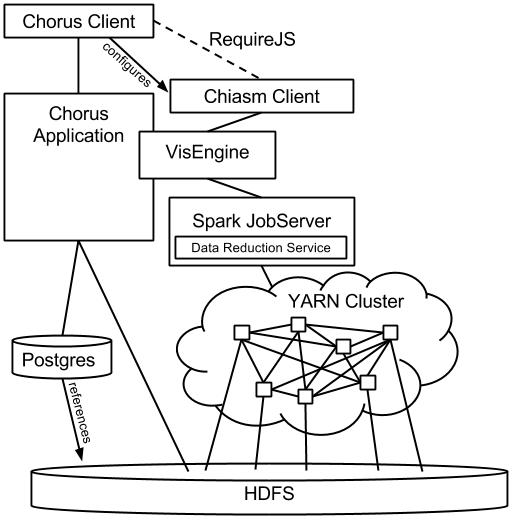
The system architecture connecting interactive visualizations to "Big Data" residing in HDFS or S3.
The process for running the server for development mode is as follows.
Install SBT. For Ubuntu Linux, the process looks like this (source):
wget https://dl.bintray.com/sbt/debian/sbt-0.13.7.deb
sudo apt-get update
sudo dpkg -i sbt-0.13.7.deb
Install and start spark-jobserver.
git clone https://github.com/spark-jobserver/spark-jobserver.git
cd spark-jobserver/
git checkout v0.5.0
sbt
> reStart
Use the scripts under server/dataReductionService to build and deploy the data reduction service JAR:
cd chiasm/server/dataReductionService
sh deployJarToJobserver.sh
Start the dummy Rails application that mounts the visEngine Rails Engine:
cd server/visEngine/test/dummy/
bundle # Necessary for installing Gems before first run only.
bin/rails server
Access the demo at localhost:3000/vis_engine/bar_chart_demo