I'm trying to collect a handful of tikz figures that I created over the past ~1 year to make it easier for me to create new, better tikz figures.
The tikz code I'm sharing generally tends to follow the format of a LaTeX .tex file with the following format:
\documentclass[tikz, margin=3.14mm]{standalone}

% header

\begin{document}
\begin{tikzpicture}
\end{tikzpicture}
\end{document}
I render most of them with pdflatex and then to create a small-filesize
image version that is readily shareable on the web, I use a command-line tool
called pdf2svg on the output. For example, I run pdf2svg limit_supremum_infimum.pdf limit_supremum_infimum.svg to produce the svg file version.
Most of the examples I share will have something like this added to them:
% \documentclass and the rest of the header
\usetikzlibrary{backgrounds}

\begin{document}
\begin{tikzpicture}[background rectangle/.style={fill=white}, show background rectangle]
% ...
\end{tikzpicture}
\end{document}
The inclusion of a white rectangle in the background is, in almost all cases, just so that the rendered diagrams can be easily seen in this readme while browsing GitHub in dark mode, or while viewing the readme in other software with a dark mode such as VS Code. The background is totally optional, and removing the tikz library and tikzpicture style settings described above should remove it if you need to.

Limit supremum and infimum illustrated.

Delta & epsilon as commonly used in defining continuity.

Example of a height 1, radius 1 cone.
Based off of responses here: https://tex.stackexchange.com/questions/171169/how-to-draw-a-simple-cone-with-height-and-radius-with-tikz

Illustrating convexity.

Optimization subject to a constraint, e.g., minimizing f subject to the constraint g.

The implication graph of different kinds of asymptotic convergence.

Definition of intersection.

Diagram describing the role of statistical methods in the scientific process.
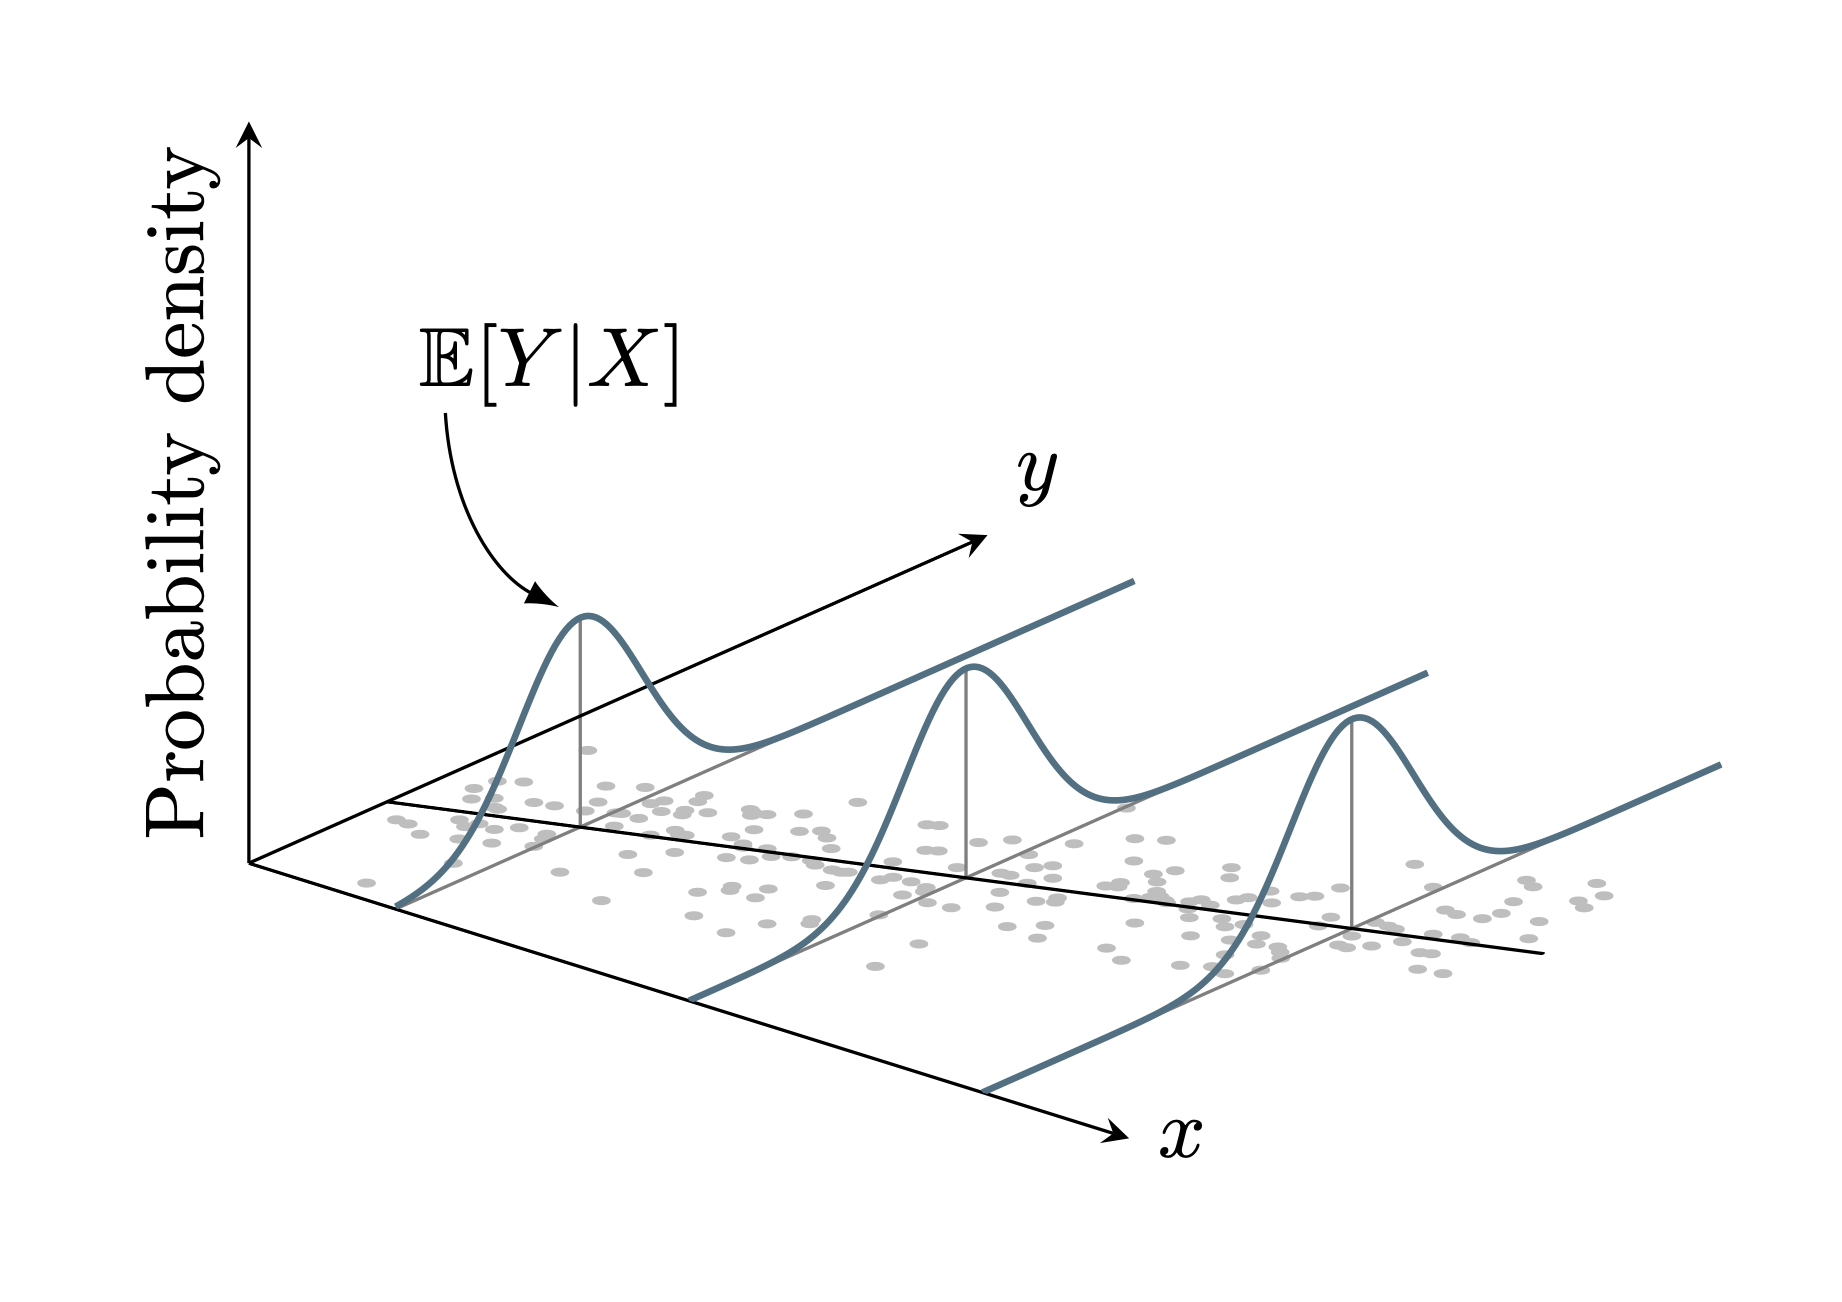
Probability density in a linear model.
Based on https://pgfplots.net/heteroskedasticity-linear-regression/
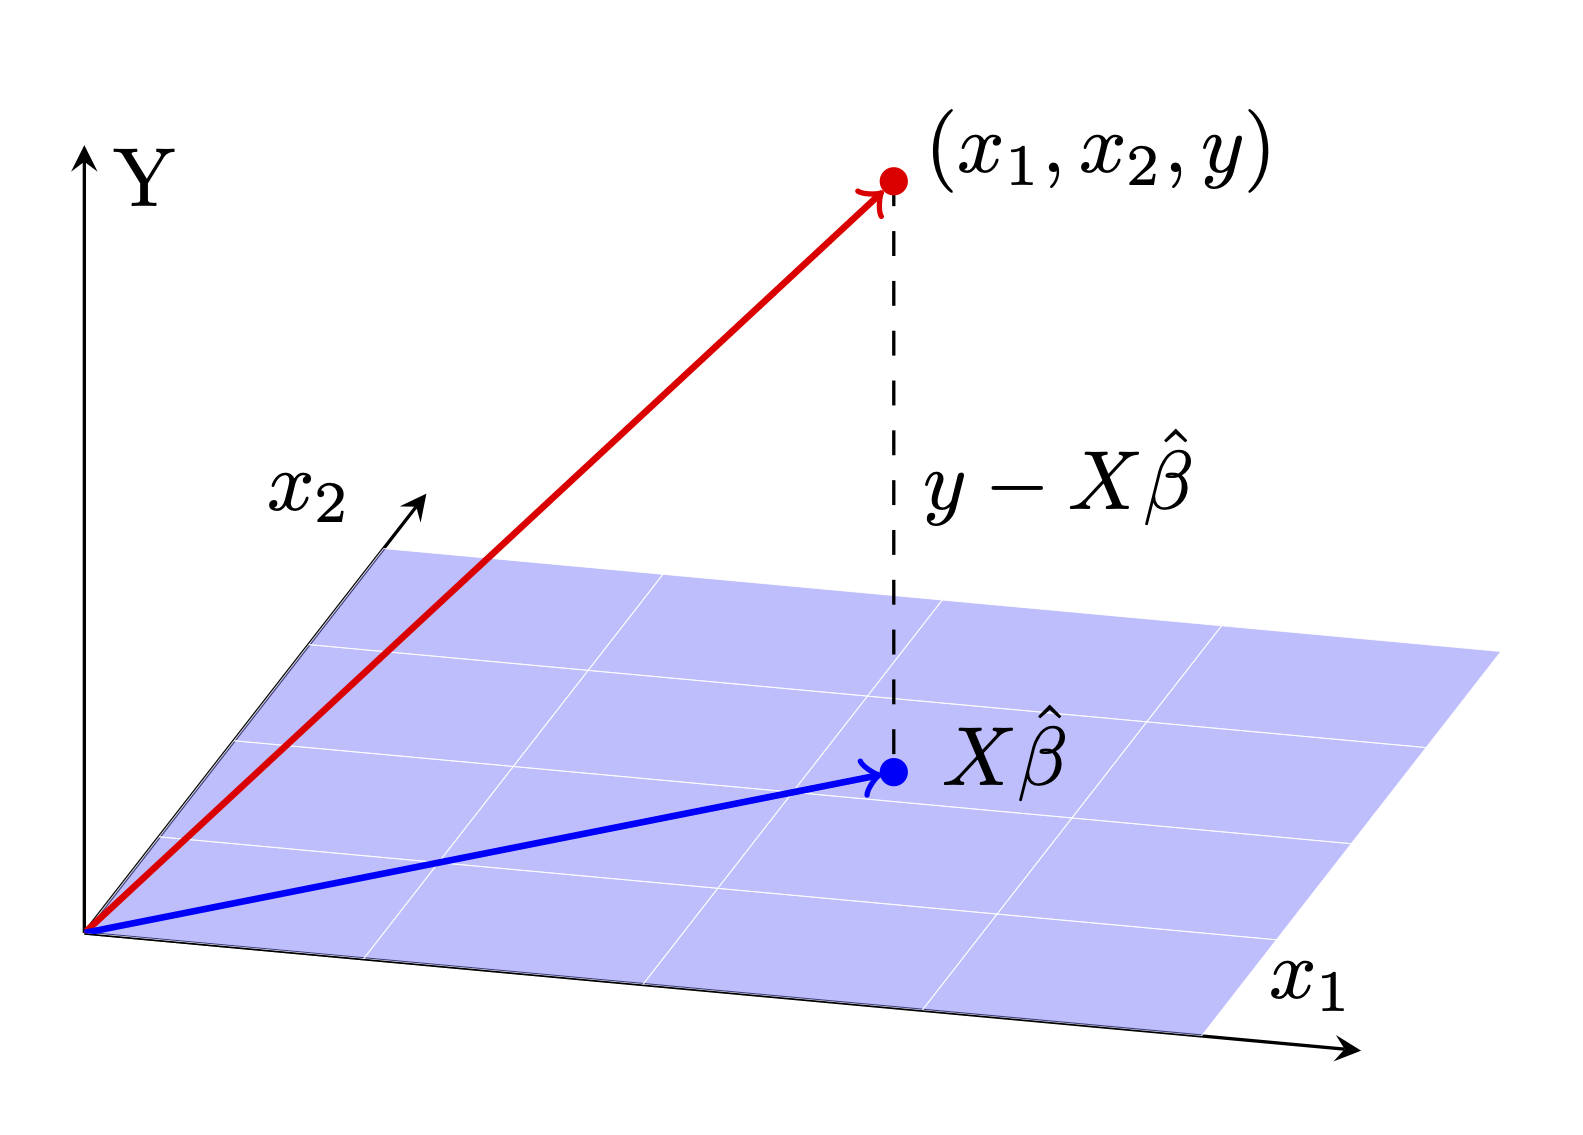
Regression viewed as projection.
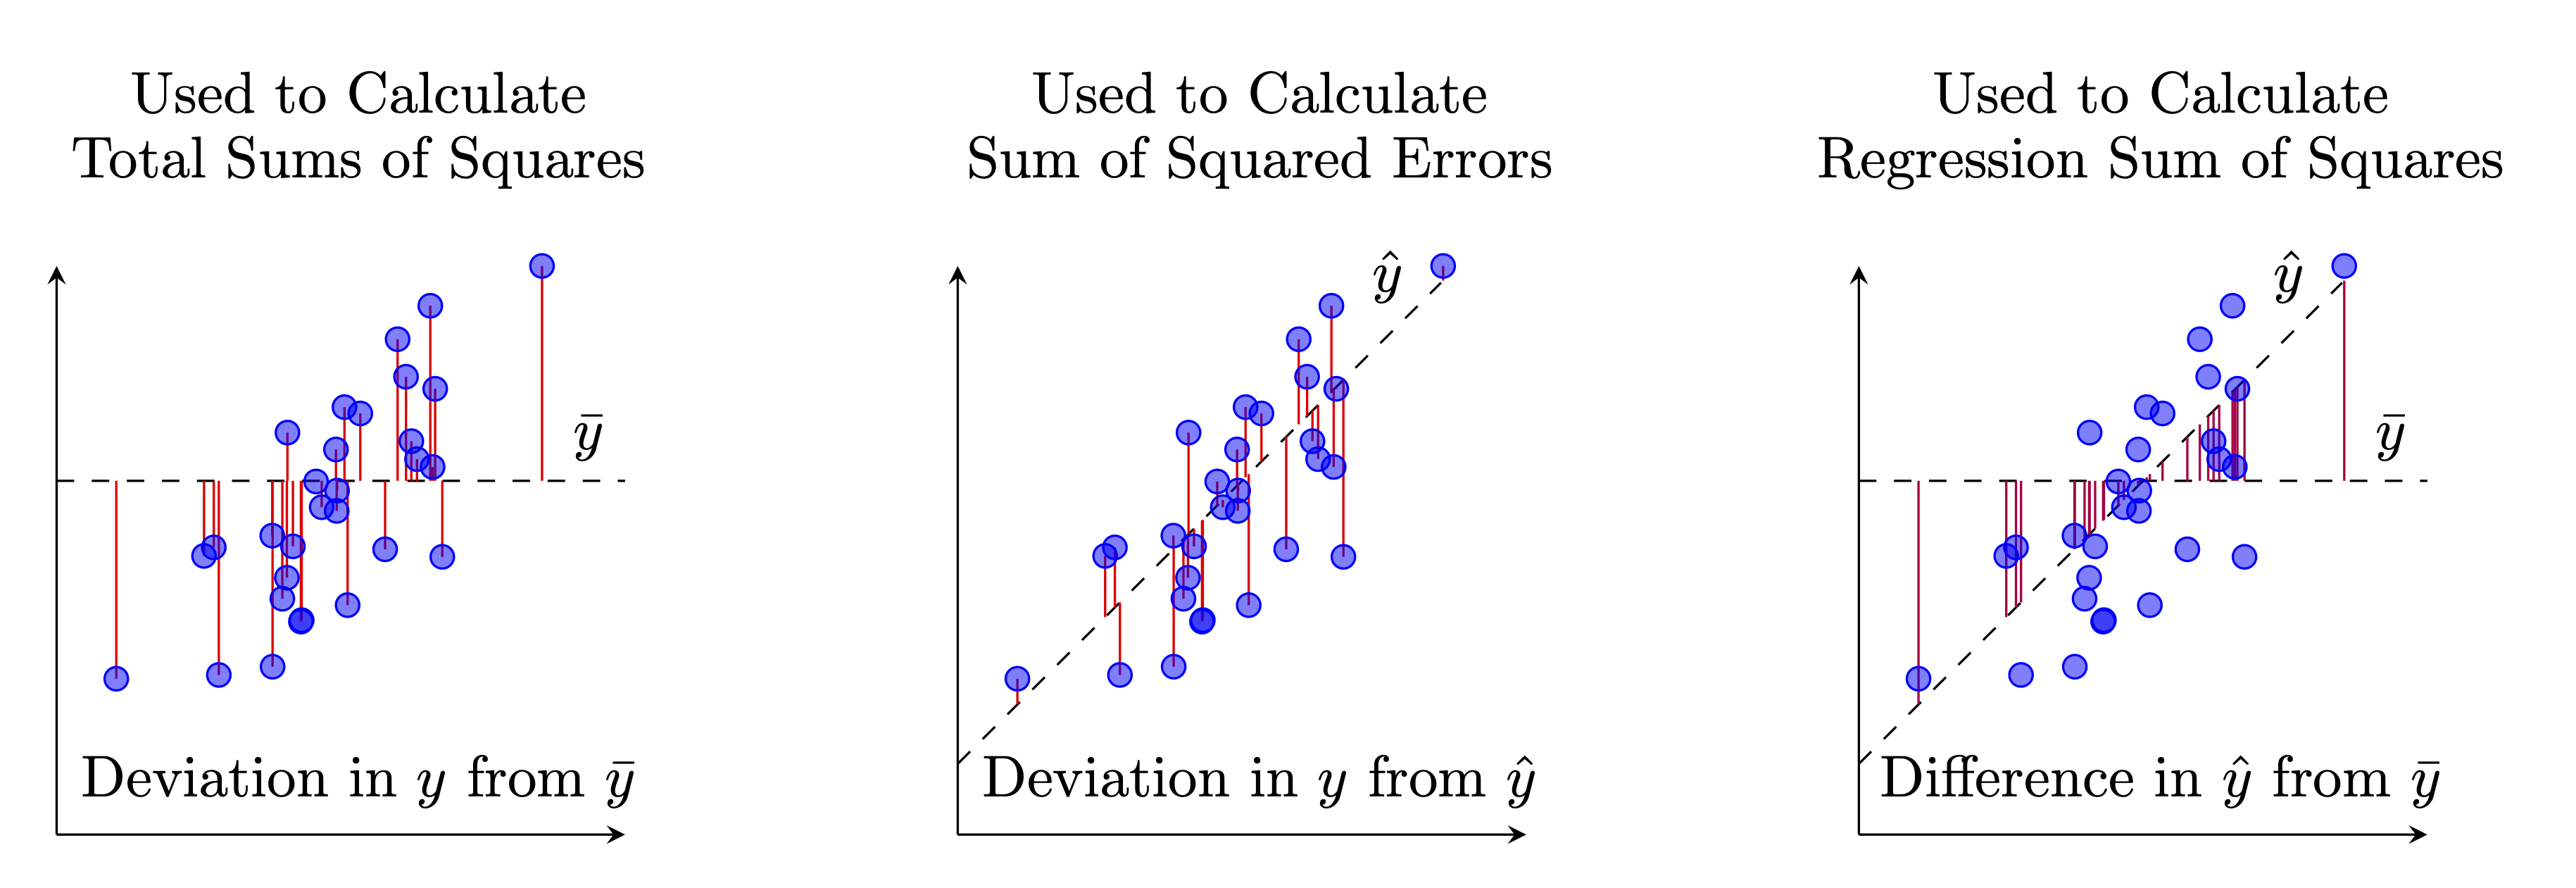
Decomposing total sum of squares into sum of squared errors and regression sum of squares.

LASSO penalization.

Time-varying confounding as per the 2000 paper on marginal structural models by Hernán, Brumback, and Robins.

Convergence in distribution.

Semidefiniteness.

Geometric random variables model the probability of getting k failures before the rth success.
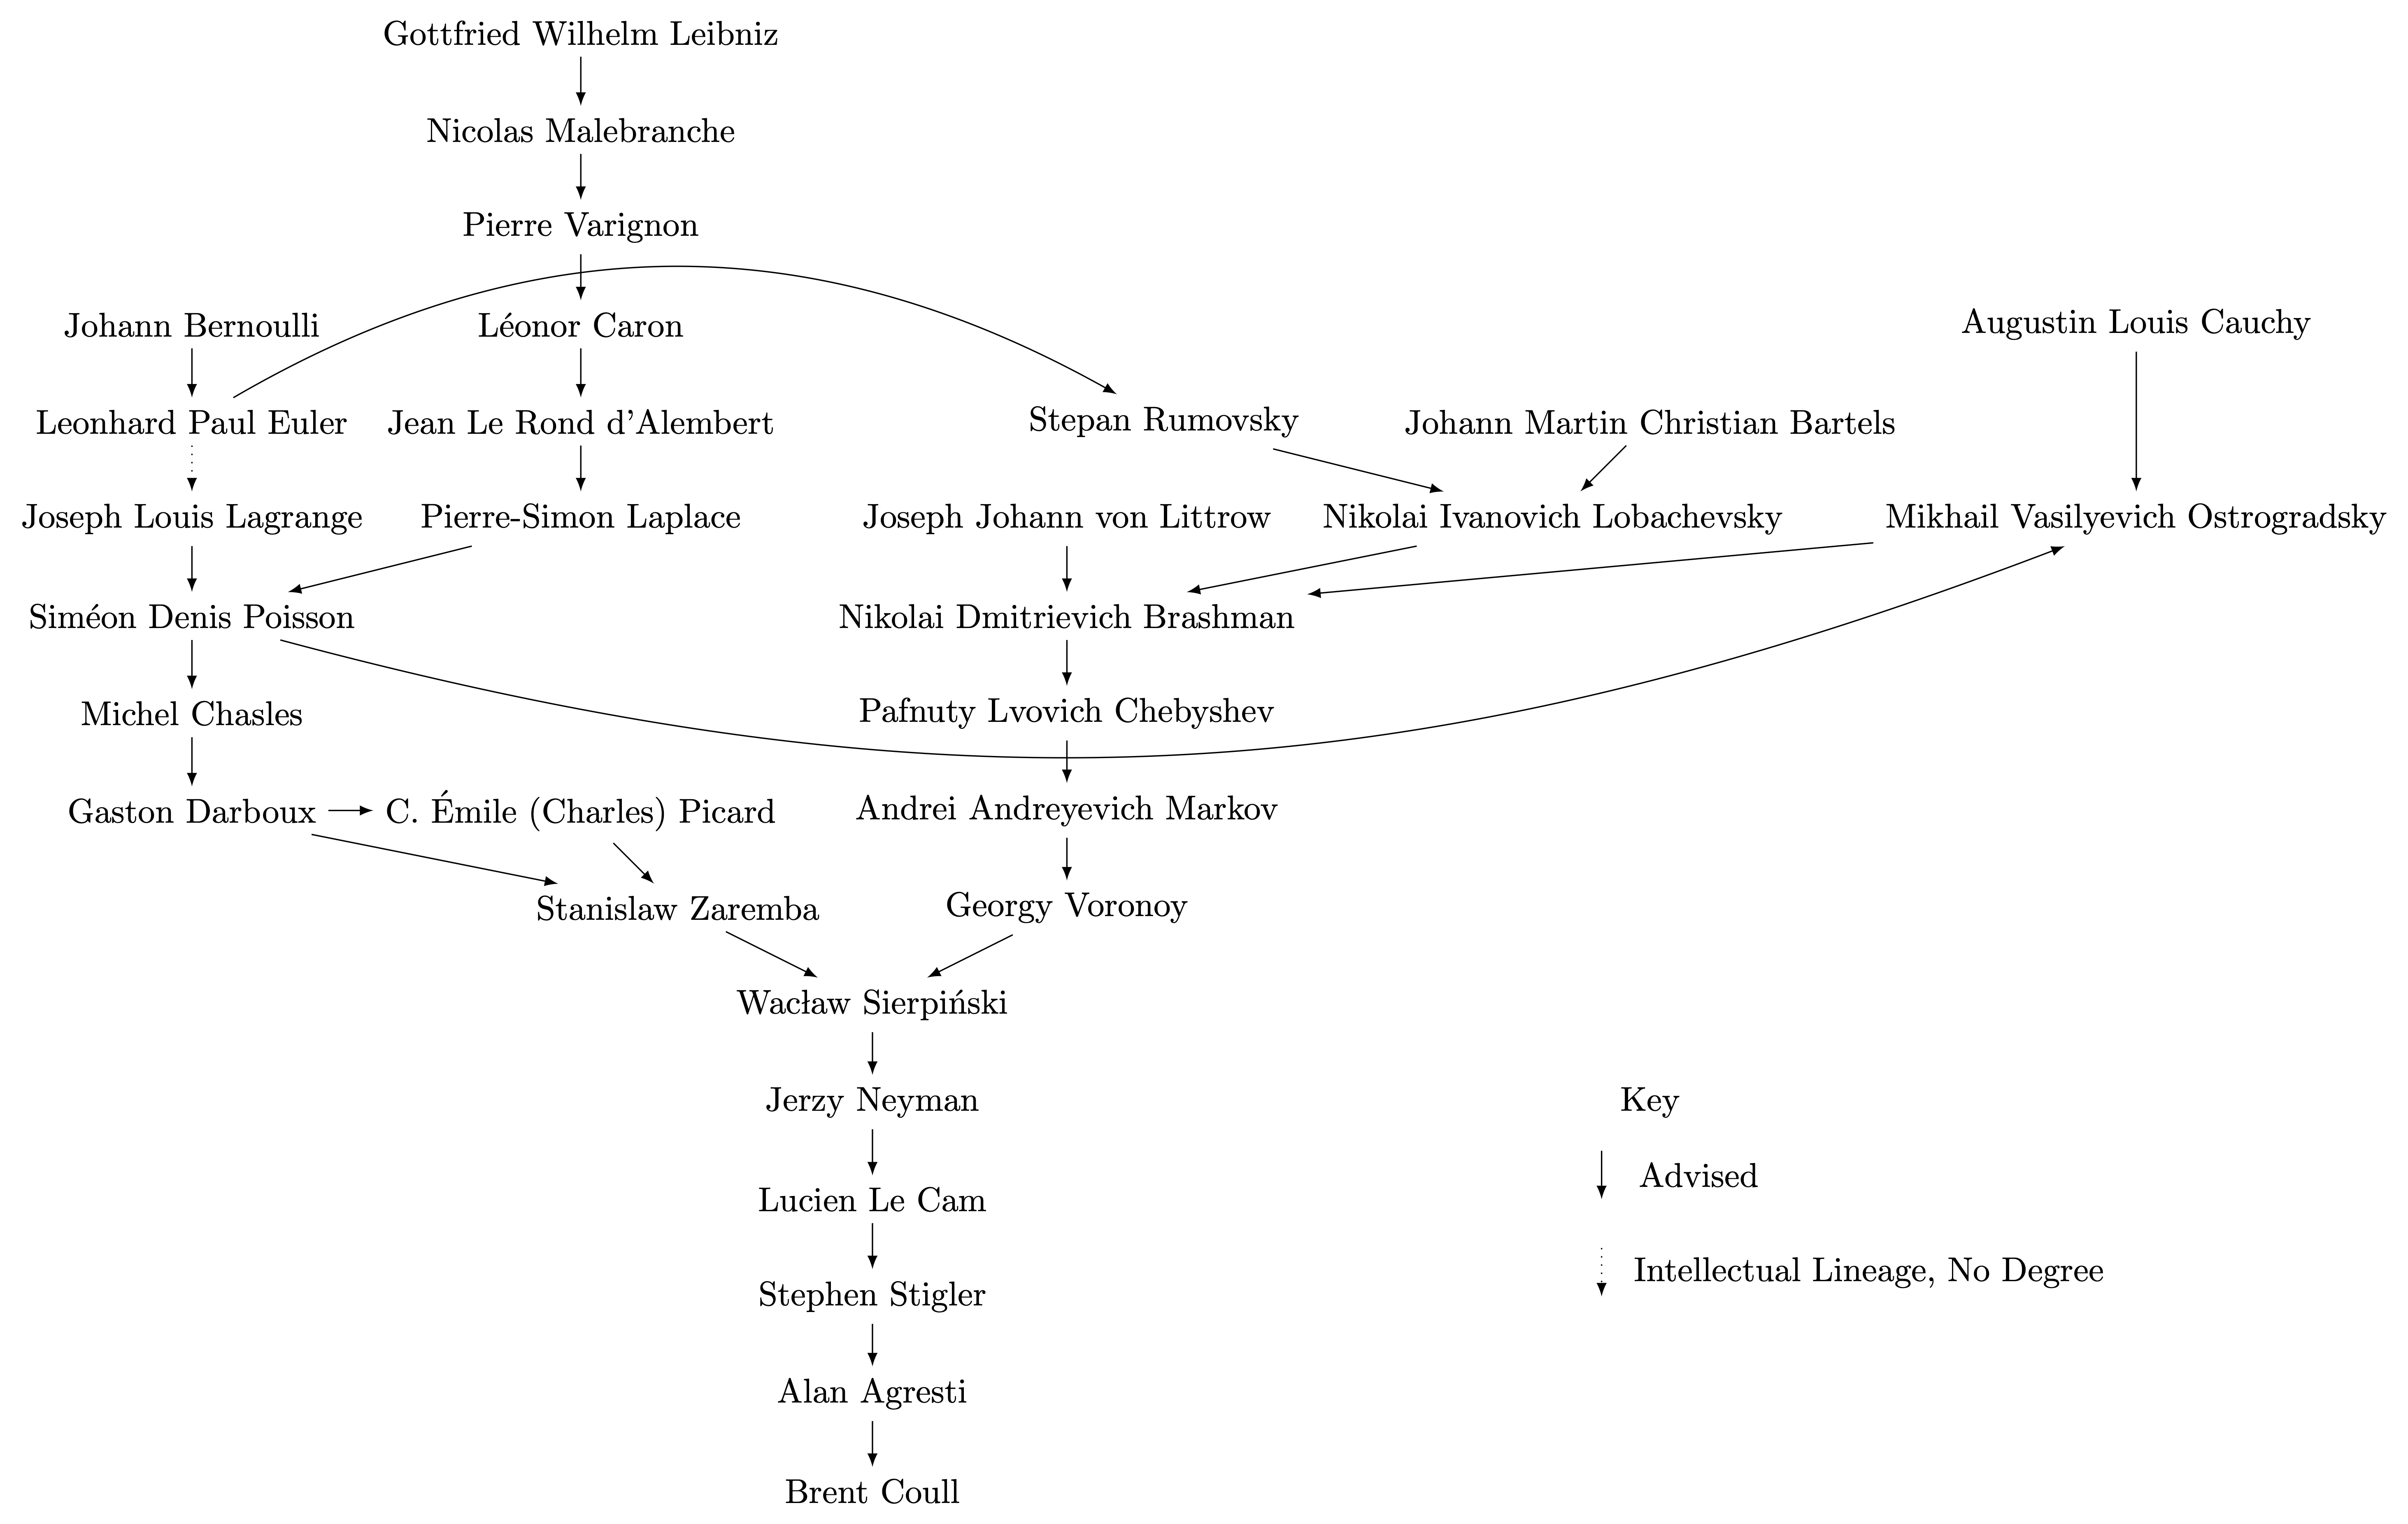
Mathematical lineage of one of the faculty I work with.
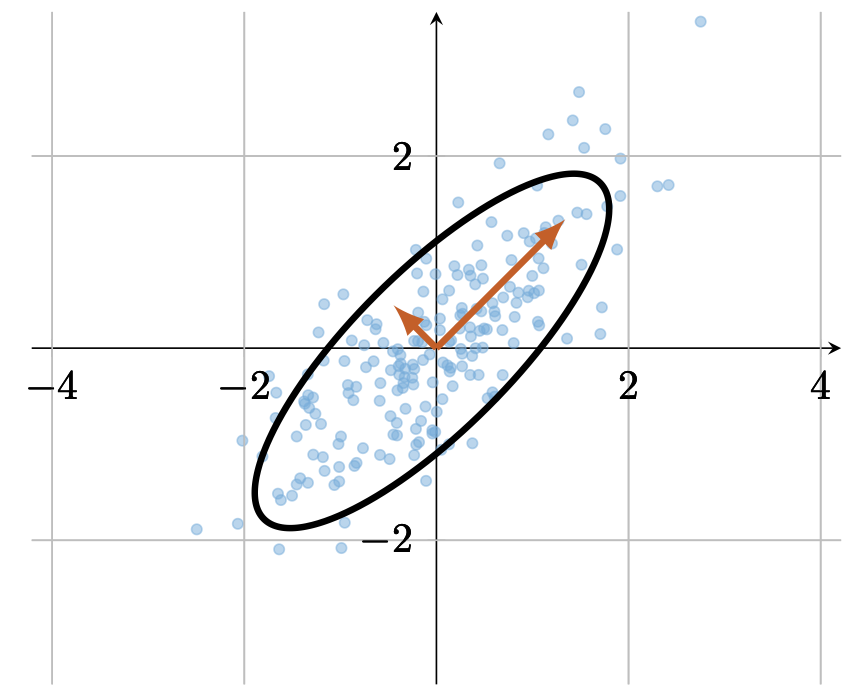
Major and minor axes of the ellipse described by the data covariance.
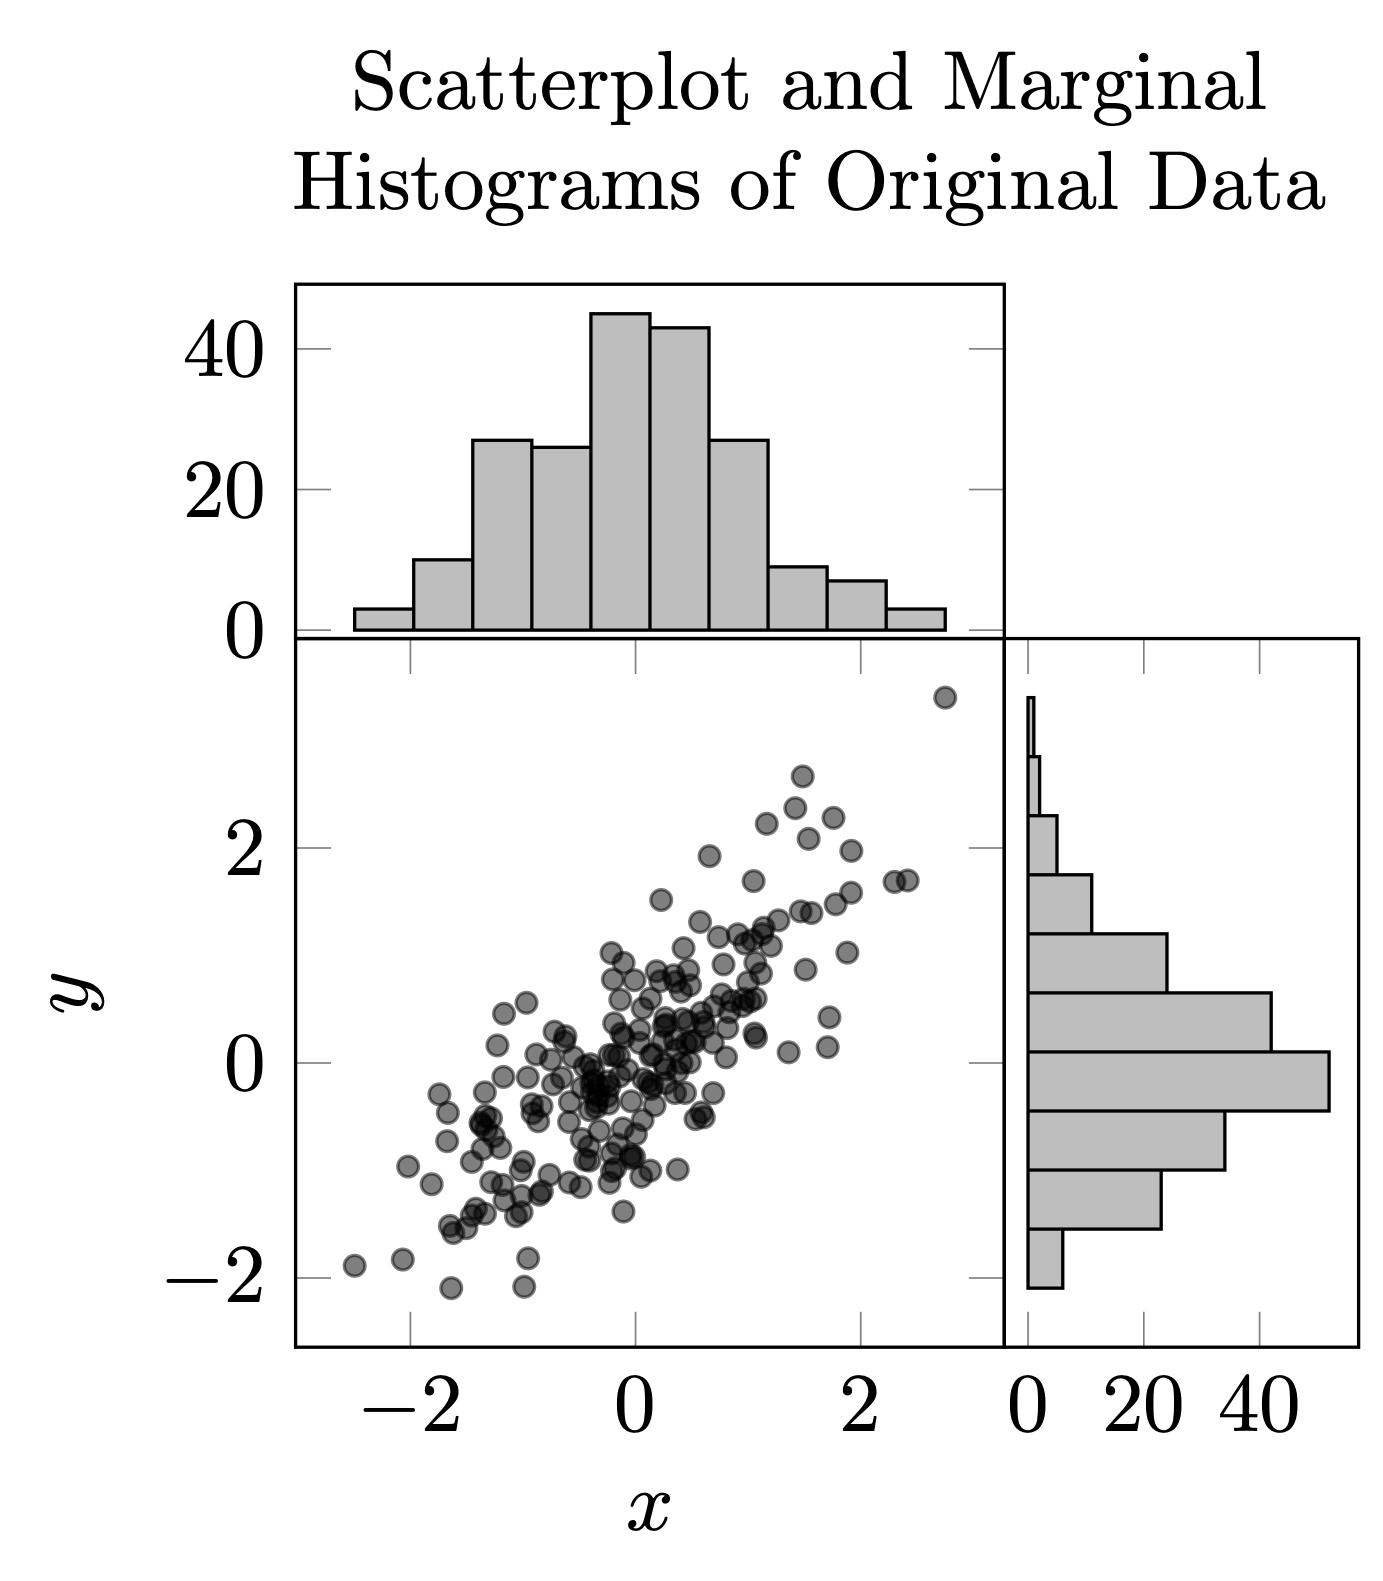
Marginal histograms.

Rotation in 3D.

Bivariate normal distribution.
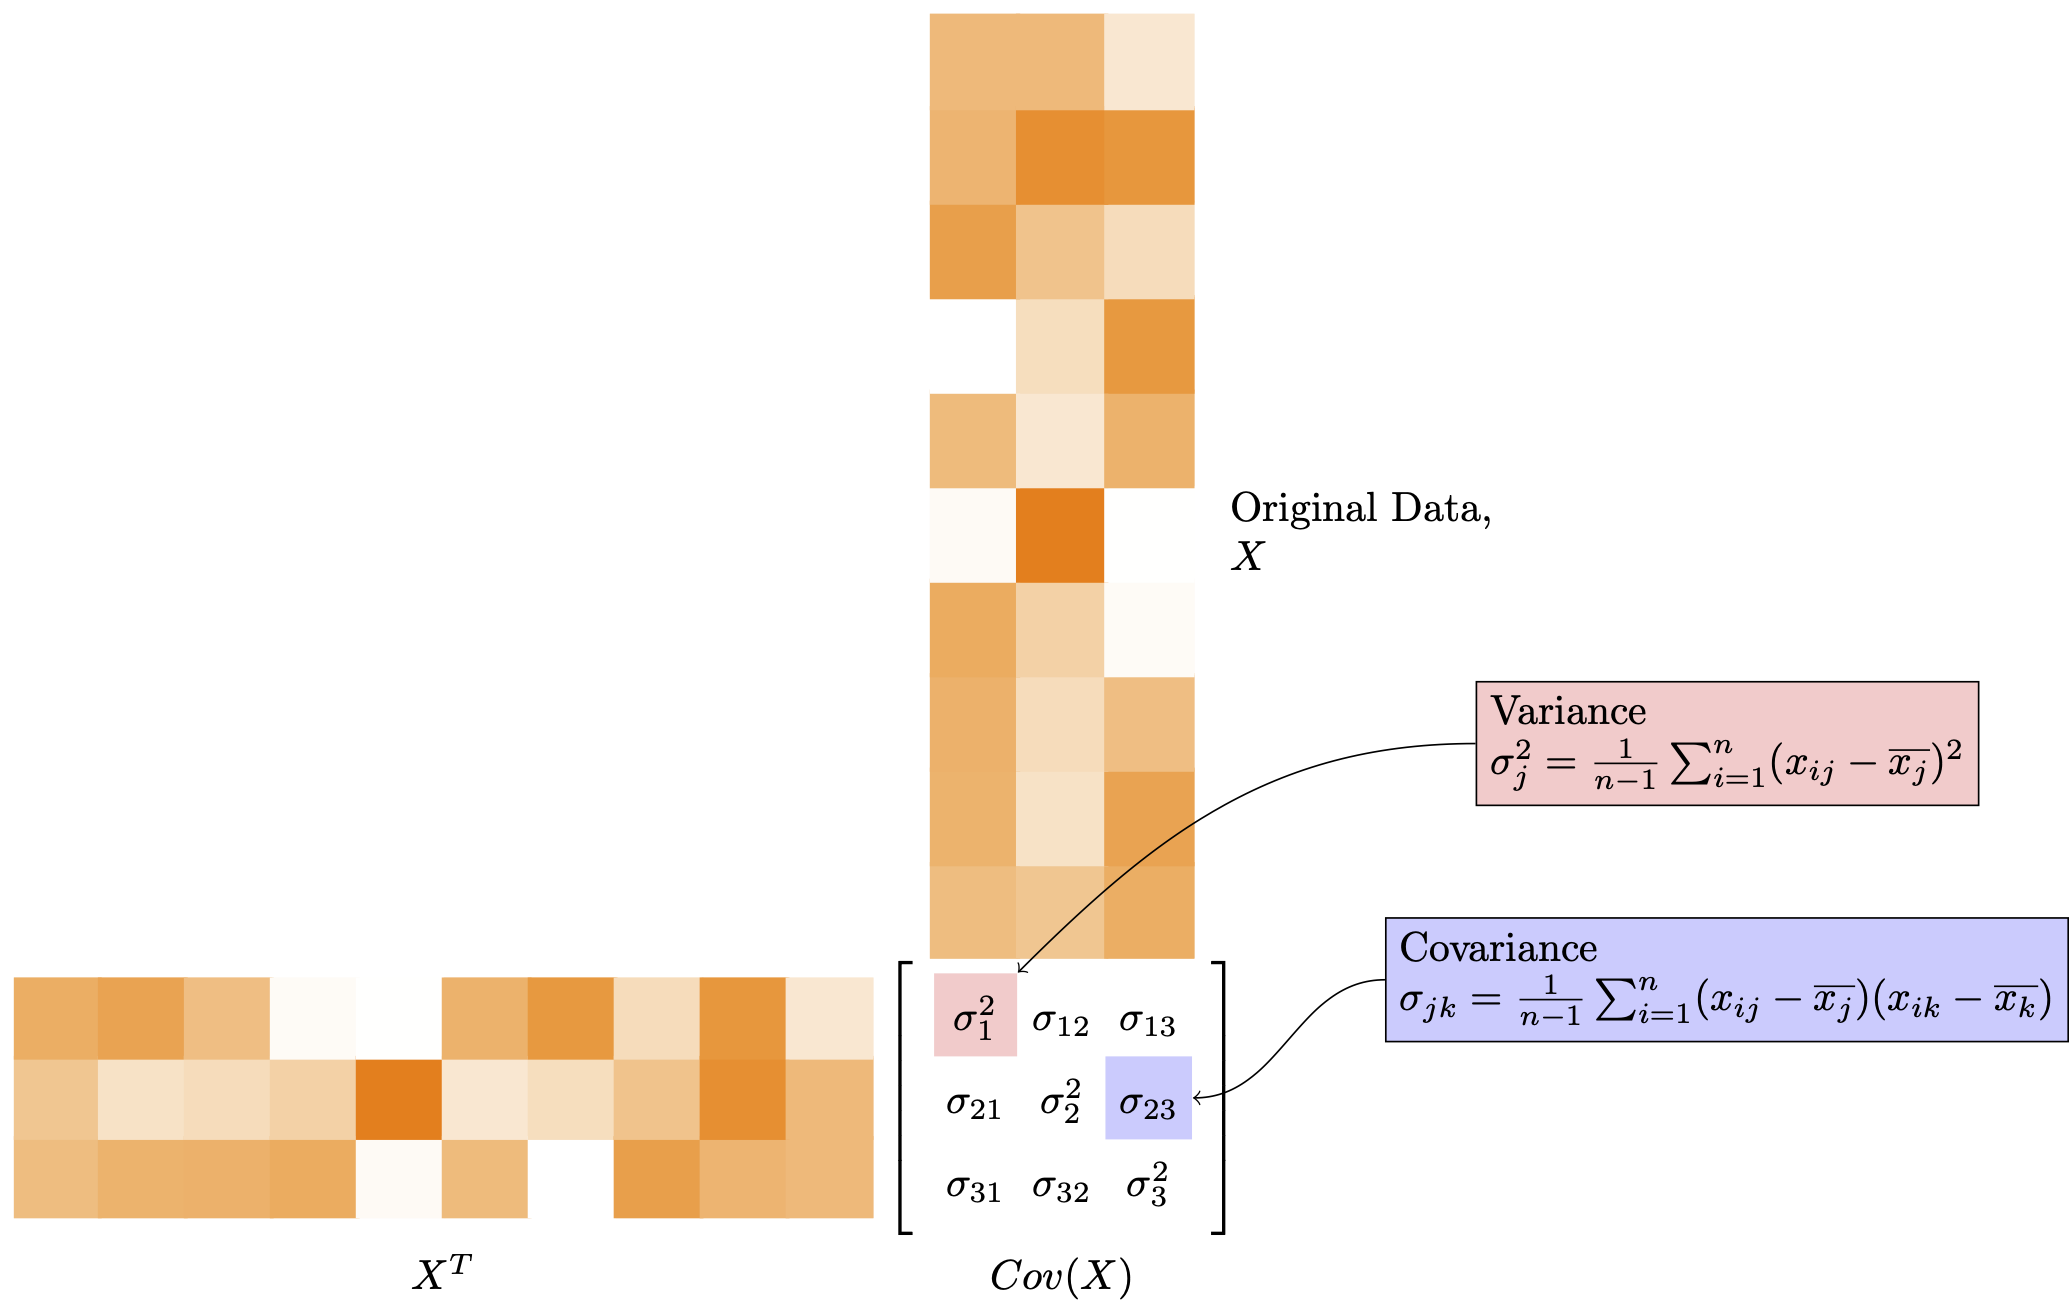
Diagram of a covariance matrix.
* I think this one may have compilation issues, just fair warning.

A log-likelihood with an inclusive boundary.

Samples that are epsilon/sqrt(n) away from their limits, -theta to theta.

A ternary tree.

Graph traversal.

A table from a paper by Frangakis and Rubin on principal stratification.

Censoring due to death dependent on posttreatment.

Stratified interference.

Different causal estimators in the presence of partial/stratified interference.