Source code for building Grafana dashboards with Prometheus datasource to expose
metrics gathered by Kamon 2.x.
All dashboards have the following variables:
- PROMETHEUS_DS: available Prometheus datasources.
- job: Prometheus jobs with Kamon instrumentation. Multiple selections is enabled.
- instance: Prometheus instances belonging to the selected jobs.
- interval: interval time to use in the queries: 30s, 1m, 2m, 5m, 10m, 30m, 1h, 6h, 12h, 1d, 7d, 14d, 30d.
Jobs and instances are in Prometheus terms.
The Prometheus datasources will be detected and listed automatically on the variable PROMETHEUS_DS.
If the app metrics follows the Prometheus convention for job and instance labels, the app will be listed automatically on the variable job as well as the associated instances on the variable instance. If you have other labels to identify your instances you will need to adapt the variable instance.
Published at Grafana as Kamon 2.x - System metrics dashboard
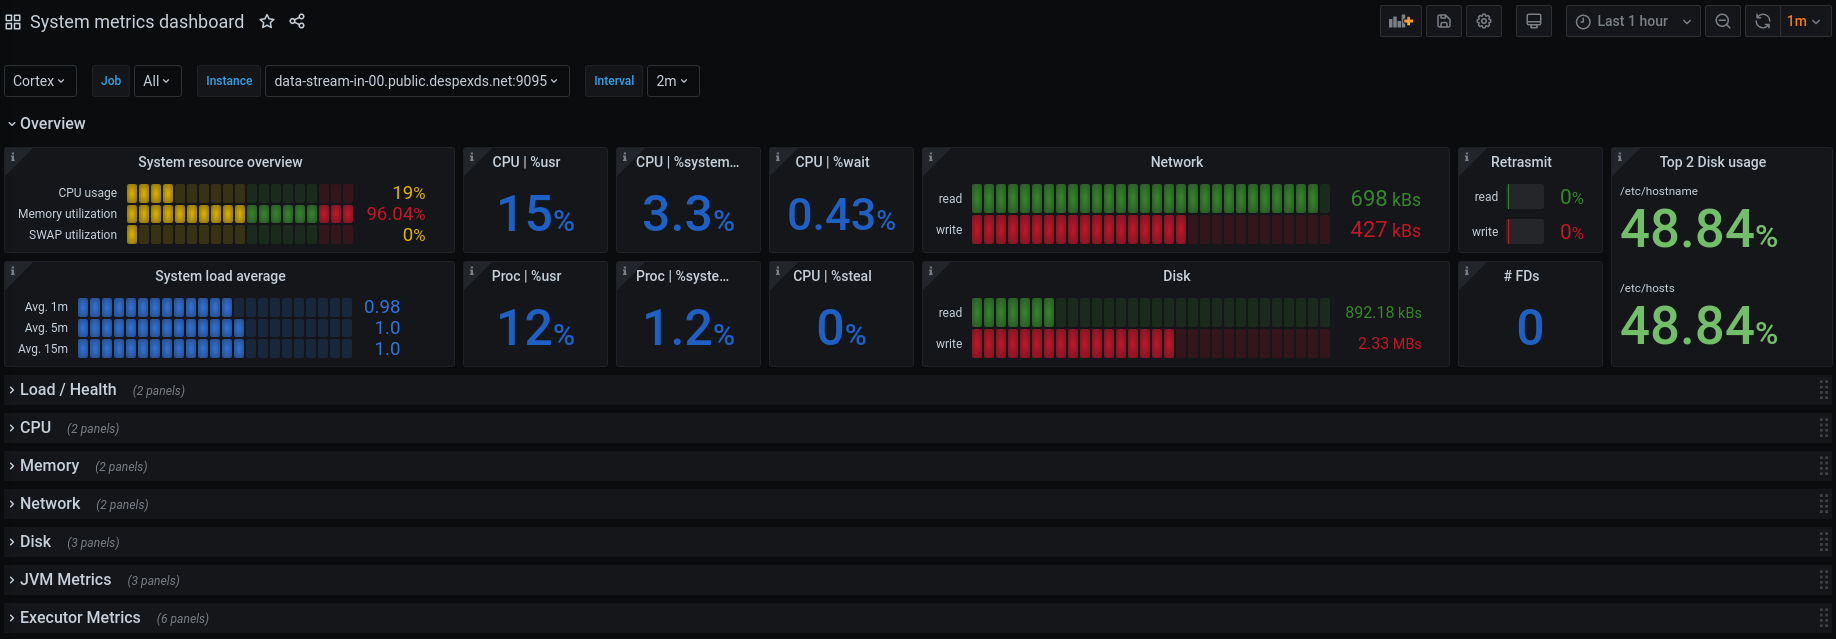
This dashboard shows both system metrics and JVM metrics for apps instrumented with Kamon 2.x using Prometheus.
It requires the apps to be instrumented with Kamon 2.x and kamon-system-metrics module.
The following sections are included:
- Resource overview: general system recources overview at the current moment.
- Load / Heatlh: System load avg. and vm hiccups.
- CPU: both at vm and process level.
- Memory: vm memory and SWAP.
- Network: in / out bound and failed packets.
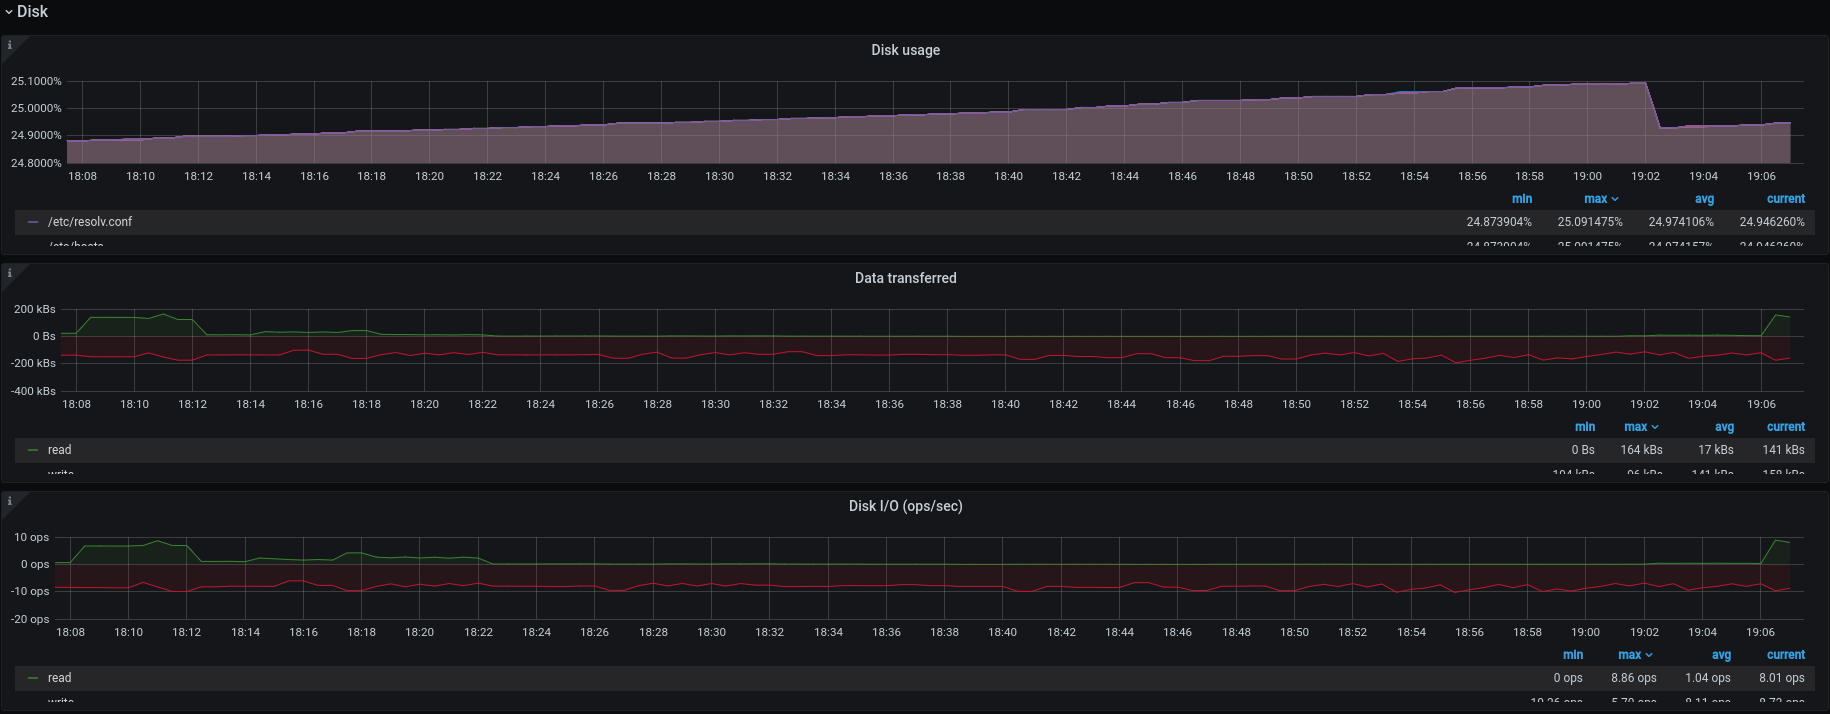
- Disk: space usage, data transferred and device operations.
- JVM metrics: heap, off heap and GC.
- Executor metrics: 6 graphs related to executor services.
Almost all metrics have a description.
Screenshots:
Published at Grafana as Kamon 2.x - API dashboard
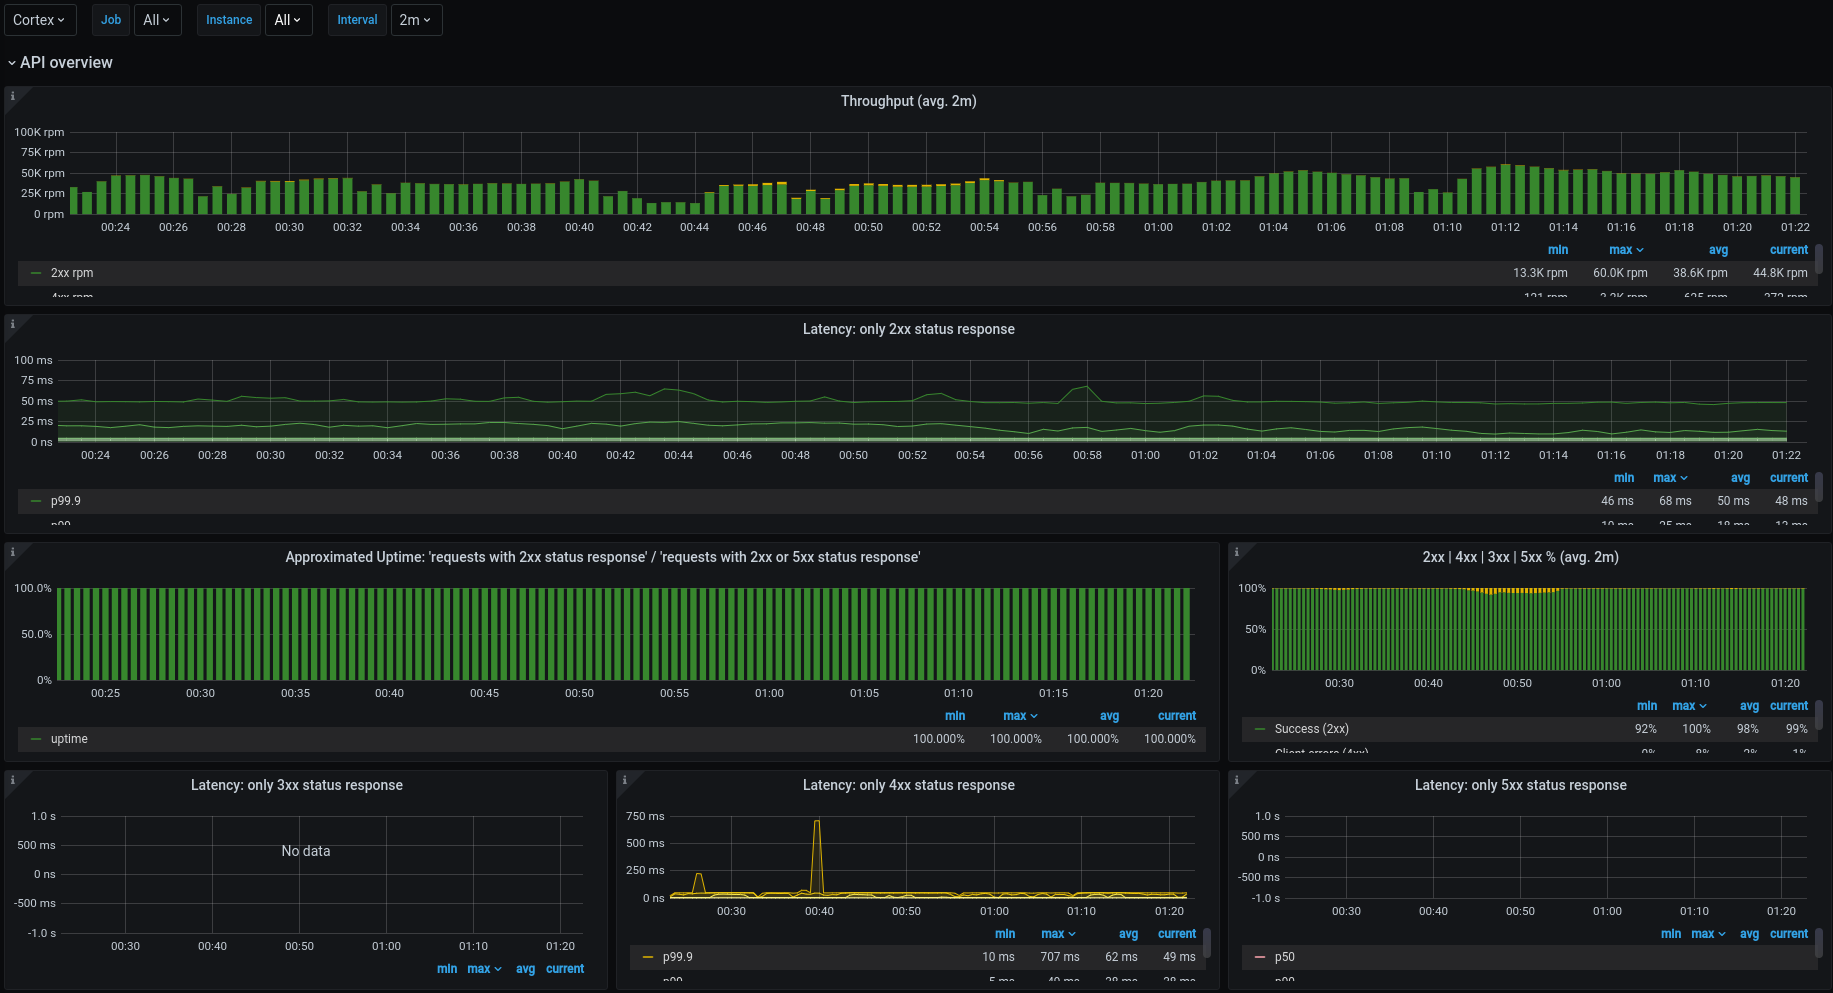
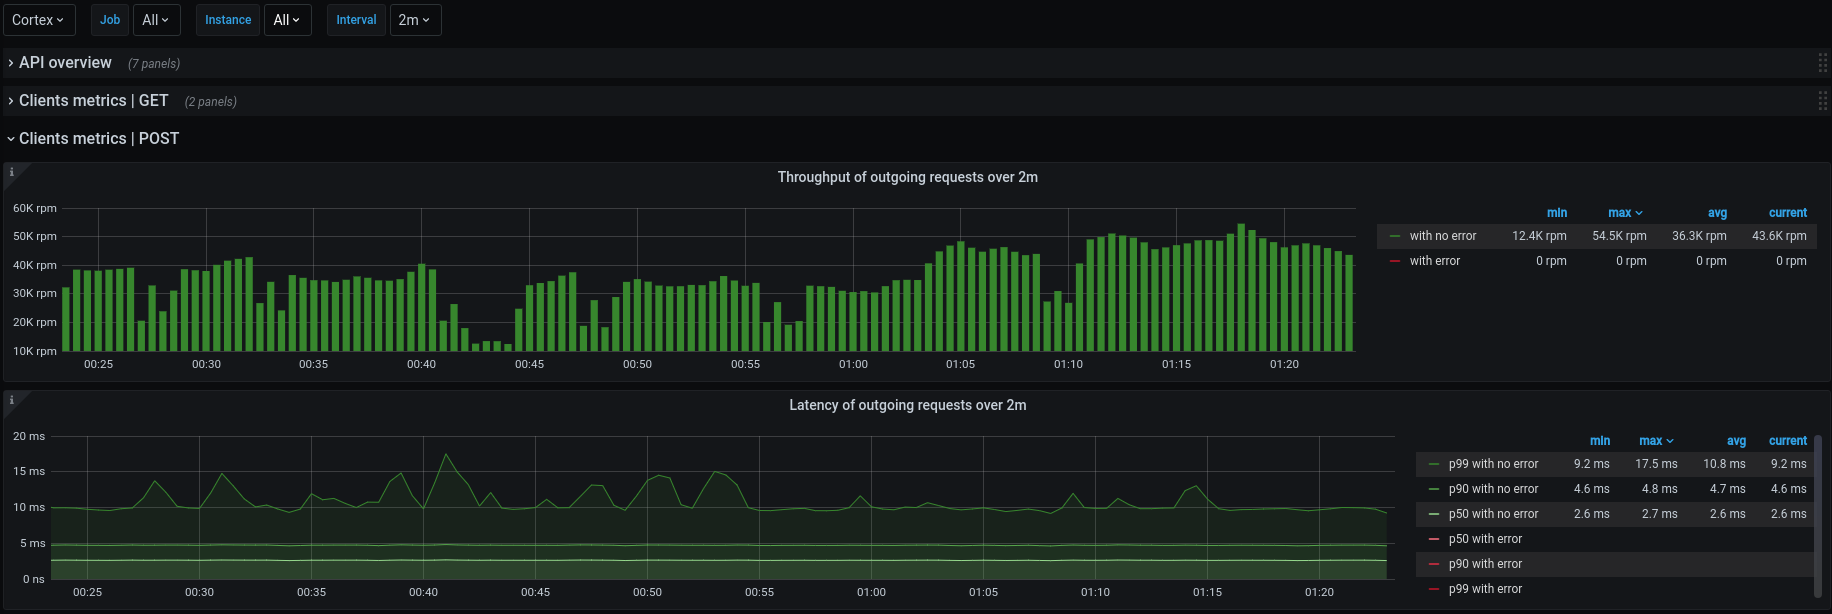
This dashboard shows metrics for both the server and client side.
It requires the apps to be instrumented with Kamon 2.x and any module with instrumentation for server and client side, such as kamon-akka-http and kamon-play.
The following sections are included:
- API overview: throughput and latency for server side by status.
- Client metrics: throughput and latency for client side. One row for each operation.
Almost all metrics have a description.
Required action for installing:
It requires an action at the first time is imported: specify a properly value for the hidden variable app_filter in order to be able to list the jobs with kamon instrumentation properly. An example:
Suppose you have the apps app-1, app-2 and app-3 instrumented with Kamon and they are scrapped by Prometheus using jobs with the same names, so there have to be the jobs app-1, app-2 and app-3 on Prometheus. In this case, a good value for the custom variable app_filter would be app-1.*|app-2.*|app-3.*. Take in account that this value will be used to load the query variable job whose query expression is label_values(up{job=~"$app_filter"}, job).
Screenshots:
- Make sure you have Jsonnet and GNU Make installed.
- Clone this repo and initialize the submodule (depends on Grafonnet-lib):
git clone git@github.com:cspinetta/kamon-grafana-dashboards.git
git submodule init
git submodule update- Go to directory
jsonnet. - Execute
maketo build all dashboards.
Jsons of dashboards will be placed at ./jsonnet/out/grafana
- Tests the jsonnets are properly formatted.
make test- Formats jsonnet files.
make fix-fmt


