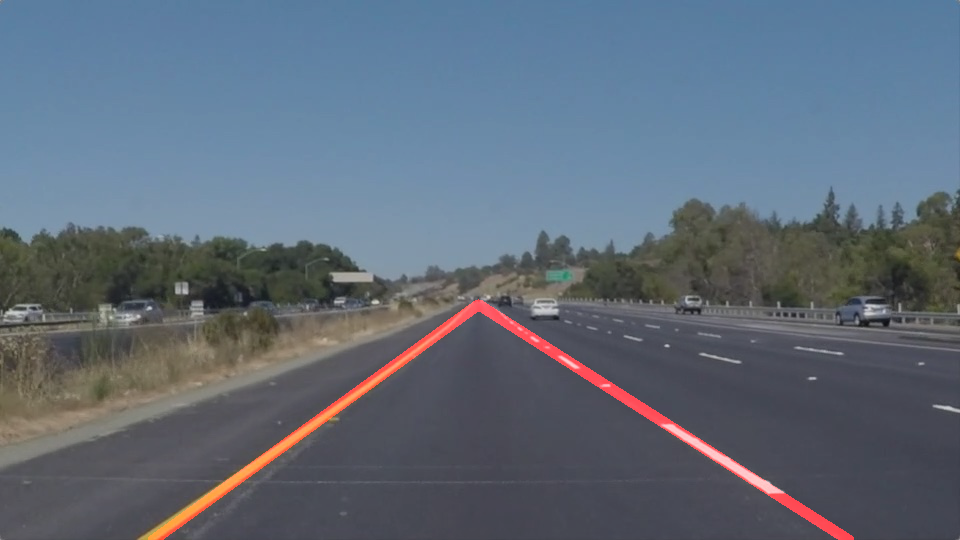
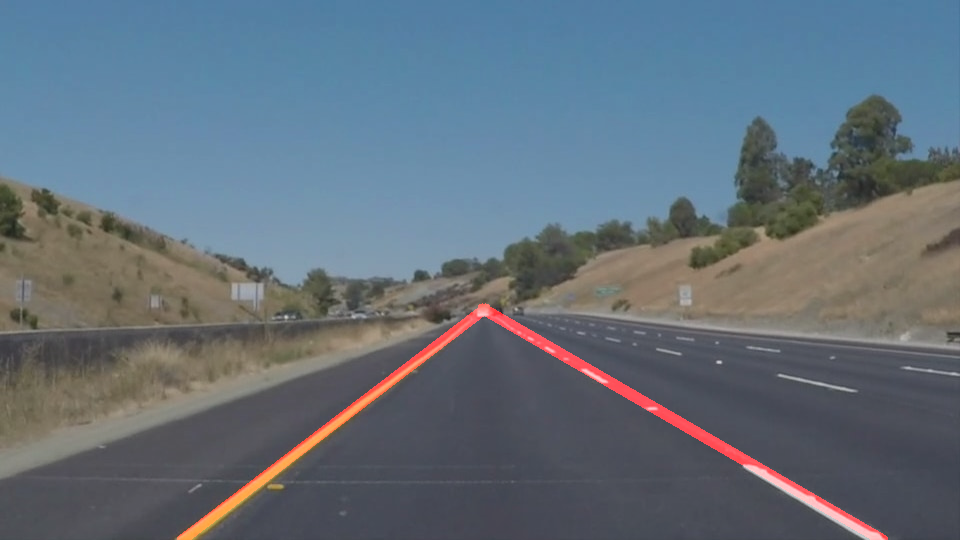
Finding Lane Lines on the Road
The goals / steps of this project are the following:
- Make a pipeline that finds lane lines on the road
- Reflect on your work in a written report
The objective of the pipeline was to perfom image transformations that would highlight lane lines.
The tools considered for this project where:
- Color Selection
- Region of Interest Selection
- Grayscaling
- Gaussian Smoothing
- Canny Edge Detection
- Hough Transform Line Detection
The final implementation of the pipeline consisted of 5 steps. Each step feed-forward into the subsequent step:
Convert an input image into grayscale to facilitate edge detection
A gaussian blur is applied with a kernel size of 7 to denoise the image. It effectively desharpens some edges, which improves edge detenction for noticeable edges.
Canny Edges are detected using a low threshold for the gradient of 60 and a ratio of 1:3 with the high threshold.
The image is delimited to the primary horizon line perspective in a vehicle. It removes 10% of the image on the horizontal axis at the bottom from both sides. The apex or intersection is set at the middle point of the image.
Hough Lines are detected with the following parameters:
- an distance resoultion of 2px
- and angular distance of pi/180 radians
- an occurrence threshold of 10
- a minimum line length of 40
- a maximum line gap with three strategies decreasing in aggressivess: 20, 30 (1.5x), 40 (2x)
Regular Hough transform line detection are then extracted, which should produce a set of sparse lines through the image.
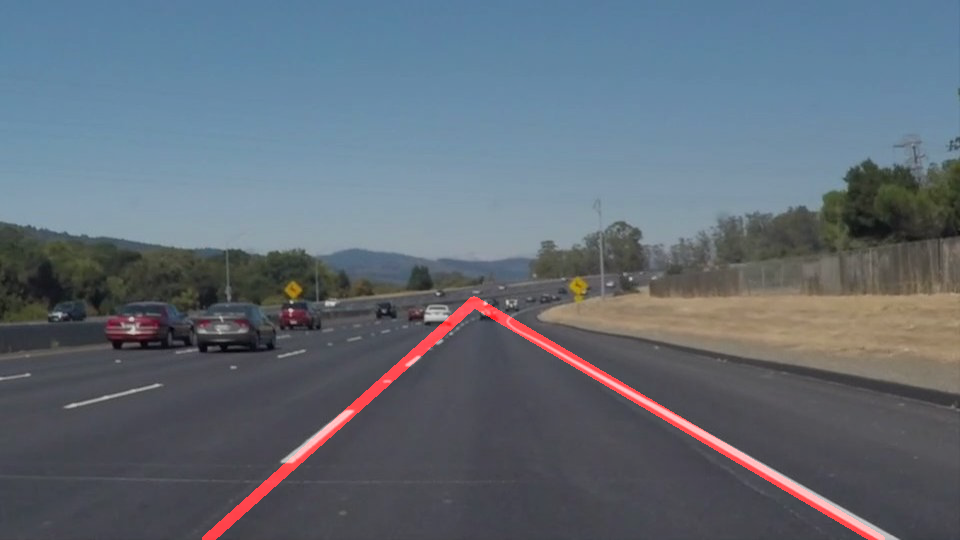
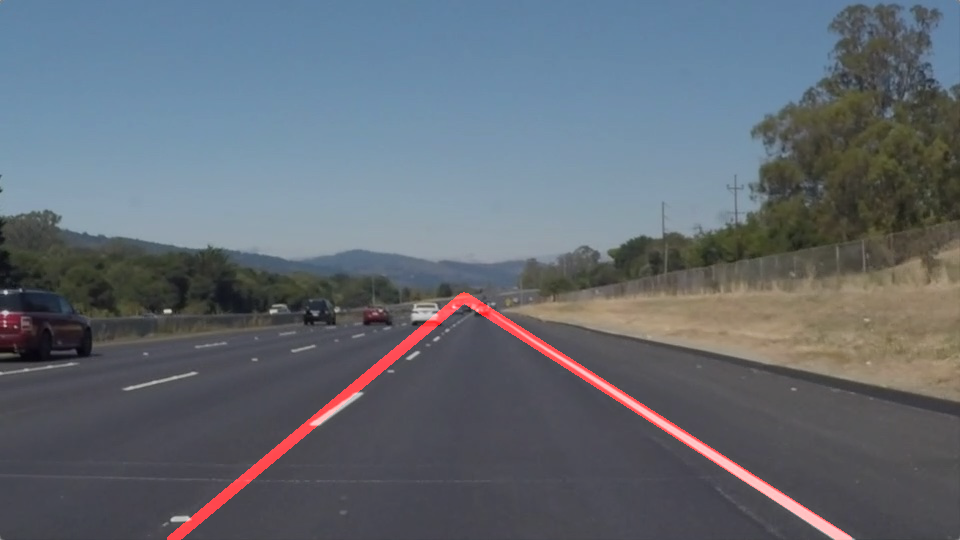
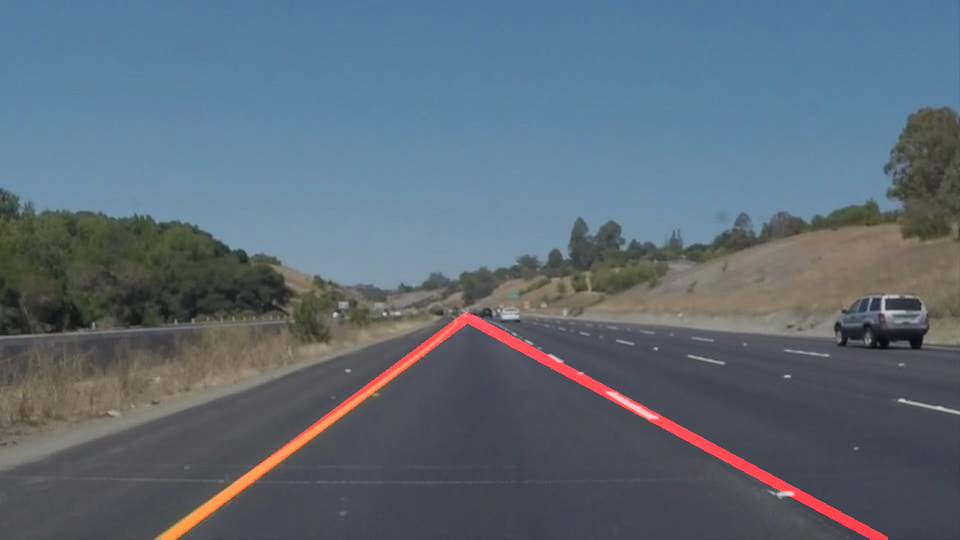
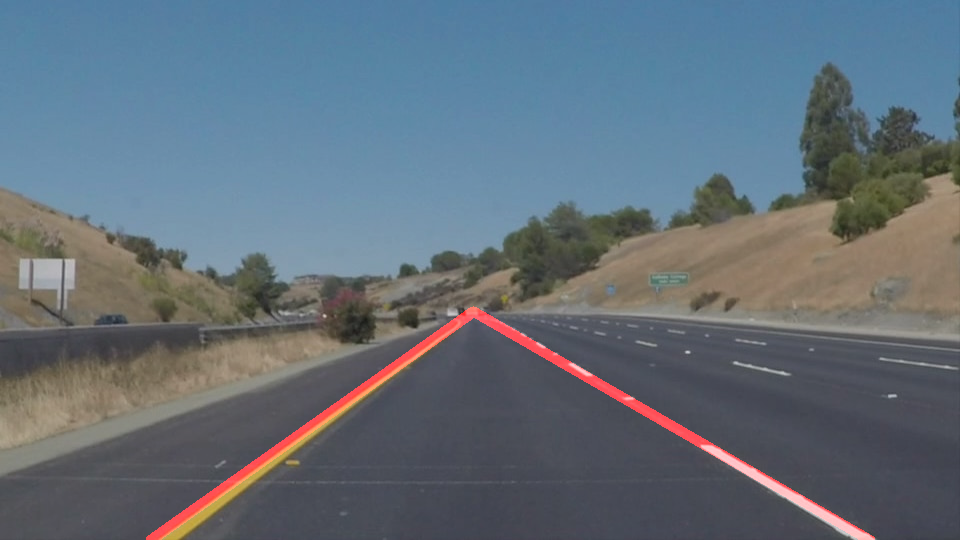
In order to produce two solid lines, the pipeline then computes the mean line for each left and right lane, and extrapolates them to their intersection point. This is based on the assumption that left lines have a negative slope (from the top right corner) and right lines have a positive slope.
It must be noted that any line with a slope less than -0.3 was not included, which should equate to about 16 degrees.
If mean lines are successfully computed, then the pipeline proceeds to draw the lines on the image. However, if the Hough Line detection is too aggresive, the process above is repected with the next maximum line gap strategy as this allows for smaller lines to be detected.
There are a number of shortcomings with the implementation of the pipeline.
First, the region of interest calculation largely assumes no curvature in the lanes, otherwise it would likely crop a portion of the right or left curvature.
Second, the algorithm to compute mean lines extrapolates the lines to their natural intersection point, which would fail with curved lines as well.
A possible improvement would be to count the number of points that Hough lines have on the x-axis for each pixel on the y-axis. Then for each side (left and right) a mean value can be obtained for each y-axis pixel rather than establishing an overall mean from the image.
