Build a Traffic Sign Recognition Project
The goals / steps of this project are the following:
- Load the data set (see below for links to the project data set)
- Explore, summarize and visualize the data set
- Design, train and test a model architecture
- Use the model to make predictions on new images
- Analyze the softmax probabilities of the new images
- Summarize the results with a written report
More details on the instructions for this project can be found here.
The sections below will dicsuss the details of my implementation of each requirement in the rubric points.
1. Provide a Writeup / README that includes all the rubric points and how you addressed each one. You can submit your writeup as markdown or pdf. You can use this template as a guide for writing the report. The submission includes the project code.
You're reading it! and here is a link to my project code
1. Provide a basic summary of the data set. In the code, the analysis should be done using python, numpy and/or pandas methods rather than hardcoding results manually.
I used the numpy built-in functions to calculate summary statistics of the traffic signs data set:
- Number of training examples = 34799
- Number of testing examples = 12630
- Number of validation examples = 4410
- Image data shape = (32, 32, 3)
- Number of classes = 43
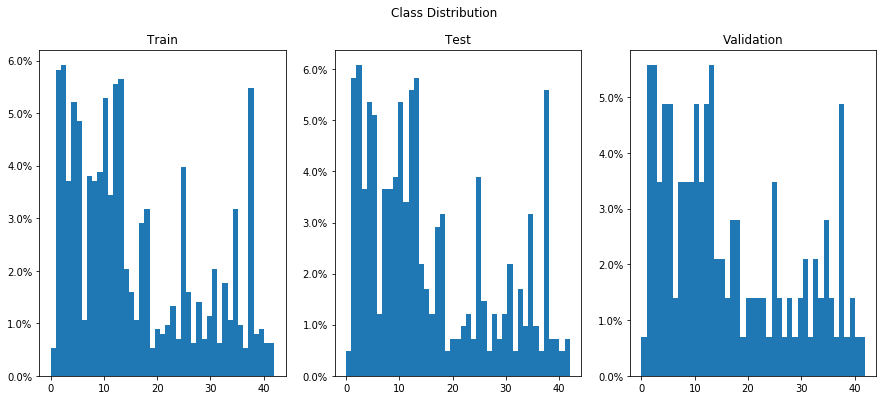
The first step in analyzing the data is to determine whether the train, validation and test sets have a similar distribution of samples across all classes. Below is a histogram normalized to 100% to reflect the composition of each set.
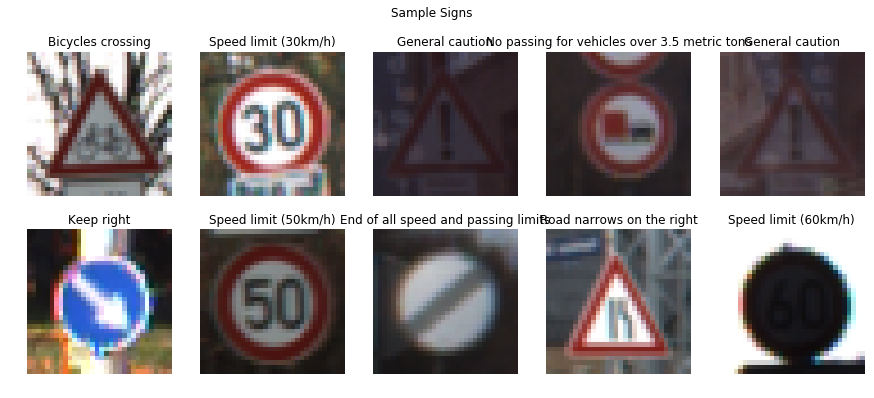
Then, to obtain a better idea as to the types of signs, I plotted several signs at random first. Then observed at least 2 pictures per sign to assess general similarity between to random pictures of the same type.
1. Describe how you preprocessed the image data. What techniques were chosen and why did you choose these techniques? Consider including images showing the output of each preprocessing technique. Pre-processing refers to techniques such as converting to grayscale, normalization, etc.
As a first step, I decided to convert the images to grayscale because it provides an average across the 3 RGB channels.
Furthermore, I normalized the grayscale image to bound image values between -1 and 1. This makes it for the optimizer in a neural network to reach a minimum.
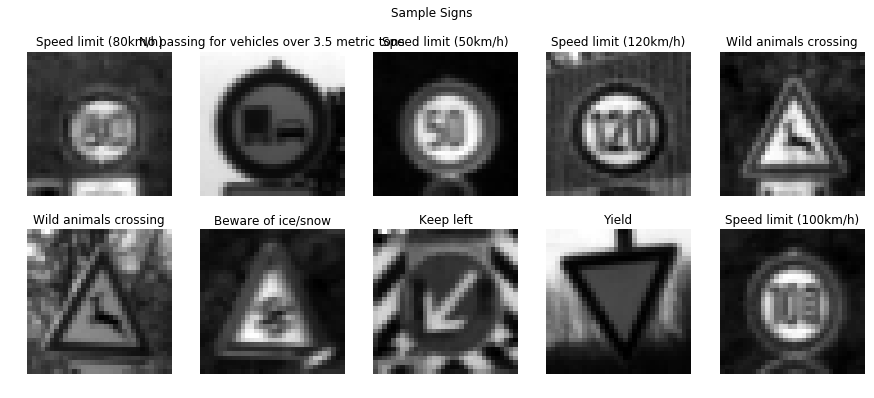
Below is a sample of signs after grayscaling and normalization.
Finally, since I implemented the model in Keras as well, the labels for each dataset had to be one-hot-encoded.
2. Describe what your final model architecture looks like including model type, layers, layer sizes, connectivity, etc.) Consider including a diagram and/or table describing the final model.
In terms of architecture, I implemented LeNet using both Tensorflow and Keras. Personally, I find Keras to be much more efficient based on the version of Tensorflow required for this project.
My final model consisted of the following layers:
| Layer (type) | Output Shape | Param # |
|---|---|---|
| conv2d_1 (Conv2D) | (None, 28, 28, 6) | 156 |
| max_pooling2d_1 (MaxPooling2 | (None, 14, 14, 6) | 0 |
| conv2d_2 (Conv2D) | (None, 10, 10, 16) | 2416 |
| max_pooling2d_2 (MaxPooling2 | (None, 5, 5, 16) | 0 |
| flatten_1 (Flatten) | (None, 400) | 0 |
| dropout_1 (Dropout) | (None, 400) | 0 |
| dense_1 (Dense) | (None, 120) | 48120 |
| dense_2 (Dense) | (None, 84) | 10164 |
| dropout_2 (Dropout) | (None, 84) | 0 |
| dense_3 (Dense) | (None, 43) | 3655 |
Total params: 64,511 Trainable params: 64,511 Non-trainable params: 0
3. Describe how you trained your model. The discussion can include the type of optimizer, the batch size, number of epochs and any hyperparameters such as learning rate.
To train the model, I used the following configuration:
- Optimizer: ADAM
- Loss Function: categorical_crossentropy
- Metrics: Accuracy
- Number of epochs: 10
- Batch Size: 64
- Shuffle: True (Shuffle between Epochs)
4. Describe the approach taken for finding a solution and getting the validation set accuracy to be at least 0.93. Include in the discussion the results on the training, validation and test sets and where in the code these were calculated. Your approach may have been an iterative process, in which case, outline the steps you took to get to the final solution and why you chose those steps. Perhaps your solution involved an already well known implementation or architecture. In this case, discuss why you think the architecture is suitable for the current problem.
My final model results were:
- training set accuracy of 91.8%
- validation set accuracy of 95.5%
- test set accuracy of 93.5%
Architecture Iterations:
- First, I started with a Tensorflow implementaion of LeNet as per the class lectures
- Given, how long it took to train, I implemented the same model in Keras
- In both models, I noticed great performance in the training set, but mild performance in the validation set.
- Since this is a sign of overfitting, I decided to add two dropout layers after flattening from the Convolutional layers and after the Dense layers.
- The model performance decrease a little for the training set, but vastly improved on the validation set.
1. Choose five German traffic signs found on the web and provide them in the report. For each image, discuss what quality or qualities might be difficult to classify.
Here are five German traffic signs that I found on the web:
The first image might be difficult to classify because of the half-light/half-dark background, which will influence the grayscale component of the image.
The second image will be very simple to classify as it very similar to a the output of a preprocessed image.
The third image will be very simple to classify as it a very standard picture of a stop sign.
The fourth image will be easier to classify versus image 1. The background contrasts very sharply with the sign is of a consistent pattern.
The fifth image will be mildly difficult to classify given the high saturation of the image.
2. Discuss the model's predictions on these new traffic signs and compare the results to predicting on the test set. At a minimum, discuss what the predictions were, the accuracy on these new predictions, and compare the accuracy to the accuracy on the test set
Here are the results of the prediction:
| Image | Prediction |
|---|---|
| Children crossing | Right-of-way at the next intersection |
| End of all speed and passing limits | End of all speed and passing limits |
| Stop | Stop |
| Beware of ice/snow | Beware of ice/snow |
| 120 km/h | Bicycles Crossing |
The model was able to correctly guess 3 of the 5 traffic signs, which gives an accuracy of 60%. This compares unfavourable to the accuracy on the test set of 93%
3. Describe how certain the model is when predicting on each of the five new images by looking at the softmax probabilities for each prediction. Provide the top 5 softmax probabilities for each image along with the sign type of each probability.
The model is very unsure as to the classification of this image - the top class is marginally better than flipping a coin. It must be noted that the second class with a probability of 21% is the correct classification.
- Label: Children crossing(28)
- Class: Right-of-way at the next intersection(11) - P= 0.52
- Class: Children crossing(28) - P= 0.21
- Class: Pedestrians(27) - P= 0.13
- Class: Roundabout mandatory(40) - P= 0.04
- Class: Ahead only(35) - P= 0.04
The model has a high degree of certainty for this sign - with a 98% probability allocated to the right label
- Label: End of all speed and passing limits(32)
- Class: End of all speed and passing limits(32) - P= 0.98
- Class: End of no passing(41) - P= 0.02
- Class: End of speed limit (80km/h)(6) - P= 0.00
- Class: Priority road(12) - P= 0.00
- Class: Go straight or right(36) - P= 0.00
The model has a high degree of certainty for this sign - with a 88% probability allocated to the right label
- Label: Stop(14)
- Class: Stop(14) - P= 0.88
- Class: Yield(13) - P= 0.08
- Class: Keep left(39) - P= 0.04
- Class: No vehicles(15) - P= 0.00
- Class: Turn right ahead(33) - P= 0.00
The model is 100% certain of the classification of this sign
- Label: Beware of ice/snow(30)
- Class: Beware of ice/snow(30) - P= 1.00
- Class: Slippery road(23) - P= 0.00
- Class: Bicycles crossing(29) - P= 0.00
- Class: Right-of-way at the next intersection(11) - P= 0.00
- Class: Children crossing(28) - P= 0.00
The model is very unsure as to the classification of this image - the top class is marginally better than flipping a coin. The correct classification only has an 11% probability allocated to it.
- Label: Speed limit (120km/h)(8)
- Class: Bicycles crossing(29) - P= 0.51
- Class: Children crossing(28) - P= 0.27
- Class: Speed limit (120km/h)(8) - P= 0.11
- Class: Bumpy road(22) - P= 0.08
- Class: No vehicles(15) - P= 0.01


