d3-contour
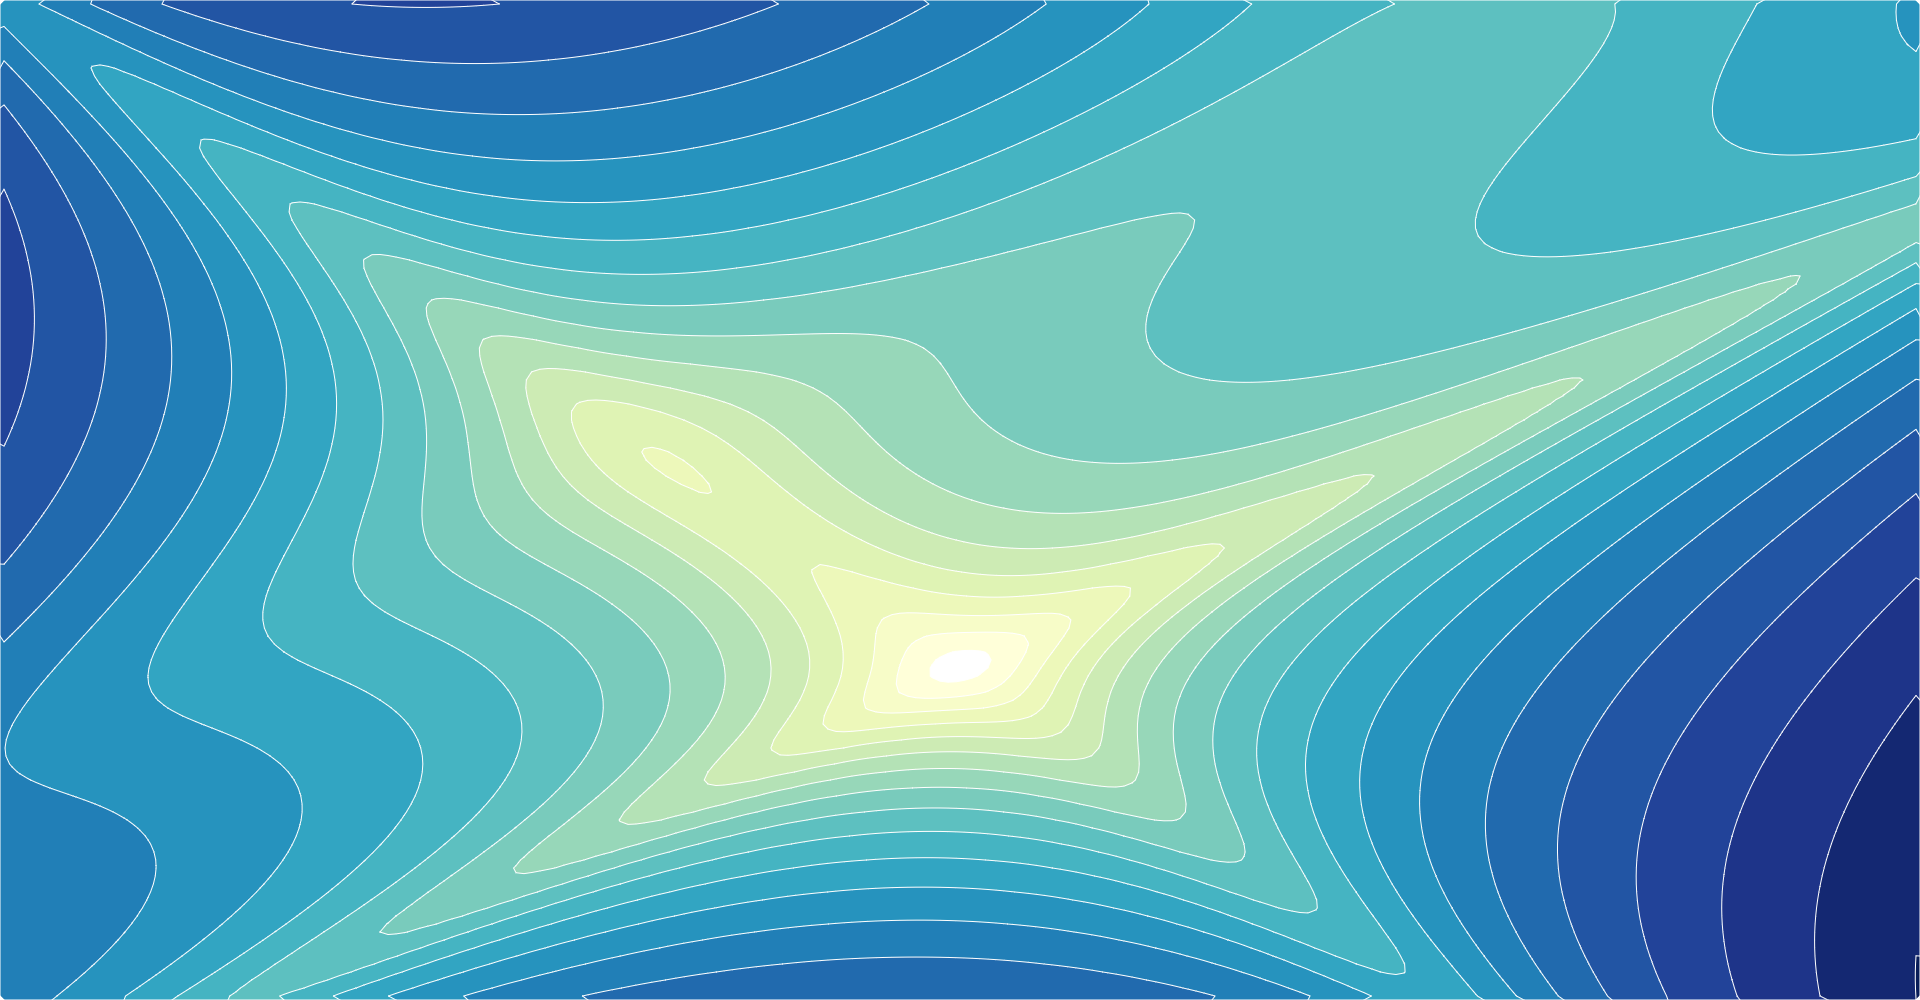
This library computes contour polygons by applying marching squares to a rectangular array of numeric values. For example, here is Maungawhau’s topology (the classic volcano dataset and terrain.colors from R):
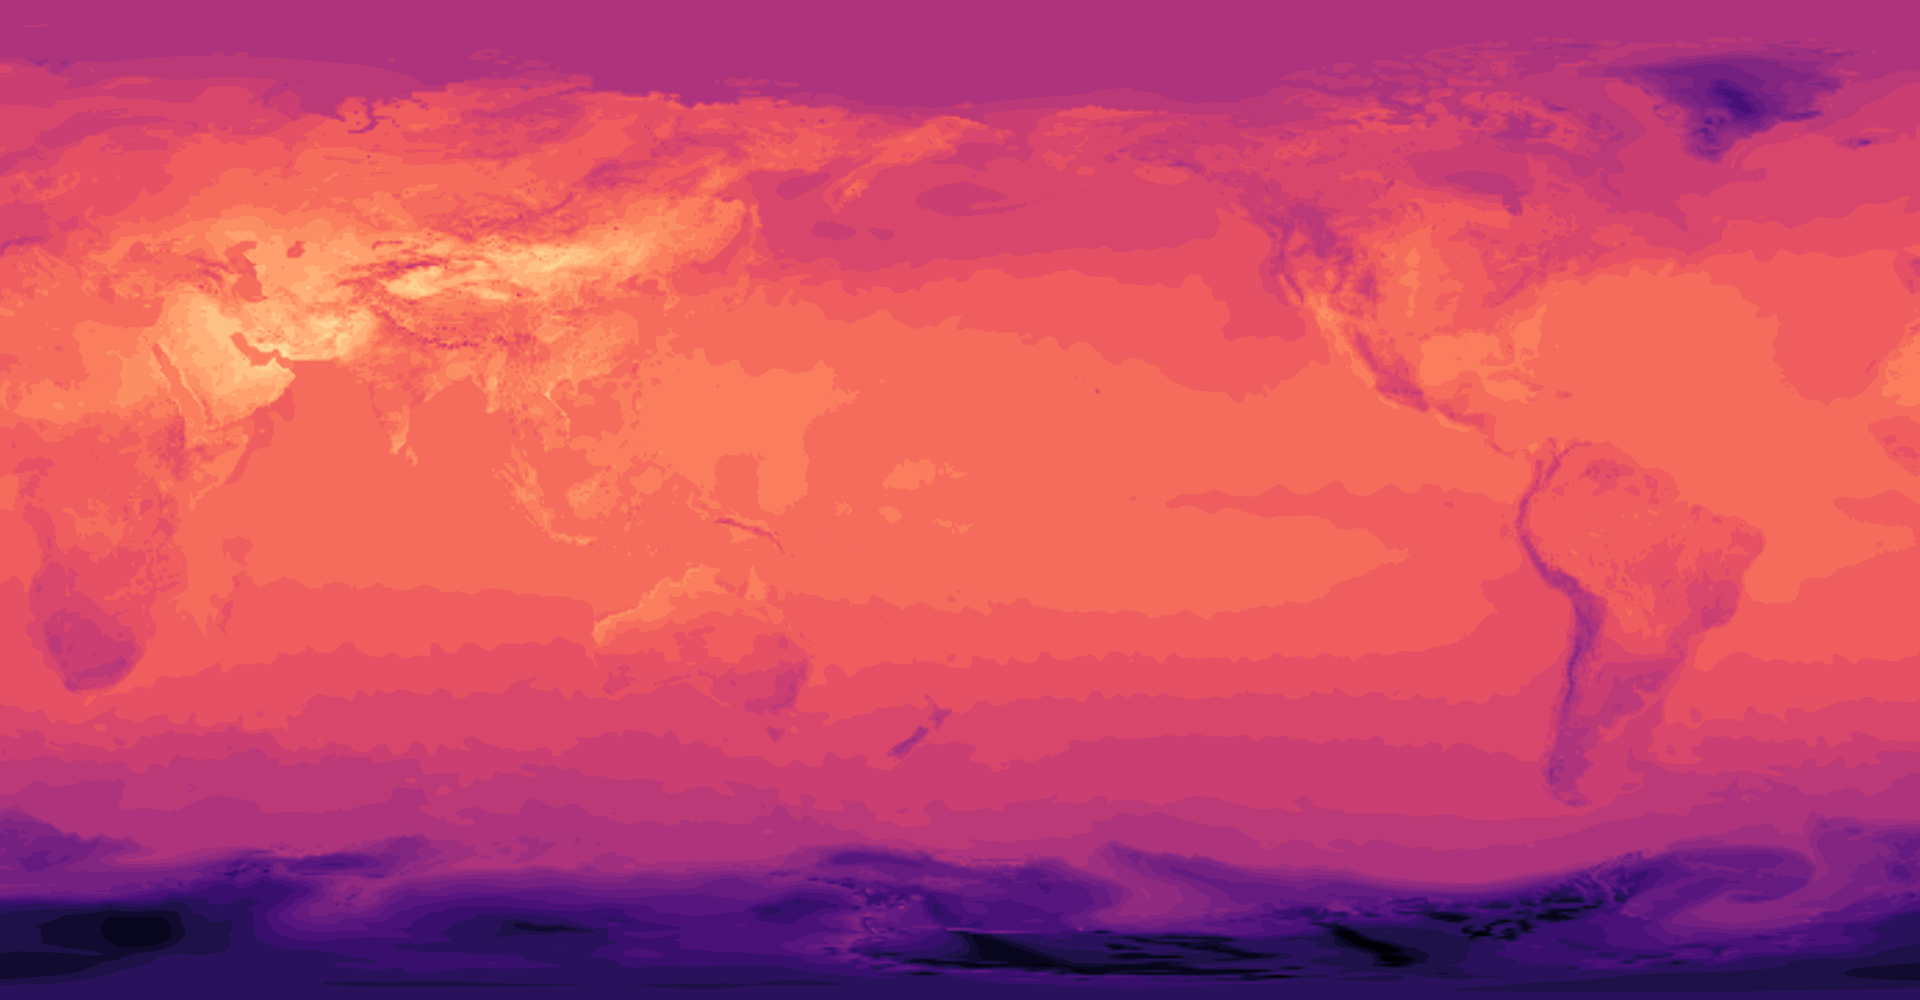
For each input threshold value, the contour generator constructs a GeoJSON MultiPolygon geometry object representing the area where the input values are greater than or equal to the threshold value. The geometry is in planar coordinates, where ⟨i + 0.5, j + 0.5⟩ corresponds to element i + jn in the input values array. Such datasets are commonly stored in the GeoTIFF format. Here is an example that loads a GeoTIFF of surface temperatures:
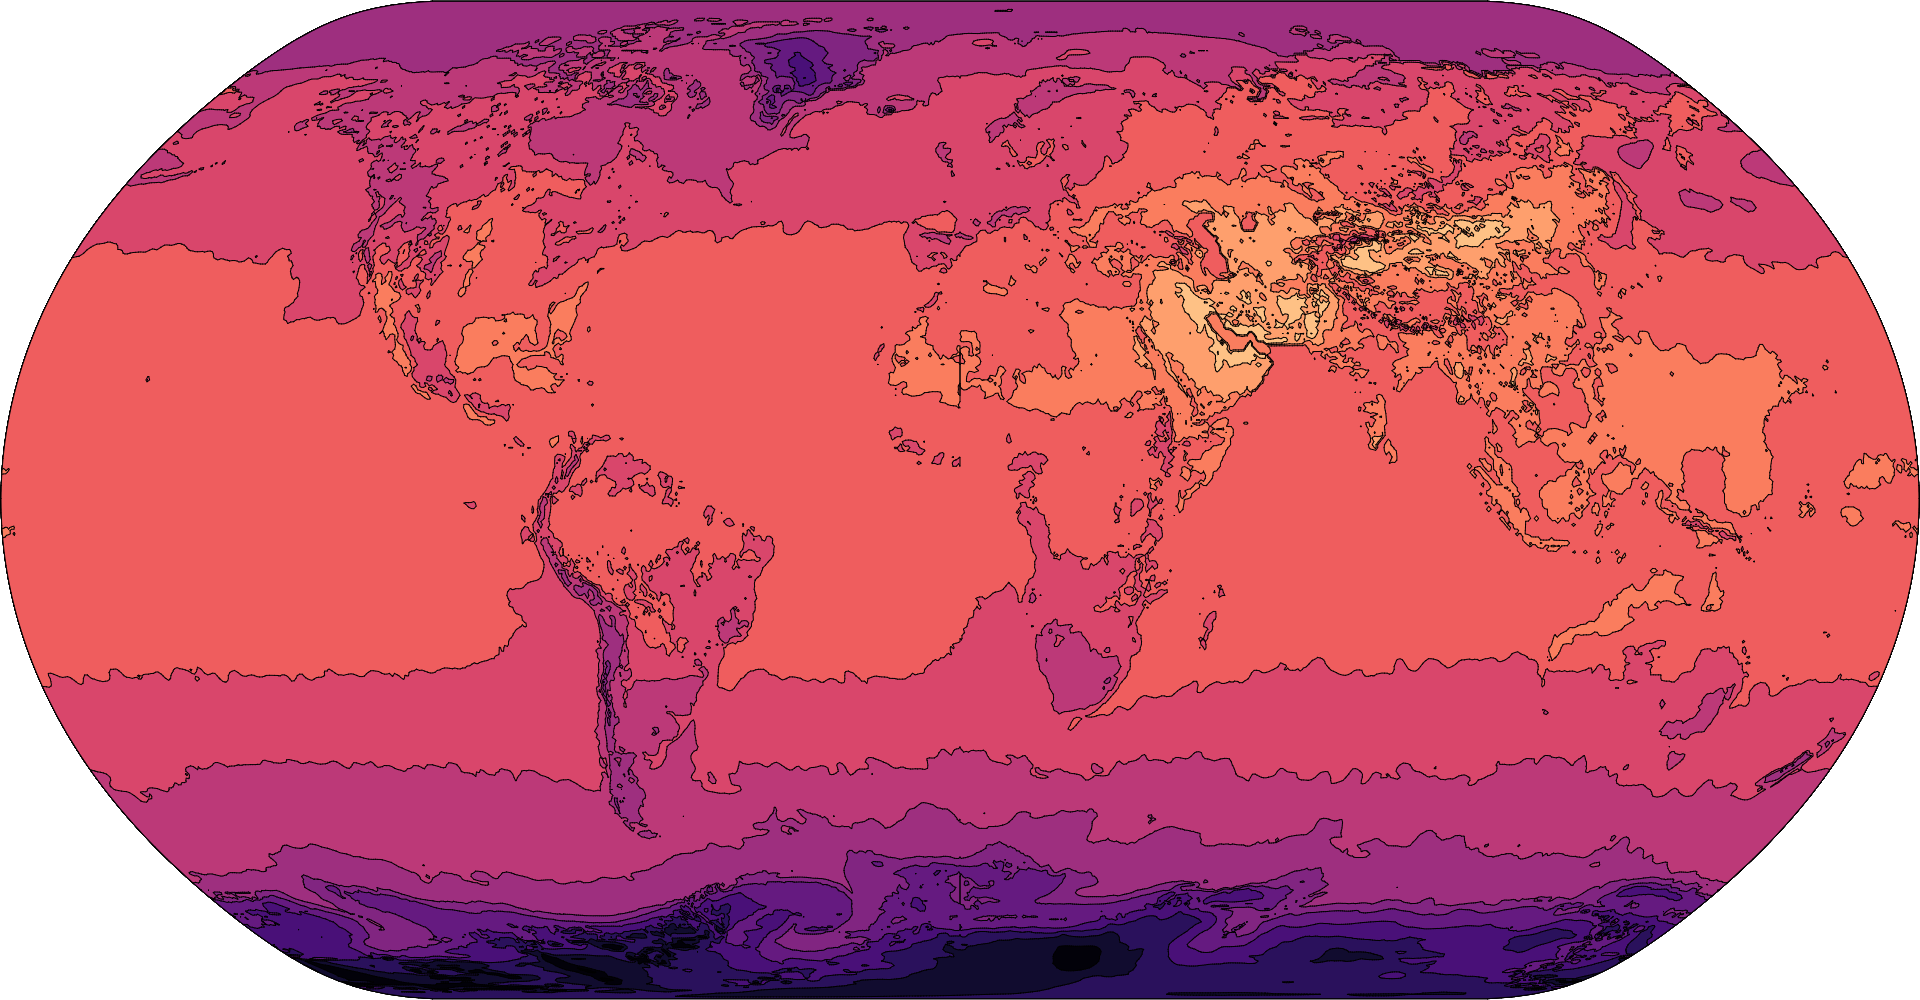
Since the contour polygons are GeoJSON, you can transform and display them using standard tools; see d3.geoPath, d3.geoProject and d3.geoStitch, for example. Here are the same contours of surface temperatures displayed in the Natural Earth projection:
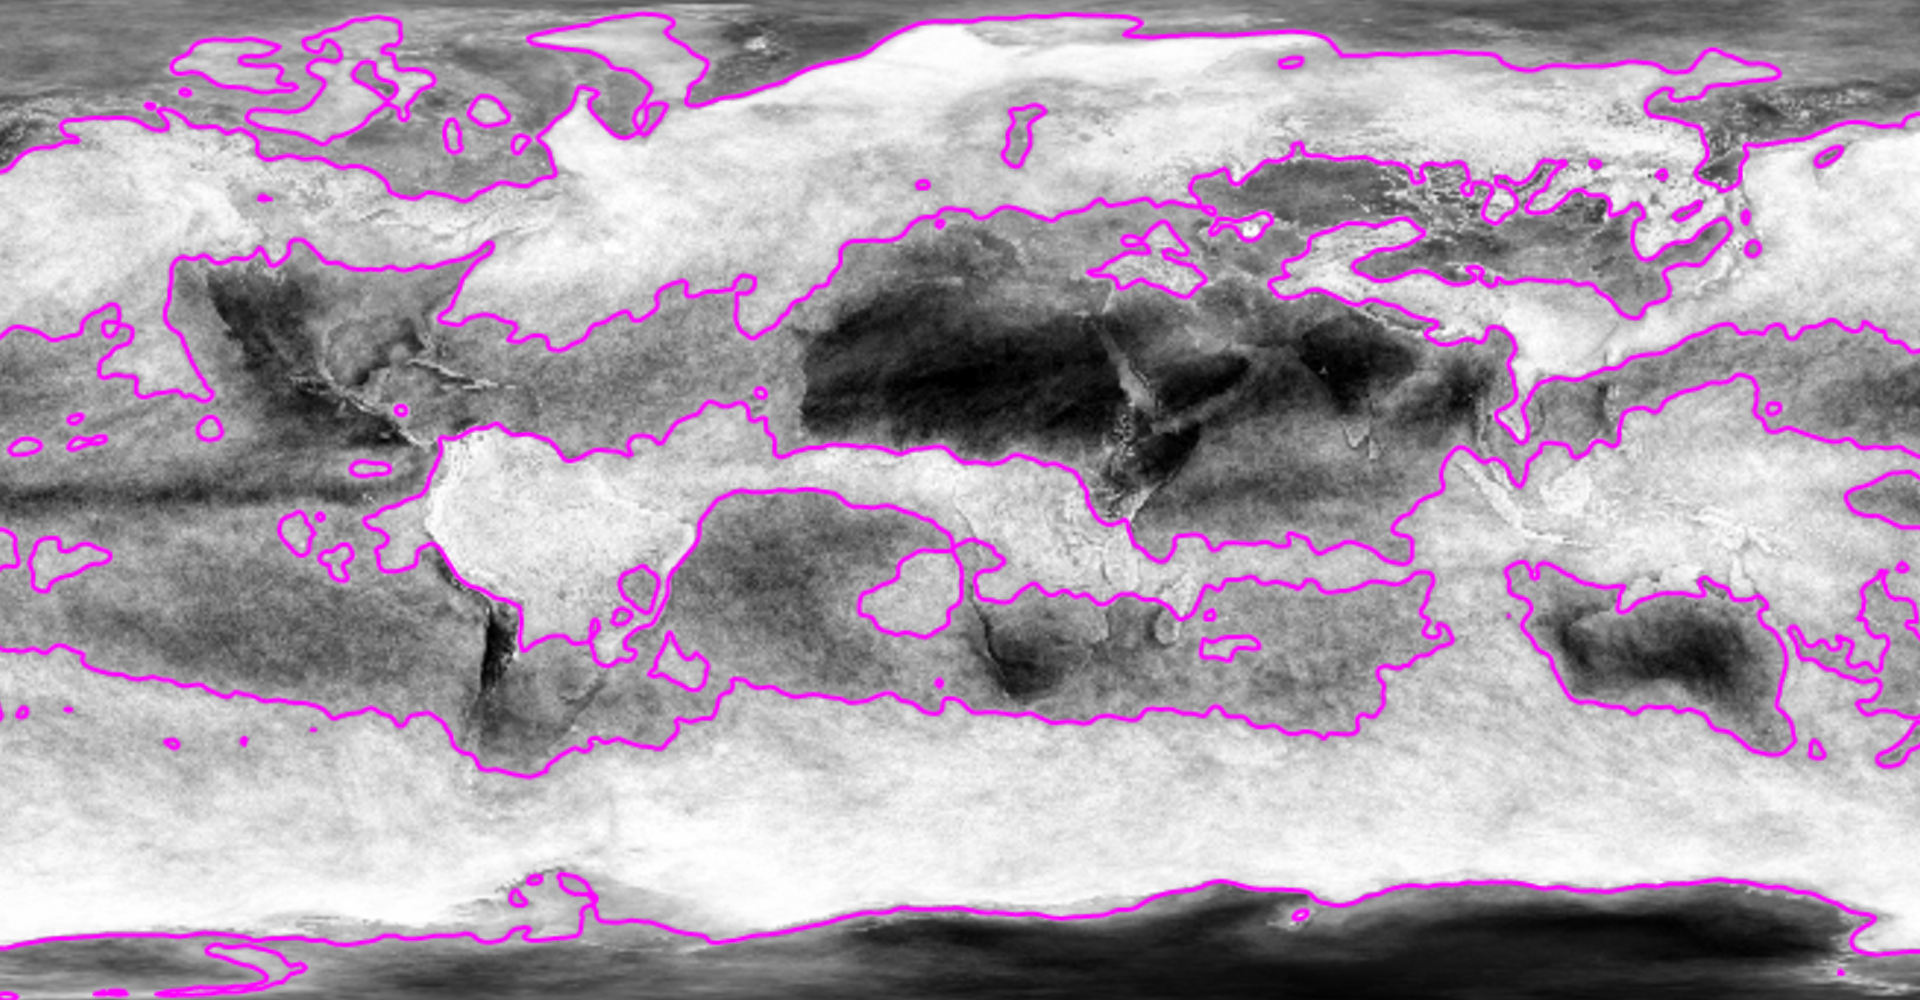
Other raster image formats, such as PNG, may also be used as source data for contours. If the input image is noisy, you can generate smooth contours by first blurring the image. For example, here are animated contour lines showing global cloud fraction:
Contour plots are also useful for visualizing two-dimensional continuous functions. In this case, the array of values is computed dynamically before computing the polygons. Here is the Goldstein–Price function:
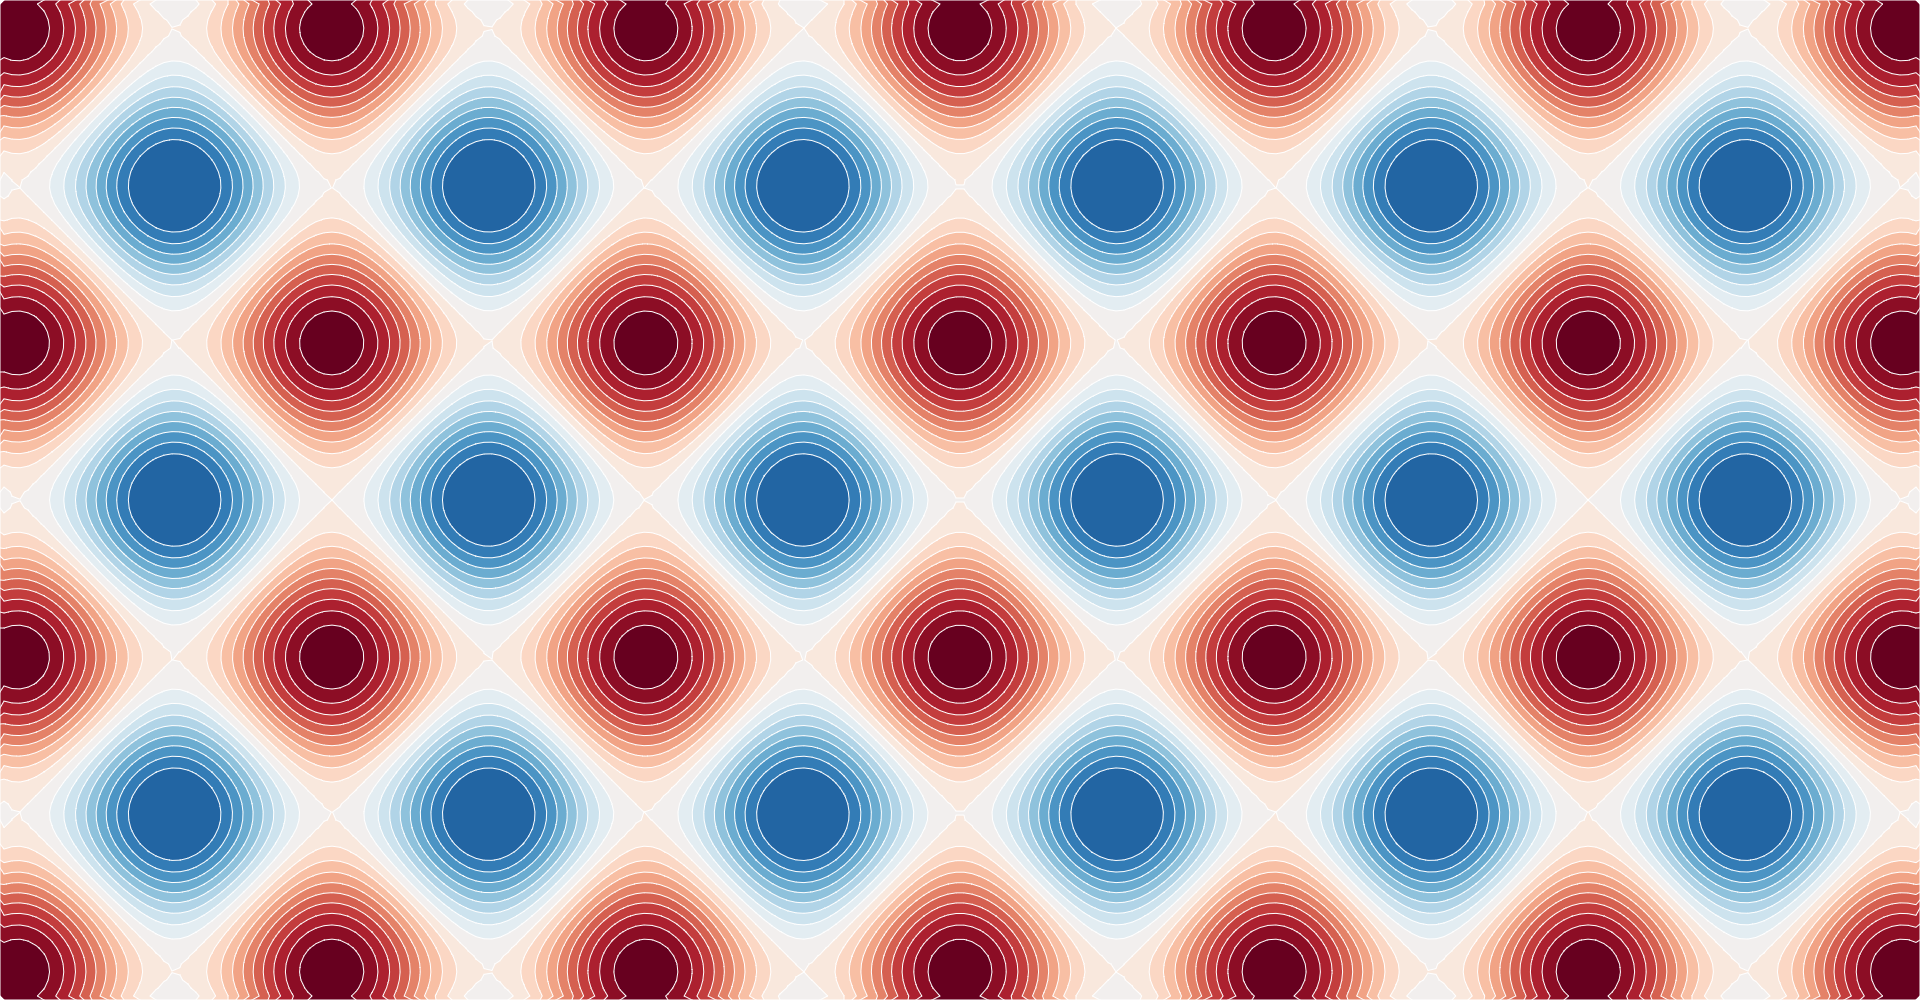
And here is a trippy animation of a simple trigonometric function:
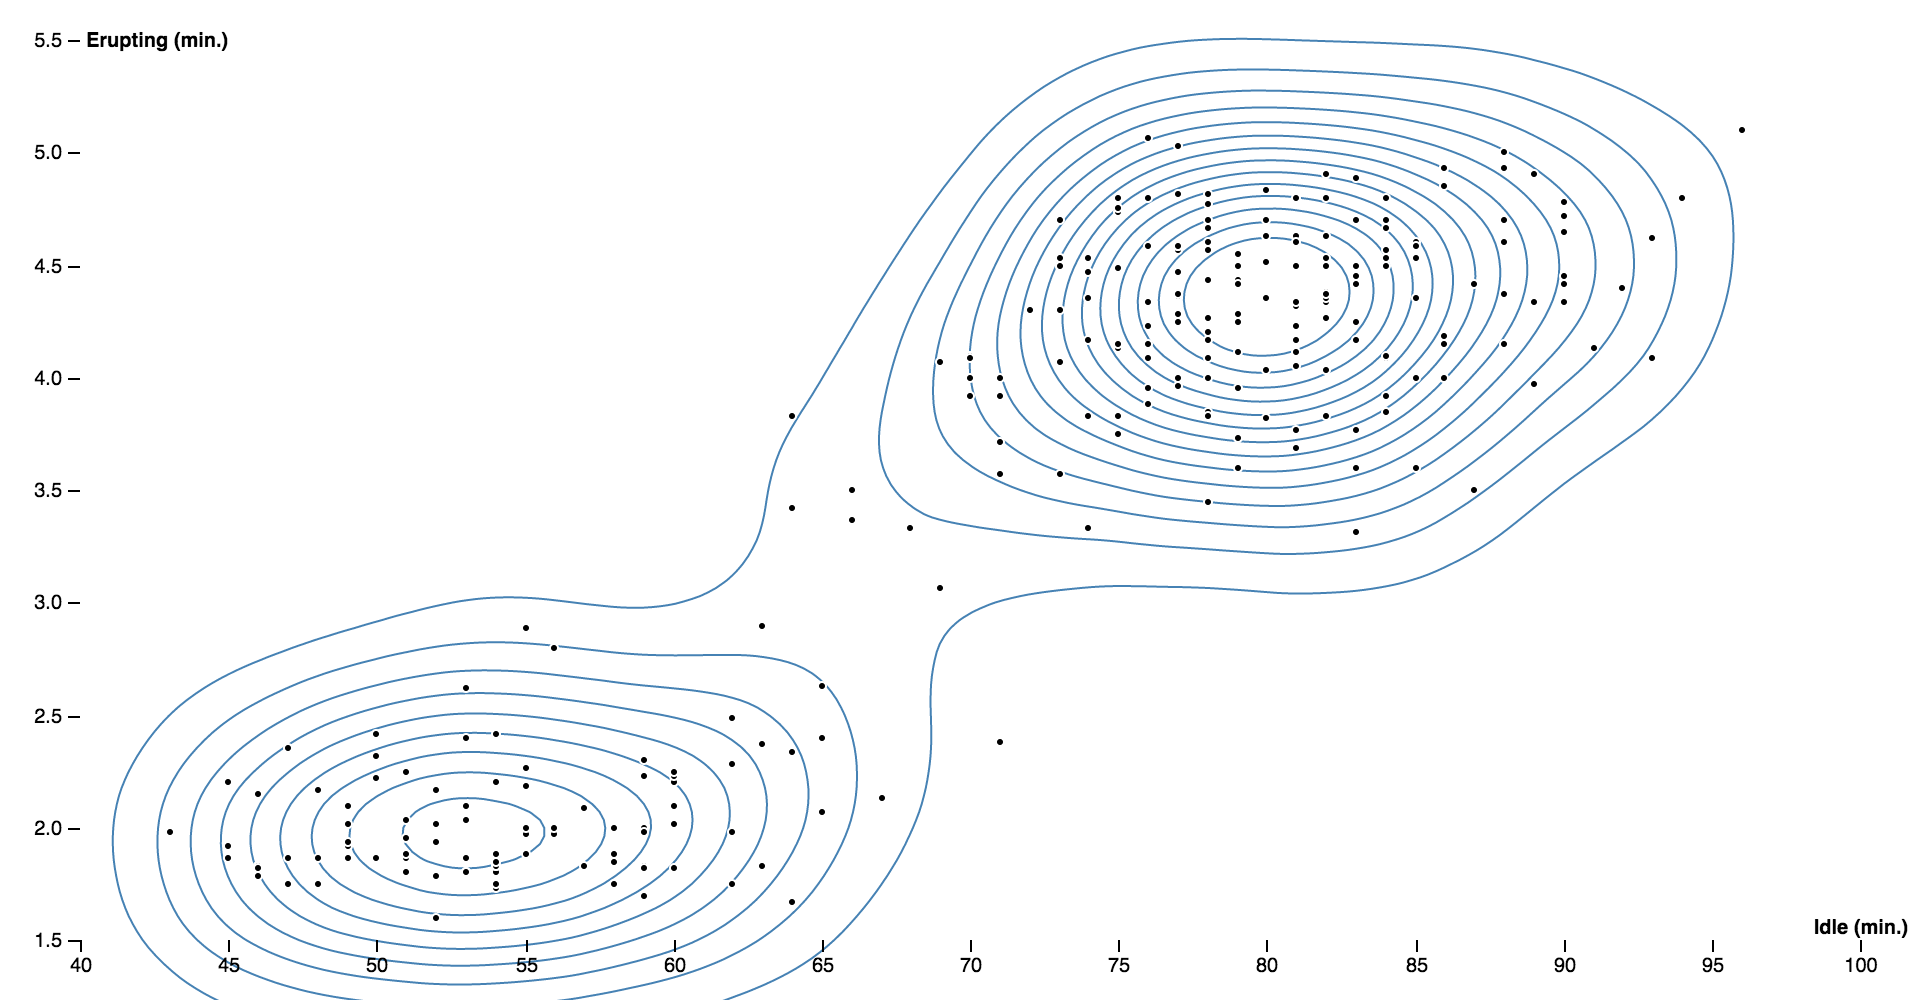
Contours can also show the estimated density of point clouds, and avoid overplotting in large datasets. This library also implements fast two-dimensional kernel density estimation; see d3.contourDensity. For example, here is a scatterplot showing the relationship between the idle duration and eruption duration for Old Faithful:
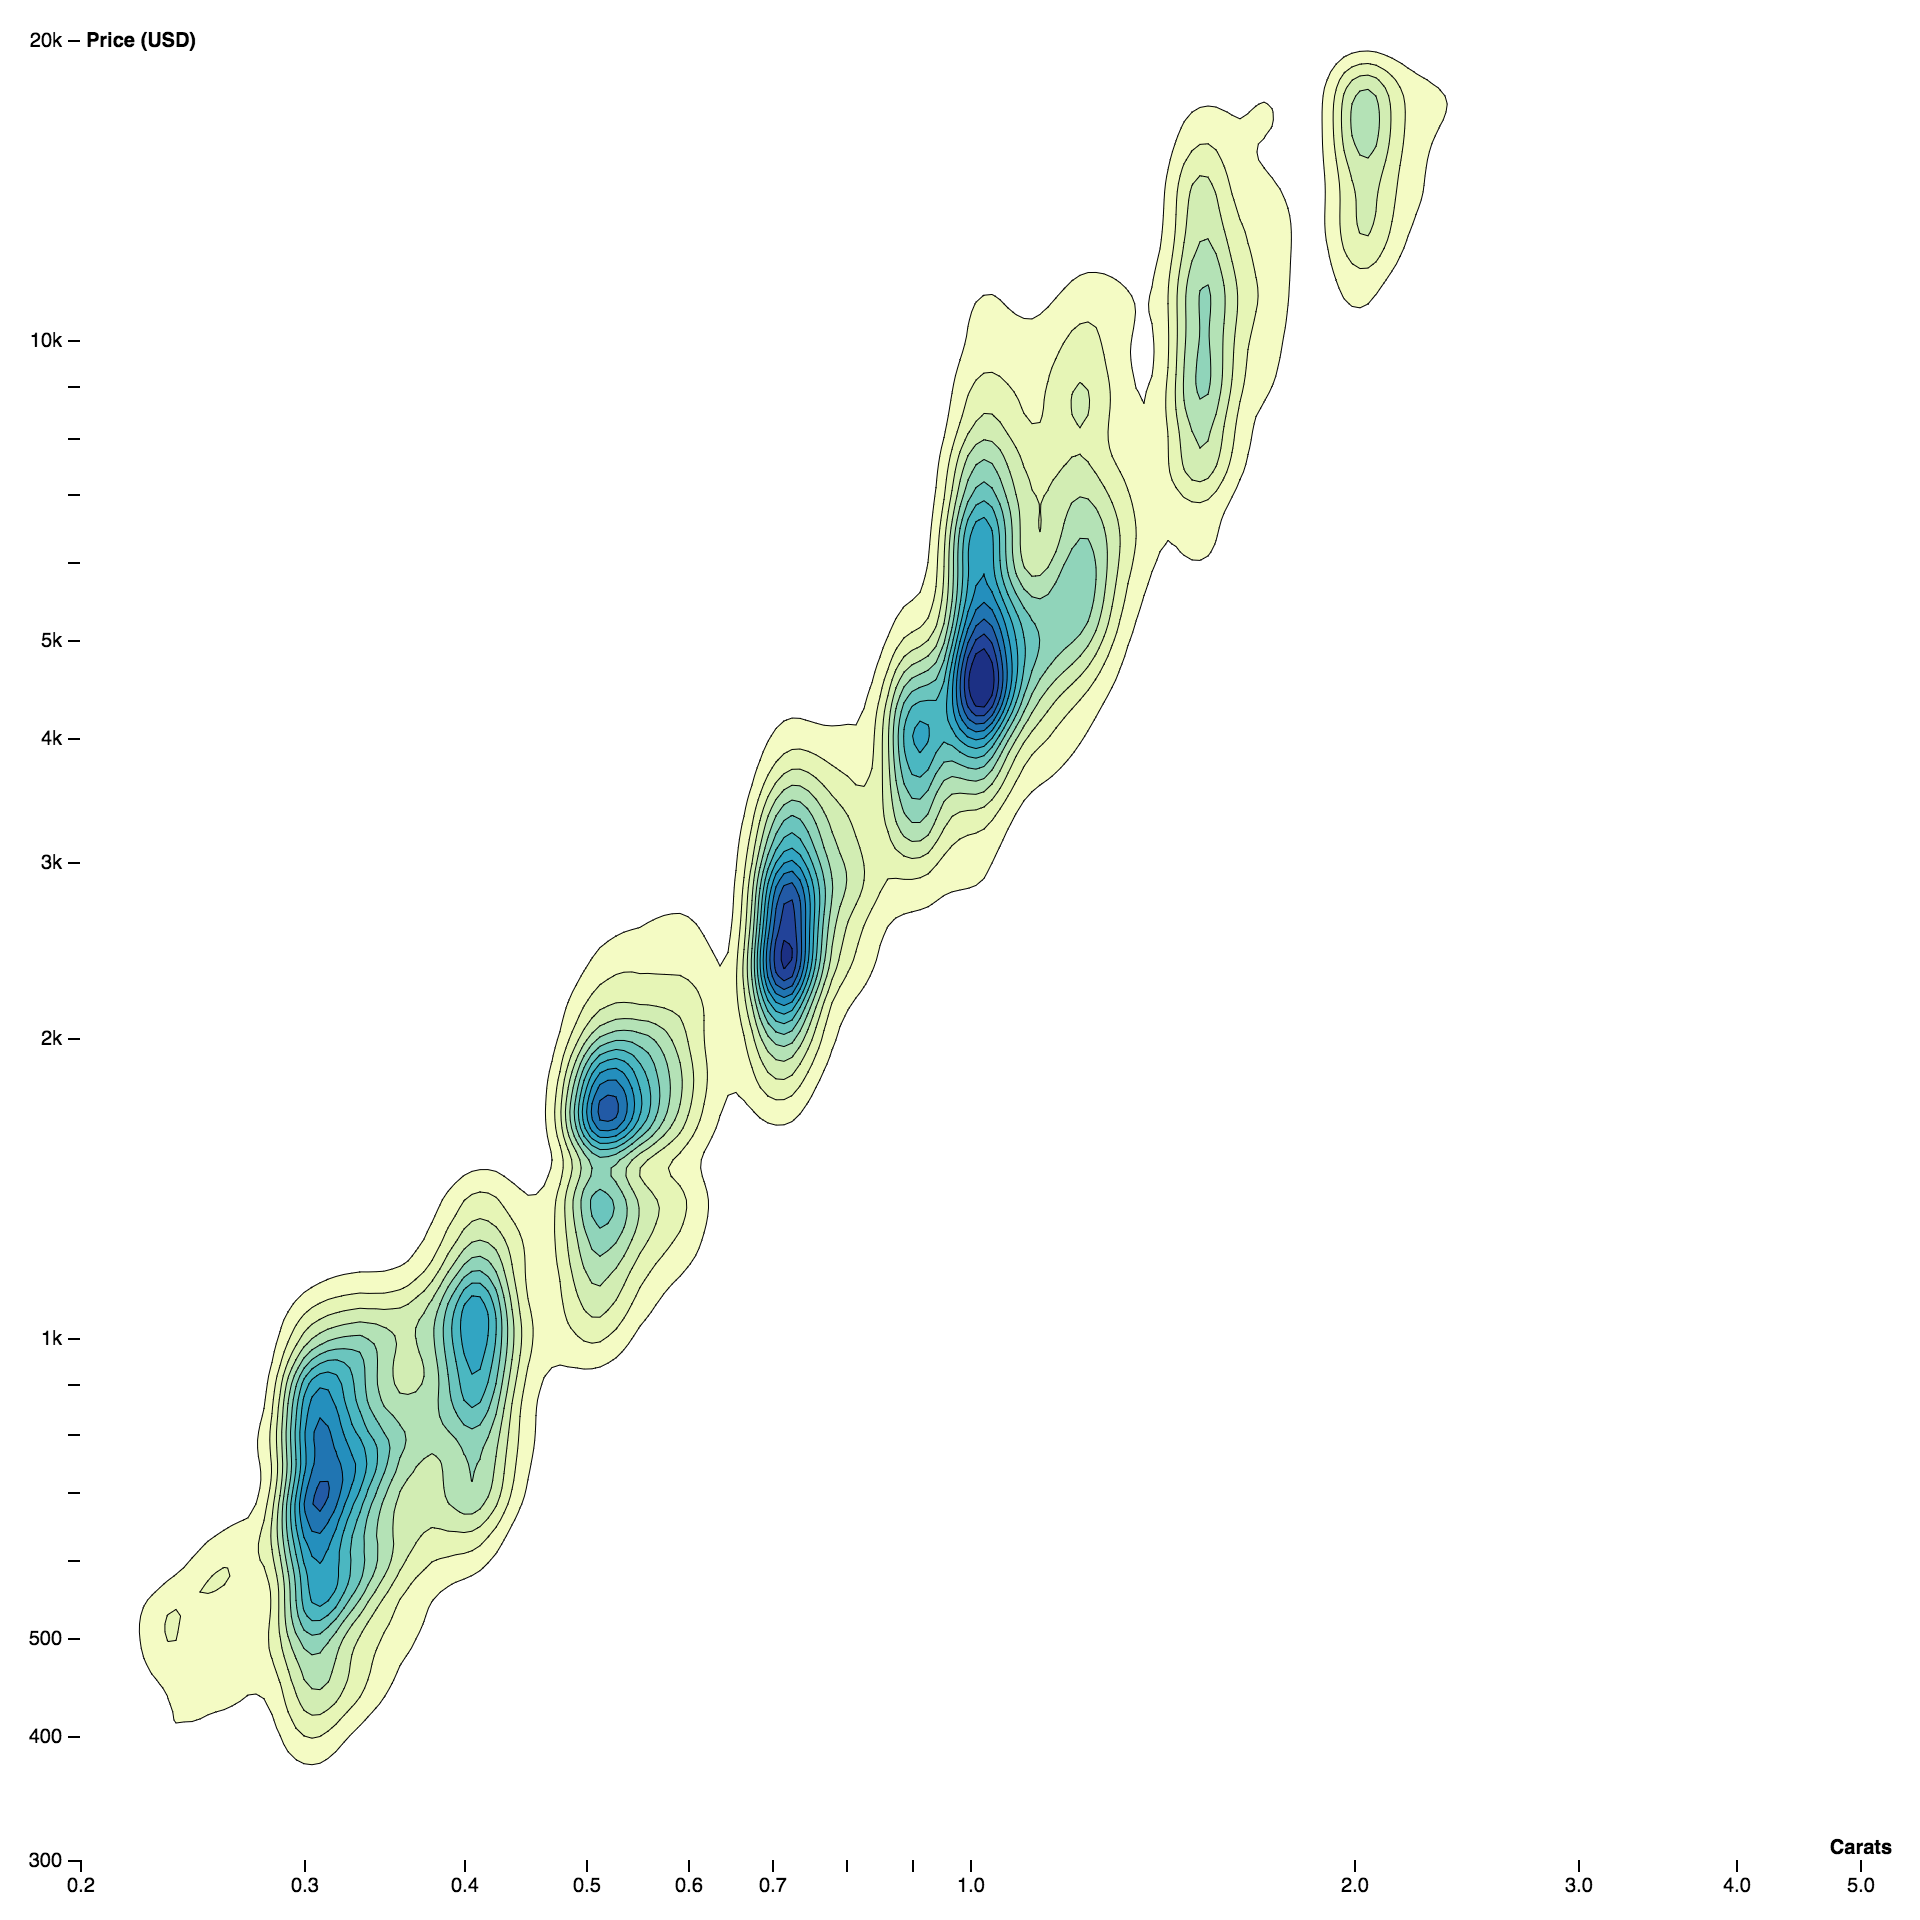
And here is a density contour plot showing the relationship between the weight and price of 53,940 diamonds:
Installing
If you use NPM, npm install d3-contour. Otherwise, download the latest release. You can also load directly from d3js.org, either as a standalone library or as part of D3 4.0. AMD, CommonJS, and vanilla environments are supported. In vanilla, a d3 global is exported:
<script src="https://d3js.org/d3-contour.v1.min.js"></script>
<script>

// Populate a grid of n×m values where -2 ≤ x ≤ 2 and -2 ≤ y ≤ 1.
var n = 256, m = 256, values = new Array(n * m);
for (var j = 0.5, k = 0; j < m; ++j) {
  for (var i = 0.5; i < n; ++i, ++k) {
    values[k] = goldsteinPrice(i / n * 4 - 2, 1 - j / m * 3);
  }
}

// Compute the contour polygons at log-spaced intervals; returns an array of MultiPolygon.
var contours = d3.contours()
    .size([n, m])
    .thresholds(d3.range(2, 21).map(p => Math.pow(2, p)))
    (values);

// See https://en.wikipedia.org/wiki/Test_functions_for_optimization
function goldsteinPrice(x, y) {
  return (1 + Math.pow(x + y + 1, 2) * (19 - 14 * x + 3 * x * x - 14 * y + 6 * x * x + 3 * y * y))
      * (30 + Math.pow(2 * x - 3 * y, 2) * (18 - 32 * x + 12 * x * x + 48 * y - 36 * x * y + 27 * y * y));
}

</script>
Try d3-contour in your browser.
API Reference
Constructs a new contour generator with the default settings.
Computes the contours for the given array of values, returning an array of GeoJSON MultiPolygon geometry objects. Each geometry object represents the area where the input values are greater than or equal to the corresponding threshold value; the threshold value for each geometry object is exposed as geometry.value.
The input values must be an array of length n×m where [n, m] is the contour generator’s size; furthermore, each values[i + jn] must represent the value at the position ⟨i, j⟩. For example, to construct a 256×256 grid for the Goldstein–Price function where -2 ≤ x ≤ 2 and -2 ≤ y ≤ 1:
var n = 256, m = 256, values = new Array(n * m);
for (var j = 0.5, k = 0; j < m; ++j) {
  for (var i = 0.5; i < n; ++i, ++k) {
    values[k] = goldsteinPrice(i / n * 4 - 2, 1 - j / m * 3);
  }
}

function goldsteinPrice(x, y) {
  return (1 + Math.pow(x + y + 1, 2) * (19 - 14 * x + 3 * x * x - 14 * y + 6 * x * x + 3 * y * y))
      * (30 + Math.pow(2 * x - 3 * y, 2) * (18 - 32 * x + 12 * x * x + 48 * y - 36 * x * y + 27 * y * y));
}
The returned geometry objects are typically passed to d3.geoPath to display, using null or d3.geoIdentity as the associated projection.
If size is specified, sets the expected size of the input values grid to the contour generator and returns the contour generator. The size is specified as an array [n, m] where n is the number of columns in the grid and m is the number of rows; n and m must be positive integers. If size is not specified, returns the current size which defaults to [1, 1].
# contours.smooth([smooth]) <>
If smooth is specified, sets whether or not the generated contour polygons are smoothed using linear interpolation. If smooth is not specified, returns the current smoothing flag, which defaults to true.
# contours.thresholds([thresholds]) <>
If thresholds is specified, sets the threshold generator to the specified function or array and returns this contour generator. If thresholds is not specified, returns the current threshold generator, which by default implements Sturges’ formula.
Thresholds are defined as an array of values [x0, x1, …]. The first generated contour corresponds to the area where the input values are greater than or equal to x0; the second contour corresponds to the area where the input values are greater than or equal to x1, and so on. Thus, there is exactly one generated MultiPolygon geometry object for each specified threshold value; the threshold value is exposed as geometry.value.
If a count is specified instead of an array of thresholds, then the input values’ extent will be uniformly divided into approximately count bins; see d3.ticks.
Density Estimation
Constructs a new density estimator with the default settings.
Estimates the density contours for the given array of data, returning an array of GeoJSON MultiPolygon geometry objects. Each geometry object represents the area where the estimated number of points per square pixel is greater than or equal to the corresponding threshold value; the threshold value for each geometry object is exposed as geometry.value. The returned geometry objects are typically passed to d3.geoPath to display, using null or d3.geoIdentity as the associated projection. See also d3.contours.
The x- and y-coordinate for each data point are computed using density.x and density.y. The generated contours are only accurate within the estimator’s defined size.
If x is specified, sets the x-coordinate accessor. If x is not specified, returns the current x-coordinate accessor, which defaults to:
function x(d) {
  return d[0];
}If y is specified, sets the y-coordinate accessor. If y is not specified, returns the current y-coordinate accessor, which defaults to:
function y(d) {
  return d[1];
}If size is specified, sets the size of the density estimator to the specified bounds and returns the estimator. The size is specified as an array [width, height], where width is the maximum x-value and height is the maximum y-value. If size is not specified, returns the current size which defaults to [960, 500]. The estimated density contours are only accurate within the defined size.
# density.cellSize([cellSize]) <>
If cellSize is specified, sets the size of individual cells in the underlying bin grid to the specified positive integer and returns the estimator. If cellSize is not specified, returns the current cell size, which defaults to 4. The cell size is rounded down to the nearest power of two. Smaller cells produce more detailed contour polygons, but are more expensive to compute.
# density.thresholds([thresholds]) <>
If thresholds is specified, sets the threshold generator to the specified function or array and returns this contour generator. If thresholds is not specified, returns the current threshold generator, which by default generates about twenty nicely-rounded density thresholds.
Thresholds are defined as an array of values [x0, x1, …]. The first generated density contour corresponds to the area where the estimated density is greater than or equal to x0; the second contour corresponds to the area where the estimated density is greater than or equal to x1, and so on. Thus, there is exactly one generated MultiPolygon geometry object for each specified threshold value; the threshold value is exposed as geometry.value. The first value x0 should typically be greater than zero.
If a count is specified instead of an array of thresholds, then approximately count uniformly-spaced nicely-rounded thresholds will be generated; see d3.ticks.
# density.bandwidth([bandwidth]) <>
If bandwidth is specified, sets the bandwidth (the standard deviation) of the Gaussian kernel and returns the estimate. If bandwidth is not specified, returns the current bandwidth, which defaults to 20.4939…. The specified bandwidth is currently rounded to the nearest supported value by this implementation, and must be nonnegative.