Presentation:https://docs.google.com/presentation/d/1eOtrxH34Pn-dGqCifs5KrQhsSAenC6q421O3bR2Po-Y/edit?usp=sharing
Zen Acar, Gina Cameras, Harini Rao, Carlos Santillan
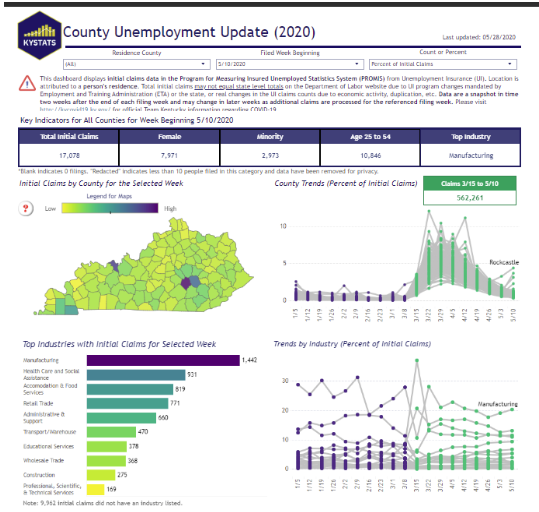
Our team will create a dashboard to visualize US unemployment trends to understand how COVID has affected unemployment for the following dimensions
- State
- Age
- Gender
- Industry
- State level unemployment data (2015 - Present)
- https://oui.doleta.gov/unemploy/claims.asp (weekly | # of claims)
- Industry level employment data
- https://download.bls.gov/pub/time.series/ce/ (monthly | # of people employed)
- Demographic level unemployment data
- https://download.bls.gov/pub/time.series/ln/ (monthly | # of people unemployed)
Source: https://www.bls.gov/cps/cps_htgm.htm
- All those who did not have a job at all during the survey reference week, made at least one specific active effort to find a job during the prior 4 weeks, and were available for work (unless temporarily ill).
- All those who were not working and were waiting to be called back to a job from which they had been laid off. (They need not be looking for work to be classified as unemployed.)
- The official unemployment rate for the nation is the number of unemployed as a percentage of the labor force (the sum of the employed and unemployed).
- https://coronavirus-resources.esri.com/datasets/esribizteam::us-weekly-unemployment-data
- https://coronavirus-resources.esri.com/datasets/esribizteam::us-state-level-unemployment-insurance-weekly-claims?geometry=-178.367%2C26.838%2C-11.111%2C50.467
- https://kystats.ky.gov/Reports/Tableau/CUU_2020