Using various data sources to visualize the digital impact of meteorites
https://cpietsch.github.io/media-impact
There is already a foto-stream of the process online. http://www.flickr.com/photos/58821321@N06/sets/72157634070386066/
This project is part of the http://visualizing.org/contests/visualizing-meteorites Challenge.
Created at the course "Dataviz Challenges 2013" at FH Potsdam https://github.com/FH-Potsdam/dataviz-2013 https://incom.org/workspace/4324
What is the media impact of meteors on the internet and how to relate this impact to mass, year of impact and other parameters? http://zeigma.com/impact Data acquisition
First of all we have to clarify what is relevant data. To do this, we searched Google, Bing, Flickr, Youtube and Twitter with a specific keyword phrase: "NAME OF METEROITE meteorite". This search phrase returned the clearest results about the actual meteorite we were looking for. Other combinations returned very inaccurate results and would have skewed our ranking. We then took the number of search results to determine the level of awareness. Scraping: The term "screen scraping" generally covers all methods of extracting text from computer screens. At present, however, the term is used almost exclusively in relation to websites (hence also web scraping) http://de.wikipedia.org/wiki/Screen_Scraping Google
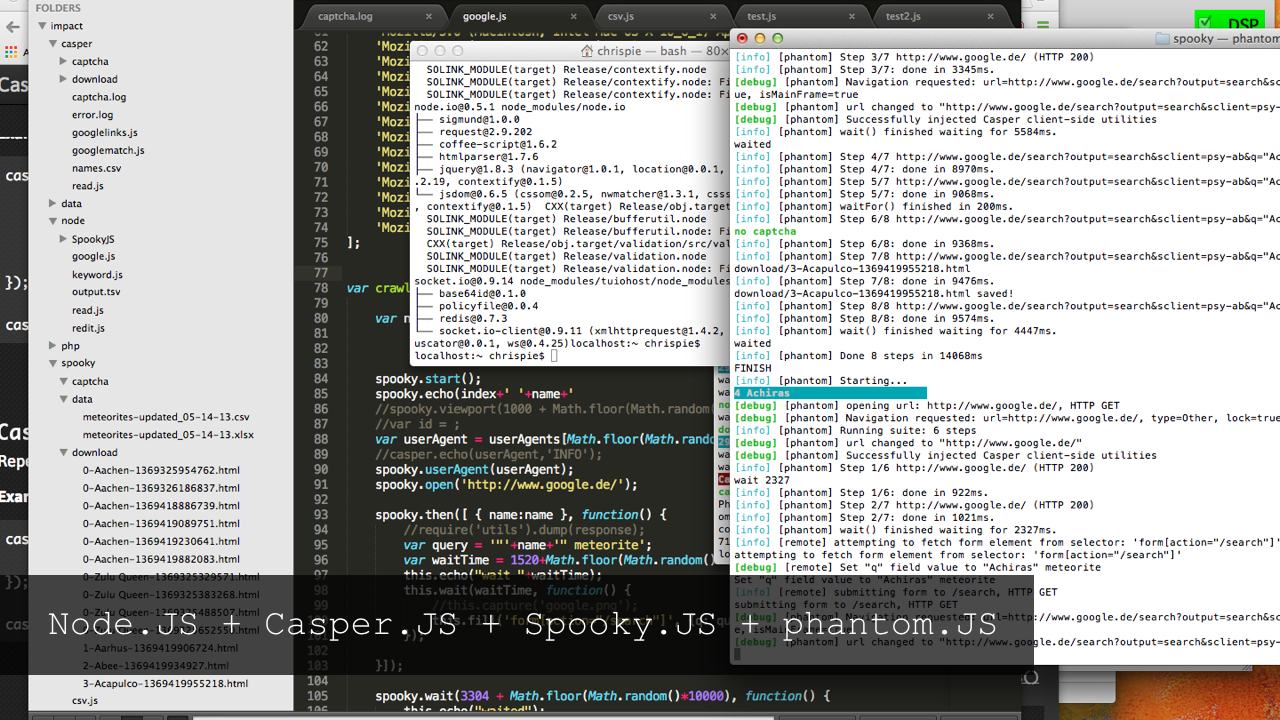
At the beginning of the research, the number of hits on Google seemed to be the most relevant. That's why we first tried to aggregate data from Google, which unfortunately turned out to be more difficult than we thought. There are 2 ways to get the content of the hit lists from google: pay for it or with a little effort scrape the data yourself. The first way is to use the very well documented google search api https://developers.google.com/web-search/docs/ and pay 5$ for 1000 requests. That makes with 30000 meteorites nearly 150$. Fuck. Quite brazen, if you consider that google uses the data it works with for free. The second variant uses the automated scrape of google. According to google this is illegal, and they also try to prevent this with captcha stop pages. So how do I scrape pages that do not want to be scraped. A good introduction was the talk of Asheesh Laroia (http://www.youtube.com/watch?v=52wxGESwQSA) which I had to stop after about an hour because my head exploded. I didn't want to work that lowlevel and looked for alternatives in an acceptable programming language: Javascript. I found in Phantom.js an acceptable companion in my journey through the scraping jungle. Phantom.js is a headless webkit browser, which means that you can open web pages in secret and control them with Javascript. Especially the screenshot function proved to be useful to trick the captcha pages from Google. These come up every now and then when you scrap google. My phantom.js algorithm works like this: create a browser with random screen size and BrowserAgent open Google.com and wait a bit fill in the search field, wait a bit and submit it if no captcha comes, save the page and continue if a captcha comes, take a screenshot of the captcha and wait 20 seconds. then drop the solved captcha and fill it in the field. save the following page wait a bit and start from the beginning
How to solve a captcha automatically? You can use the api of deathbycaptcha.com. This service usually solves a captcha after about 10 seconds. How? Rumor has it that the captcha is typed by hand somewhere in India. Thanks to opensource and github I was able to build a small node.js script that listens to a certain directory for captcha images and when one comes, taps the api and then saves the captcha word to a file that is read again by phantom.js. Easy. Armed with this script we scanned google in parallel from multiple machines. The whole thing is scalable, and useful for other projects too.
##Beating google with its own weapons By chance I found another way to scrap google: with Google itself. There are 2 weapons for this: Google Spreadsheet and Google App Script. Google Spreadsheet is damn powerful and offers the magic function ImportXML which allows to parse external xml-files. Since HTML is XML you can use importXml("https://www.google.de/search?output=search&sclient=psy-ab&oq=&gs_l=&pbx=1&q=%22NAMEDESMETEROITS%22 meteorite", "//*[@id='resultStats']") to access the result div in google search. Easy. Unfortunately Google limits the requests per spreadsheet to 50. Shit. Could you maybe automatically create spreadsheets with the 50 requests per sheet and then spread the 3000 meteroites over many spreadsheets ? Yes! With Google App Script. Google App Script is a Javascript environment with which you can control almost all Google products - including Spreadsheet. The script to create the spreadsheets with the ImportXml commands can be found here. Furthermore App Script offers the possibility to save files directly, and thus also the Google search engine HTMLs themselves. Killer factor #2 is, since Google App Script itself comes from the Google server, there are no captcha stop pages, which allows fast scraping of Google Search. The script is available here.
Scraping Bing, Twitter, Youtube and Flickr was no longer a problem thanks to the acquired skills on the one hand and the well-documented and open APIs on the other. Only Twitter proved to be unresponsive, which made us switch to the Topsy api for aggregating Twitter results. Here they make just as much money with the data as Google does. That's about it on the topic of data aggregation, in detail I got to know and used the following tools:
- Casper.js - a wrapper for Phantom.js
- Phantom.js - a headless webkit that can be controlled via Javascript
- Spooky.js - a wrapper for Casper.js that can be used in Node.js
- Node.js - used to tap the DeathByCaptcha api, process the aggregated result HTMLs, filehandling, merging, MultiTool
- Mongo DB - a document driven database where the data was collected and later exported as csv
- Google Script, Google Spreadsheet - Scraping
- D3 - visualization and data handling in Javascript
The data collection turned out to be a bit more complex than expected, so there wasn't too much time left for the actual visualization. The visualization was created in a hau-ruck process and grew in iterations due to the repeated postponement of the deadline of the contests. Basically, it should be simple, quick to understand and a fusion of visualization and website. On the one hand it consists of a bar chart on the right side and on the other hand a content area on the left side. Aesthetics came first, that's why the satellite projection in the background is not always informative (since no proper localization is possible). The impact values are visualized in detail by radar chart and stored in a history to allow later comparison. In general, despite the short time, a respectable visualization has come out whereby the potential of the aggregated data was only marginally exploited. Still planned were: Animation of the impact on the map with attracting particles representing the media content. Extension of the bar chart with various filters and sorting methods. Performance optimization Combination possibilities in the data sources
Learned a lot about data aggregation and scraping in particular. Also that creating a visualization needs a lot of preparatory work. And as always, the process is the outcome.
Wie groß ist der mediale Einschlag der Meteoriten im Internet und wie kann man diesen Einschlag in Verbindung mit der Masse, Jahr des Einschlags und anderen Parametern setzen? http://zeigma.com/impact Datenbeschaffung
Zu erst einmal muss man klären was relevante Daten sind. Dazu haben wir Google, Bing, Flickr, Youtube und Twitter mit einem bestimmten Suchwort-Satz durchsucht: "NAME DES METEROITEN meteorite". Dieser Suchsatz lieferte die eindeutigsten Ergebnisse zu dem tatsächlich gesuchten Meteoriten. Andere Kombinationen lieferten sehr ungenaue Ergebnisse und hätten dadurch unser Ranking verfälscht. Darauf hin haben wir die Anzahl der Suchergebnisse genommen um den Bekanntheitsgrad zu ermitteln. Scraping: Der Begriff Screen Scraping (engl., etwa: „Bildschirm auskratzen“) umfasst generell alle Verfahren zum auslesen von Texten aus Computerbildschirmen. Gegenwärtig wird der Ausdruck jedoch beinahe ausschließlich in Bezug auf Webseiten verwendet (daher auch Web Scraping) http://de.wikipedia.org/wiki/Screen_Scraping Google
Am relevantesten kam uns am Anfang der Recherche die Trefferanzahl bei Google vor. Deswegen versuchten wir auch als erstes Daten von Google zu aggregieren, was sich leider als schwieriger als gedacht erwies. Es gibt 2 Varianten um an die Inhalte der Trefferlisten von google zu kommen: dafür bezahlen oder mit ein bisschen Aufwand die Daten selbst scrapen. Bei der ersten Variante bedient man sich der sehr gut dokumentierten google search api https://developers.google.com/web-search/docs/ und bezahlt für 1000 Requests 5$. Das macht bei 30000 Meteoriten knapp 150$. Fuck. Ganz schön dreist, wenn man sich überlegt, dass google sich kostenlos der Daten bedient mit denen es arbeitet. Die zweite Variante bedient sich dem automatisierten scrapen von google. Laut google ist das illegal, und versucht auch desgleichen mit Captcha-Stopseiten zu unterbinden. Also wie scrape ich Seiten die nicht gescraped werden wollen. Ein guter Einstieg gab mir der Talk von Asheesh Laroia (http://www.youtube.com/watch?v=52wxGESwQSA) den ich nach ca einer Stunde abbrechen musste weil mein Kopf explodierte. Ganz so lowlevel wollte ich dann doch nicht arbeiten und suchte nach Alternativen in einer mir akzeptablen Programmiersprache: Javascript Ich fand in Phantom.js ein akzeptablen Begleiter in meiner Reise durch den Scraping-Djungel. Phantom.js ist ein Kopfloser Webkit Browser, was so viel heißt, dass man mit Javascript Webseiten im Verborgenen öffnen kann und diese steuern kann. Besonders die Screenshot-Funktion erwies sich als nützlich um die Captcha Seiten von Google aus zu tricksen. Diese kommen hin und wieder wenn man google scraped. Mein phantom.js Algoritmus funktioniert folgendermaßen: erstelle einen Browser mit zufälliger Bildschirmgröße und BrowserAgent öffne Google.com und warte ein bisschen füll das Suchfeld aus, warte ein bischen und schick es ab wenn kein captcha kommt, speichere die page und mach weiter wenn ein captcha kommt, mach ein screenshot vom captcha und warte 20 sekunden. ließ dann das gelöste captcha aus und füll es in das feld. speichere die darauffolgende seite ab warte ein bisschen und fang von vorne an
Wie löst man ein Captcha automatisiert? Man bedient sich der Api von deathbycaptcha.com. Dieser Dienst löst ein Captcha in der Regel nach ca. 10 Sekunden. Wie? Man Munkelt, dass der Captcha irgendwo in Indien per Hand abgetippt wird. Dank opensource und github konnte ich mir ein kleines node.js script basteln, dass ein bestimmtes Verzeichniss nach Captcha-bildern belauscht und wenn eins kommt die Api anzapft und dann das Captchawort in eine Datei speichert, die wiederherum von phantom.js eingelesen wird. Easy. Gewappnet mit diesem Script scrapten wir google parallel von mehreren Rechnern. Das ganze ist skalierbar, und auch für andere Projekte nützlich.
##Google mit den eigenen Waffen schlagen Per Zufall bin ich noch auf eine andere Möglichkeit gestoßen um google zu scrapen: mit Google selber. Dabei gibt es 2 Waffen: Google Spreadsheet und Google App Script. Google Spreadsheet ist verdammt powerful und bietet die magische Funktion ImportXML die es ermöglicht externe xml-files zu parsen. Da HTML ja XML ist kann man per importXml("https://www.google.de/search?output=search&sclient=psy-ab&oq=&gs_l=&pbx=1&q=%22NAMEDESMETEROITS%22 meteorite", "//*[@id='resultStats']") auf das result Div in der Googlesuche zugreifen. Easy. Nur leider limitiert Google die Requests pro Spreadsheet auf 50. Shit. Könnte man vielleicht automatisch Spreadsheets mit den 50 Requests per Sheet erstellen und dann die 3000 Meteroiten auf viele Spreadsheets verteilen ? Ja! Mit Google App Script. Google App Script ist eine Javascript Umgebung mit dem man fast alle Google Produkte steuern kann - und damit auch Spreadsheet. Das Script zum erstellen der Spreadsheets mit den ImportXml Befehlen gibts hier. Des weiteren bietet App Script die Möglichkeit direkt Dateien zu speichern, und damit auch die Google Suchergbniss HTMLs selber. Killerfaktor #2 ist, da Google App Script selber vom Google Server kommt, kommen keine Captcha Stopseiten, was schnelles Scrapen von Google Search ermöglicht. Das Script gibts hier.
Bing, Twitter, Youtube und Flickr zu scrapen war zum einen dank der erworbenen Fähigkeiten und zum anderen dank der gut dokumetierten und offenen APIs kein Problem mehr. Nur Twitter erwies sich als wiederspänstig was uns auf die Topsy Api zum aggregieren der Twitter Ergebnisszahlen umsteigen ließ. Hier wird genauso Kohle gemacht mit den Daten wie bei Google. Das war es im groben zum Thema Datenaggregation, im Detail habe ich folgende Werkzeuge kennen gelernt und genutzt:
- Casper.js - ein Wrapper für Phantom.js
- Phantom.js - ein Headless Webkit der über Javascript ansteuerbar ist
- Spooky.js - ein Wrapper für Casper.js den man in Node.js verwenden kann
- Node.js - benutzt um die DeathByCaptcha api anzuzapfen, die aggregierten Result-HTMLs weiter zu verarbeiten und zu prozessieren, Filehandling, Zusammenfassen, MultiTool
- Mongo DB - eine Document Driven Datenbank in dem die Daten gesammelt wurden und später als csv exportiert
- Google Script, Google Spreadsheet - Scraping
- D3 - Visualisierung und Datahandling in Javascript
Die Datenbeschaffung fiel ein wenig komplexer aus als gedacht, da blieb nicht all zu viel Zeit für die eigentliche Visualisierung. Die Visualisierung ist in einem Hau-ruck Verfahren entstanden und durch die mehrmalige Verschiebung der Deadline des Kontests in Iterationen gewachsen. Grundsätzlich sollte sie einfach, schnell verständlich und eine Fusion von Visualisierung und Website sein. Zum besteht sie aus einem Bar-Chart auf der rechten Seiten und zum anderen aus einem Content-Bereich auf der linken Seite. Ästetik stand an erster Stelle, deswegen ist die Sateliten Projektion im Hintergrund auch nicht immer Informativ (da keine richtige Lokalisierung möglich ist). Die Impact-Werte werden im Detail per Radar Chart visualisiert und in einer History gespeichert um späteres Vergleichen zu ermöglichen. Im groben ist trotz der kurzen Zeit eine ansehnliche Visualisierung heraus gekommen wobei das Potential der Aggregierten Daten nur am Rande ausgeschöpft wurde. Angedacht waren noch: Animation des Einschlages auf der Karte mit anziehenden Partikeln die Stellvertrehtend für die Medieninhalte stehen. Erweiterung des Bar-Chart um diverse Filter und Sortiermethoden Performance Optimierung Kombinationsmöglichkeiten in den Datenquellen
Ne Menge gelernt was die Datenaggregation und dem Scrapen im Speziellen angeht. Auch, dass das Erstellen einer Visualisierung viel Vorarbeit benötigt. And as always, the process is the outcome.