Smorgasbord
This document is at this point primarily a project description. As a setup procedure is formalized, instructions for setup and use will be added.
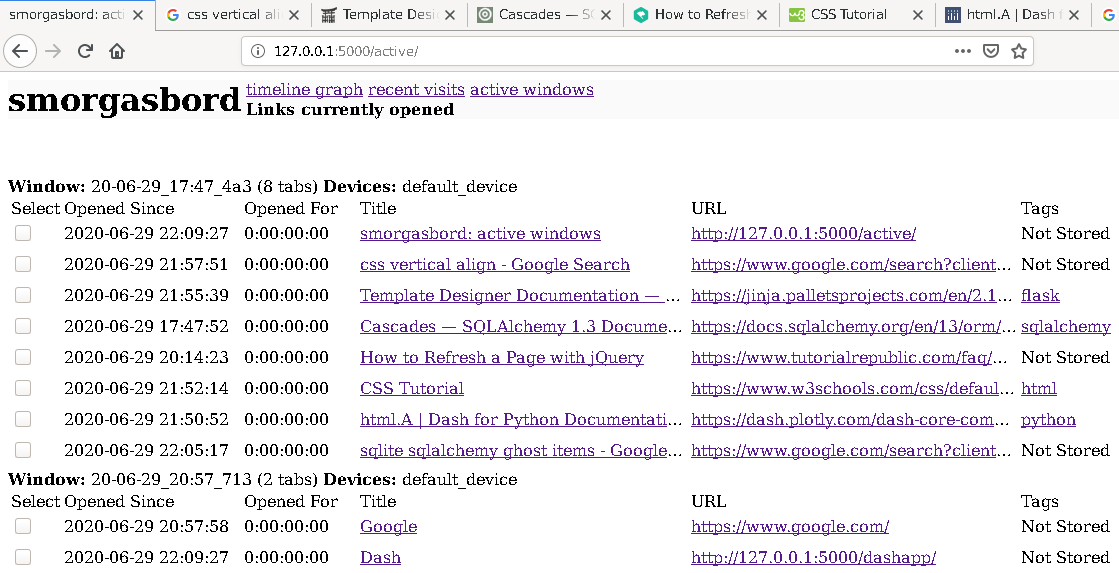
A utility for organizing, cataloging, and visualizing web browsing. Smorgasbord tracks the current state of all active browser and can save each link and associated visit to its database. On the Active Windows page, each visited link can be tagged and saved. Once a link is tagged each visit is saved and visible on the Recent Visits page. On the Timeline Graph page, saved links, tags, and the visits to them can be visualized in a network graph. Runs on a Flask Server.
Components
Smorgasbord consists of two primary components:
- The Browser Extension
- The Flask Server
The browser extension (currently tested on Mozilla Firefox 68.9.0esr) is a simple background script which sends current window summary info to the /devices/ endpoint of the flask server.
 The flask server maintains an internal representation of the browser state, displayed on the
 /active page. Links are saved to the database as they are assigned tags from this page. For any saved link, a record of each visit with the time and active duration is saved when the given tab is closed or the link changes.
 Visiting the page
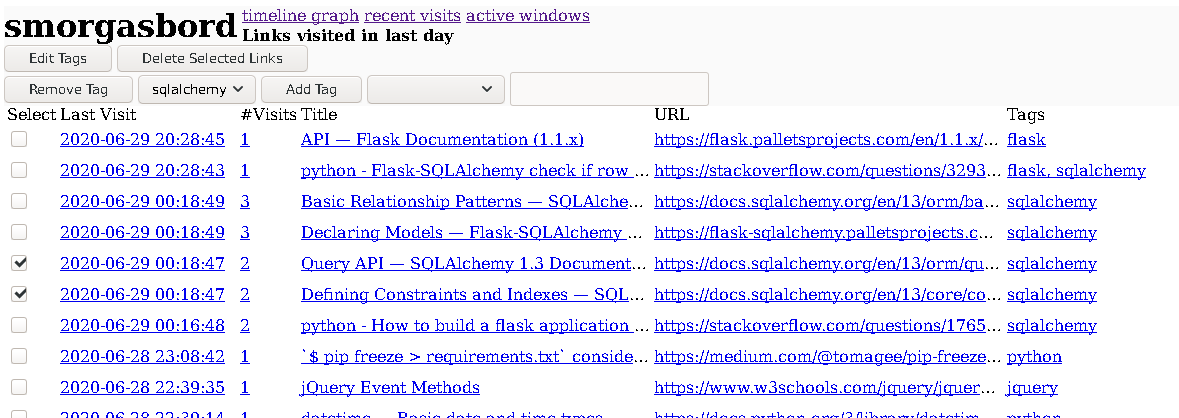
 /recent displays the most recently visited links along with the number of visits within the specified timeframe to the particular link.
- Clicking the number of visits shows a list of timestamps for each visit along with their stored duration.
- Clicking the title of the link opens a menu for changing the title or adding a description.
- Clicking the tags of each link opens a list of the tags along with the ancestors of each tag (each tag can be organized under a parent tag)
- Hovering over a link title or url displays its full text.
 Selecting any number of the checkboxes to the left of each link in either window opens a menu for bulk editing of links.
- Tags can be added or removed to a group of links.
- Links can be removed from storage (unsaved) as a group.
 Visiting the page
 /dashapp displays a variable range of the stored browsing data as a network graph. Each node on the left of the graph represents a day of browsing and connects to each link node which was visited on that day. The link nodes (center) connect to each tag node they are associated with on the right of the graph.
- Clicking a link node displays only the visits and tags for that link.
- Clicking a tag node displays only the associated links and tags for that tag.