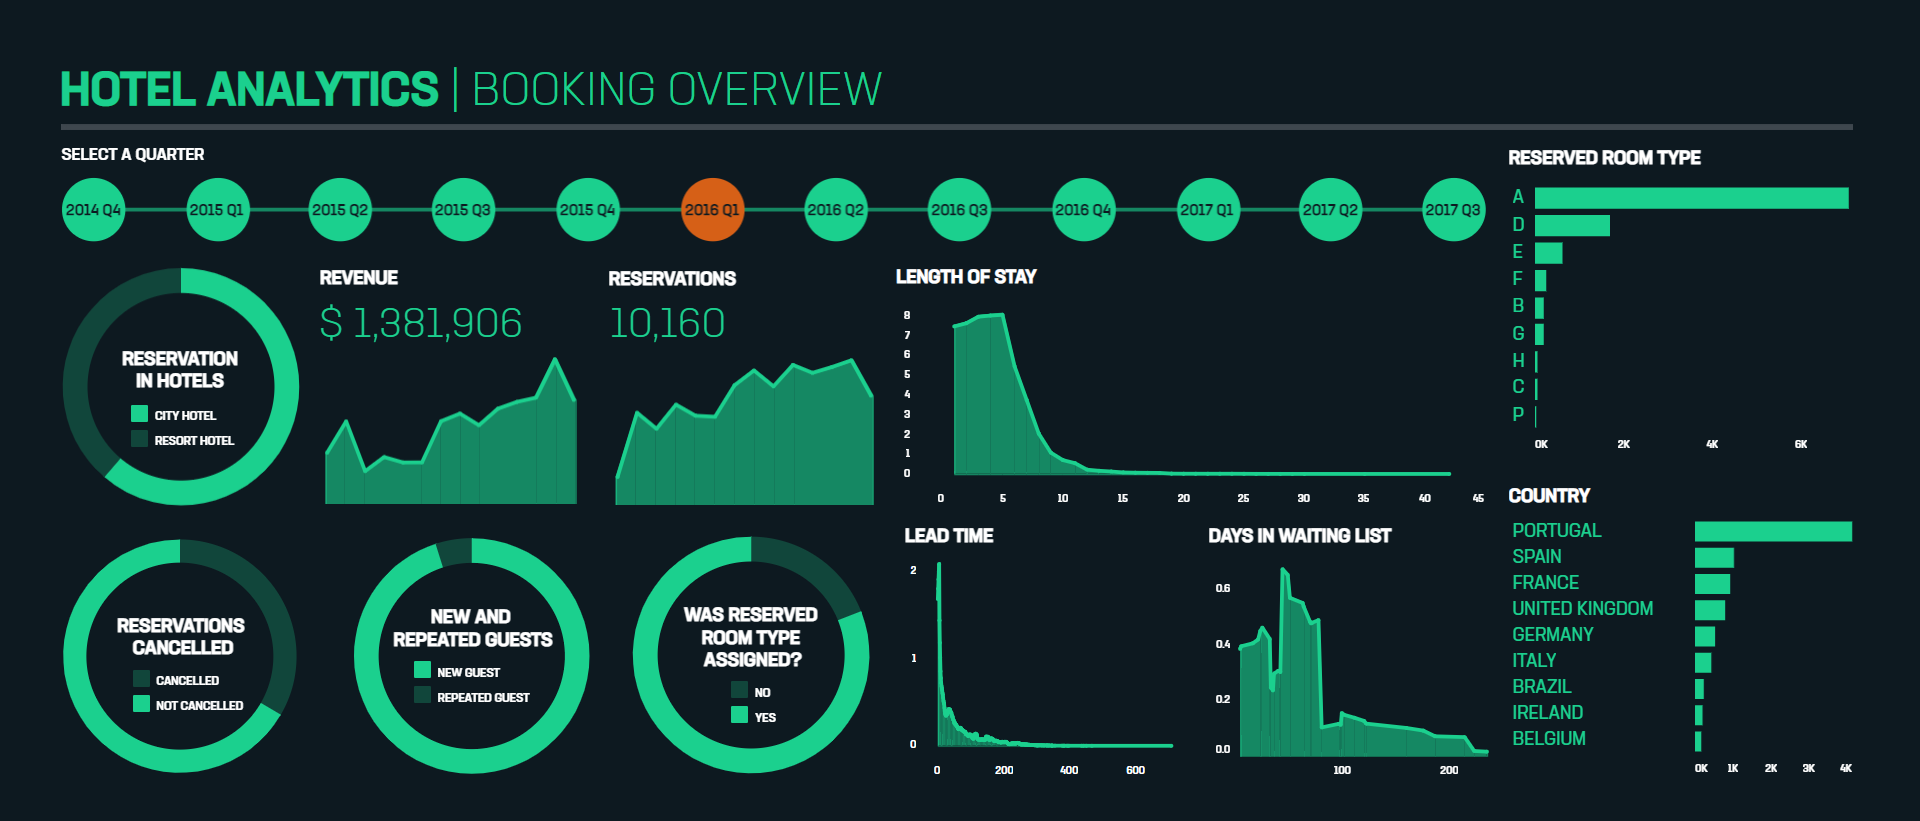
In this project, I have attempted to analyze a hotel booking dataset and come up with some relevant conclusions about the factors that contribute to count of bookings. No personal information of customer is provided in this dataset.
A dataset containing 119390 records across 32 features has been given with information regarding bookings of two hotels from July 2015 to August 2017. These two hotels are City Hotel and Resort Hotel.
The main objective is to explore the given dataset and discover the factors which govern the bookings. The dataset will be analyzed and from the conclusions drawn from it will be used to recognize the missteps taken by the manager. With this information, hotels will be equipped to improve their performance.
Data analysis is performed to answer the following questions:
- Understanding the business task.
- Import relevant libraries and define useful functions.
- Reading data from files given.
- Data inspection.
- Data cleaning.
- Exploratory data analysis, to find which factors affect the bookings and how they affect it.
- Conclusions drawn from analysis.
- Build interactive dashboard.
EDA was carried out in 3 steps:
Uni means one and variate means variable, so in univariate analysis, there is only one dependable variable. The objective of univariate analysis is to derive the data, define and summarize it, and analyze the pattern present in it. In a dataset, it explores each variable separately. Univariate analyses were done on:
Bi means two and variate means variable, so here there are two variables. The analysis is related to cause and the relationship between the two variables. Bivariate analyses were done on:
It is used to measure the strength of the linear relationship between two variables and compute their association. Correlation analysis calculates the level of change in one variable due to the change in the other. Correlation analysis of the dataset was carried out using a correlation heatmap with the features, 'lead_time', 'adr', 'total_guests', 'total_stays_in_nights', 'previous_cancellations', 'booking_changes', 'days_in_waiting_list', 'required_car_parking_spaces', 'total_of_special_requests' and 'previous_bookings_not_canceled'.
An interactive dashboard was also created with Tableau to display charts associated with the analysis.
Click here to interact with the data visualization.
The following conclusions were drawn from analysis:
Midhun R | Avid Learner | Data Analyst | Data Scientist | Machine Learning Enthusiast
Contact me for Data Science Project Collaborations
GeeksforGeeks, 'Create a stacked bar plot in Matplotlib'. [Online].
Available: https://www.geeksforgeeks.org/create-a-stacked-bar-plot-in-matplotlib/
Medium, 'Seaborn Heatmap for Visualising Data Correlations'. [Online].
Available: https://towardsdatascience.com/seaborn-heatmap-for-visualising-data-correlations-66cbef09c1fe


