Let's Explore A Dataset #1: Seasonality in Air Traffic Routes
A blog post (to be) posted on ByteMuse.com that explores a public dataset from the US Department of Transportation.
Finding Data
Many publicly available datasets from the government, universities. Great list of datasets Using this one.
Design Objectives, Questions
I'm an avgeek, transportation geek... End of holiday season, where to people vacation to? How is it affected(effected?) by seasonality? climate: changes in traffic to northern vs southern hemisphere? Most traveled to countries? Could just ask/answer these questions with R, sql, etc... what insights can come from visualization/holistic/non-specific approach? Exploration vs reporting focus...
Cleaning, Aggregating Data
Make csv more usable: remove unused cols, strings to numbers, make small for web Join datasets, ie find and compile keyed columns(airport codes, airline codes, etc...)
open with Numbers(Excel), remove columns, export as CSV
open VIM:
  rename headers, formatting
  :%s/^2014//g # remove 2014 before month number
  :%s/^M//g # remove 'weird' line breaks
Sublime: "([0-9]+),([0-9]+)" -> $1$2 # for quoted, commas in numbers
Validate lines: ^[^\,]+,[^\,]+,[^\,]+,[^\,]+,[^\,]+$

Airport codes...
^(...)\t"(.+),(.+)"\t[0-9]+$ -> $1,"$2","$3"
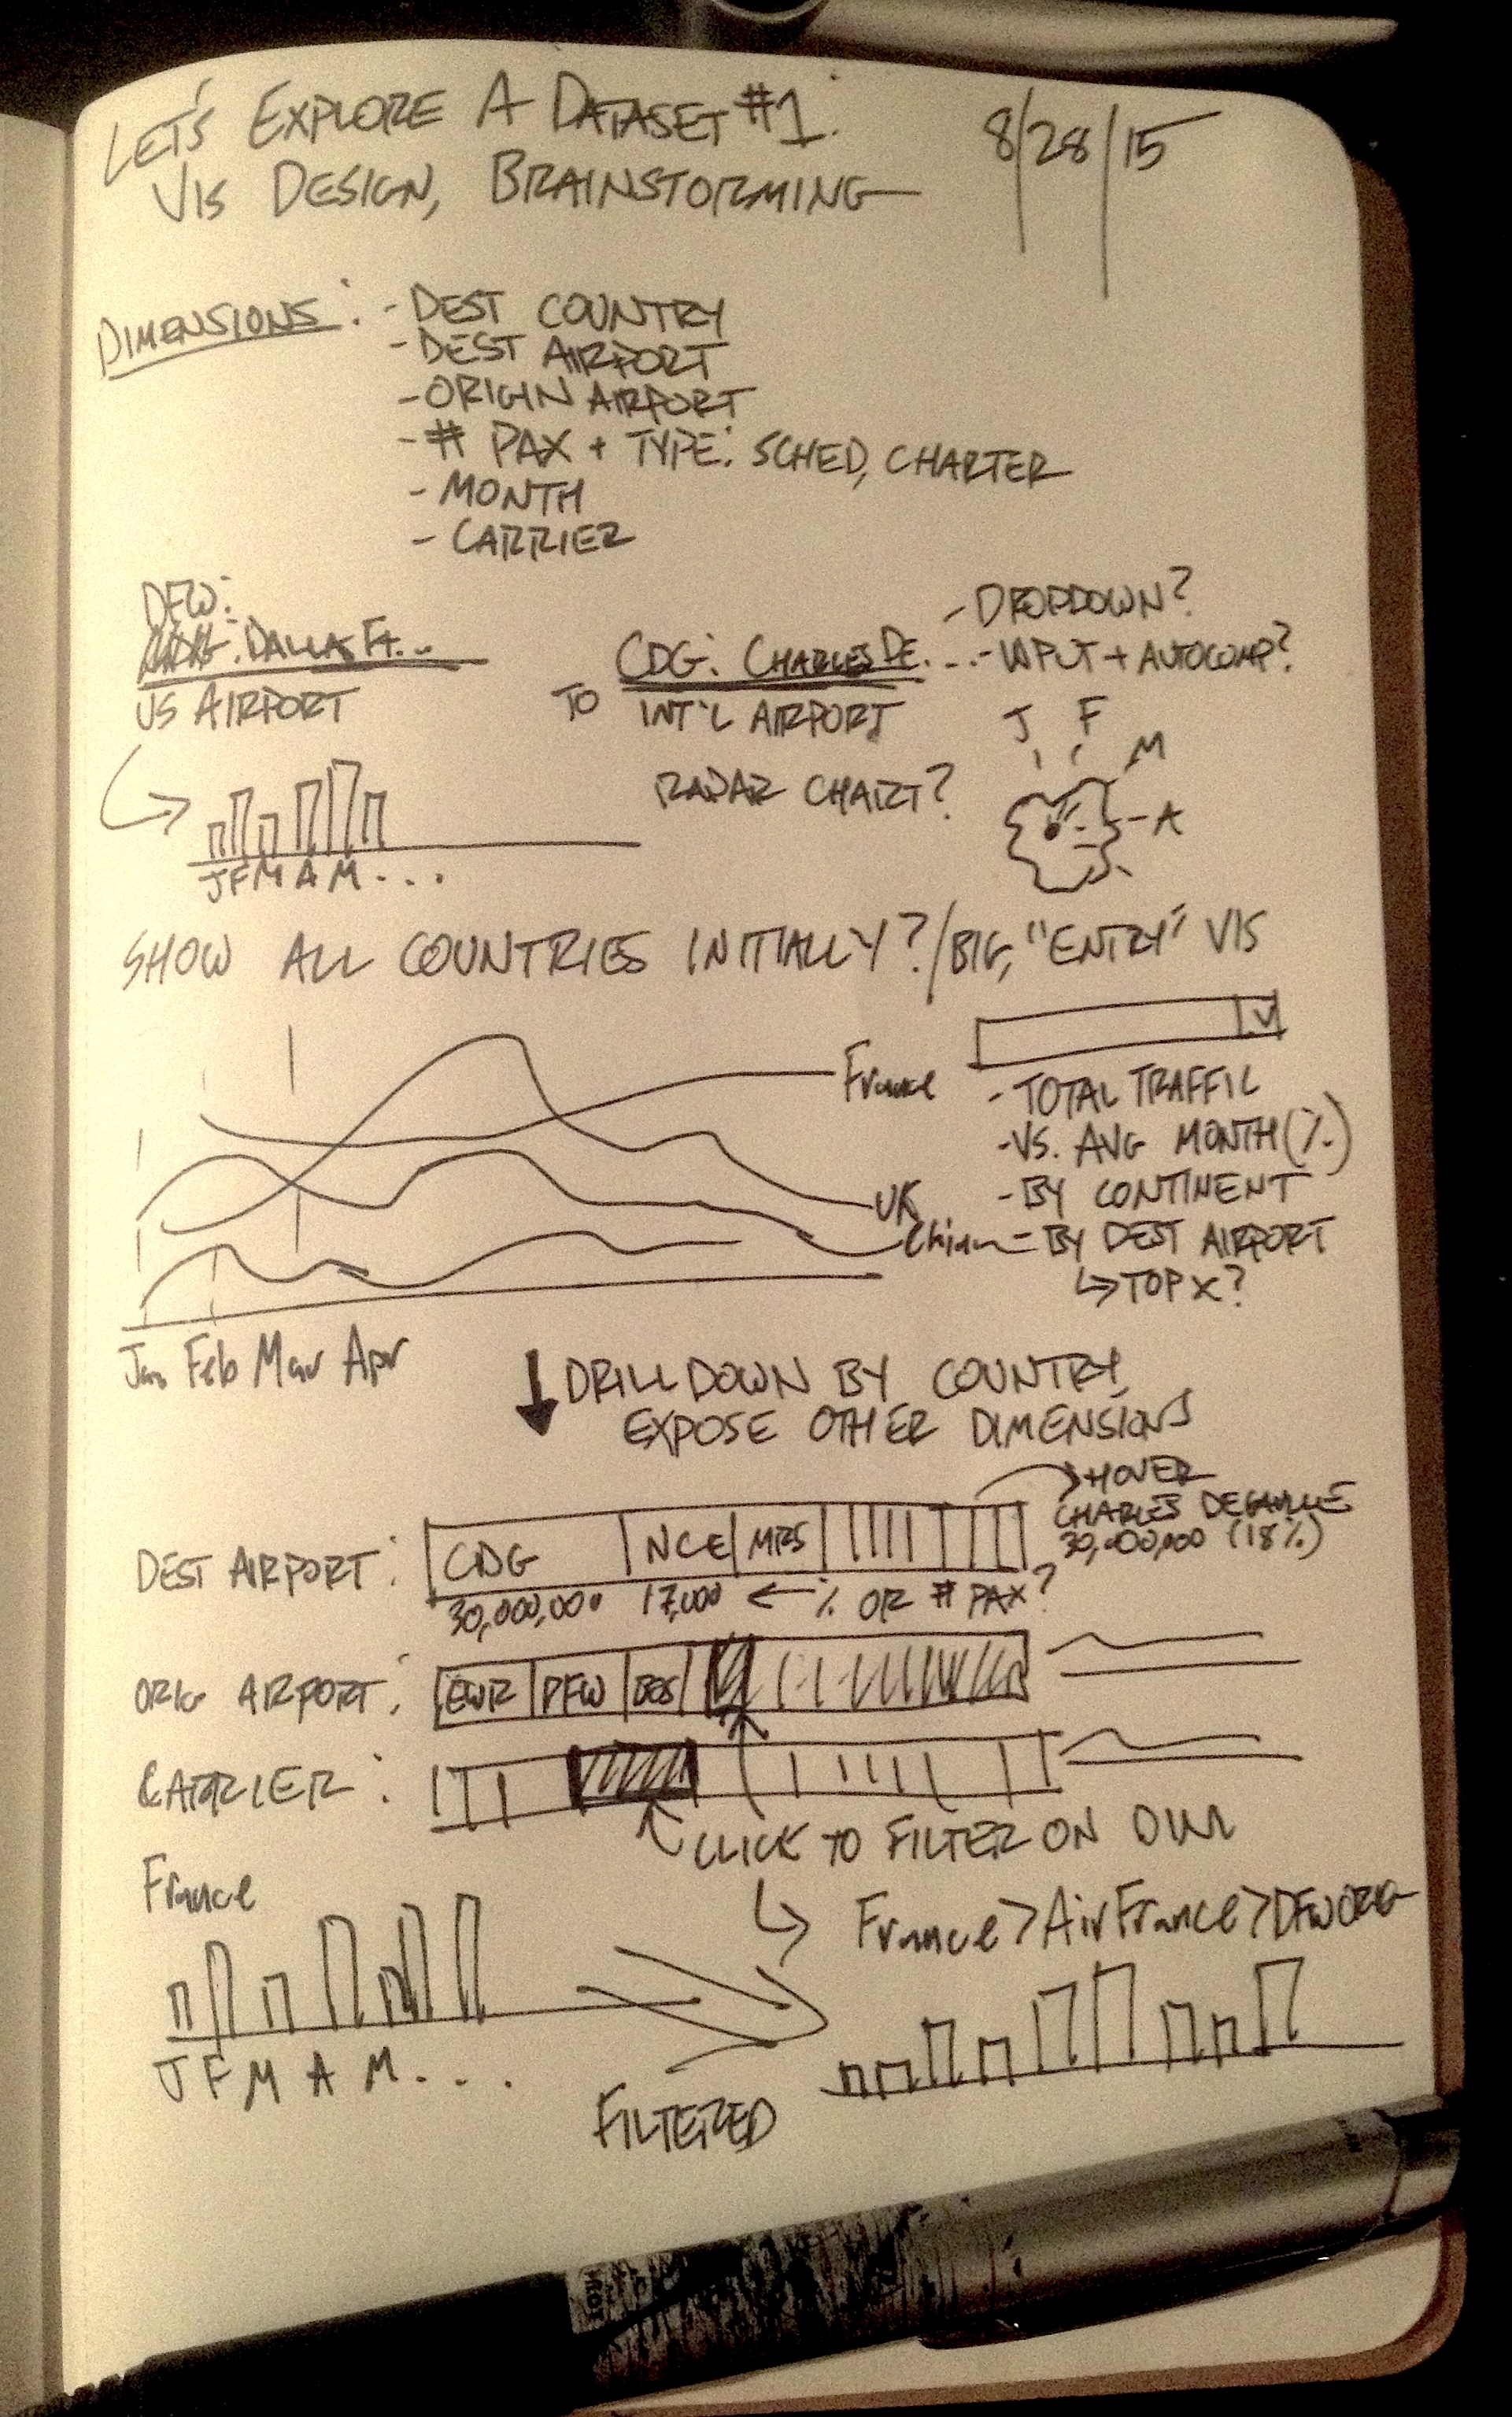
Designing and Sketching
Show notebook sketches, think about objectives...
Implementation
JAVASCRIPT GOES HERE... d3? Ractive? Browserify?
Review, final thoughts
What have we learned from the interface? Does it go against/for our suppositions?