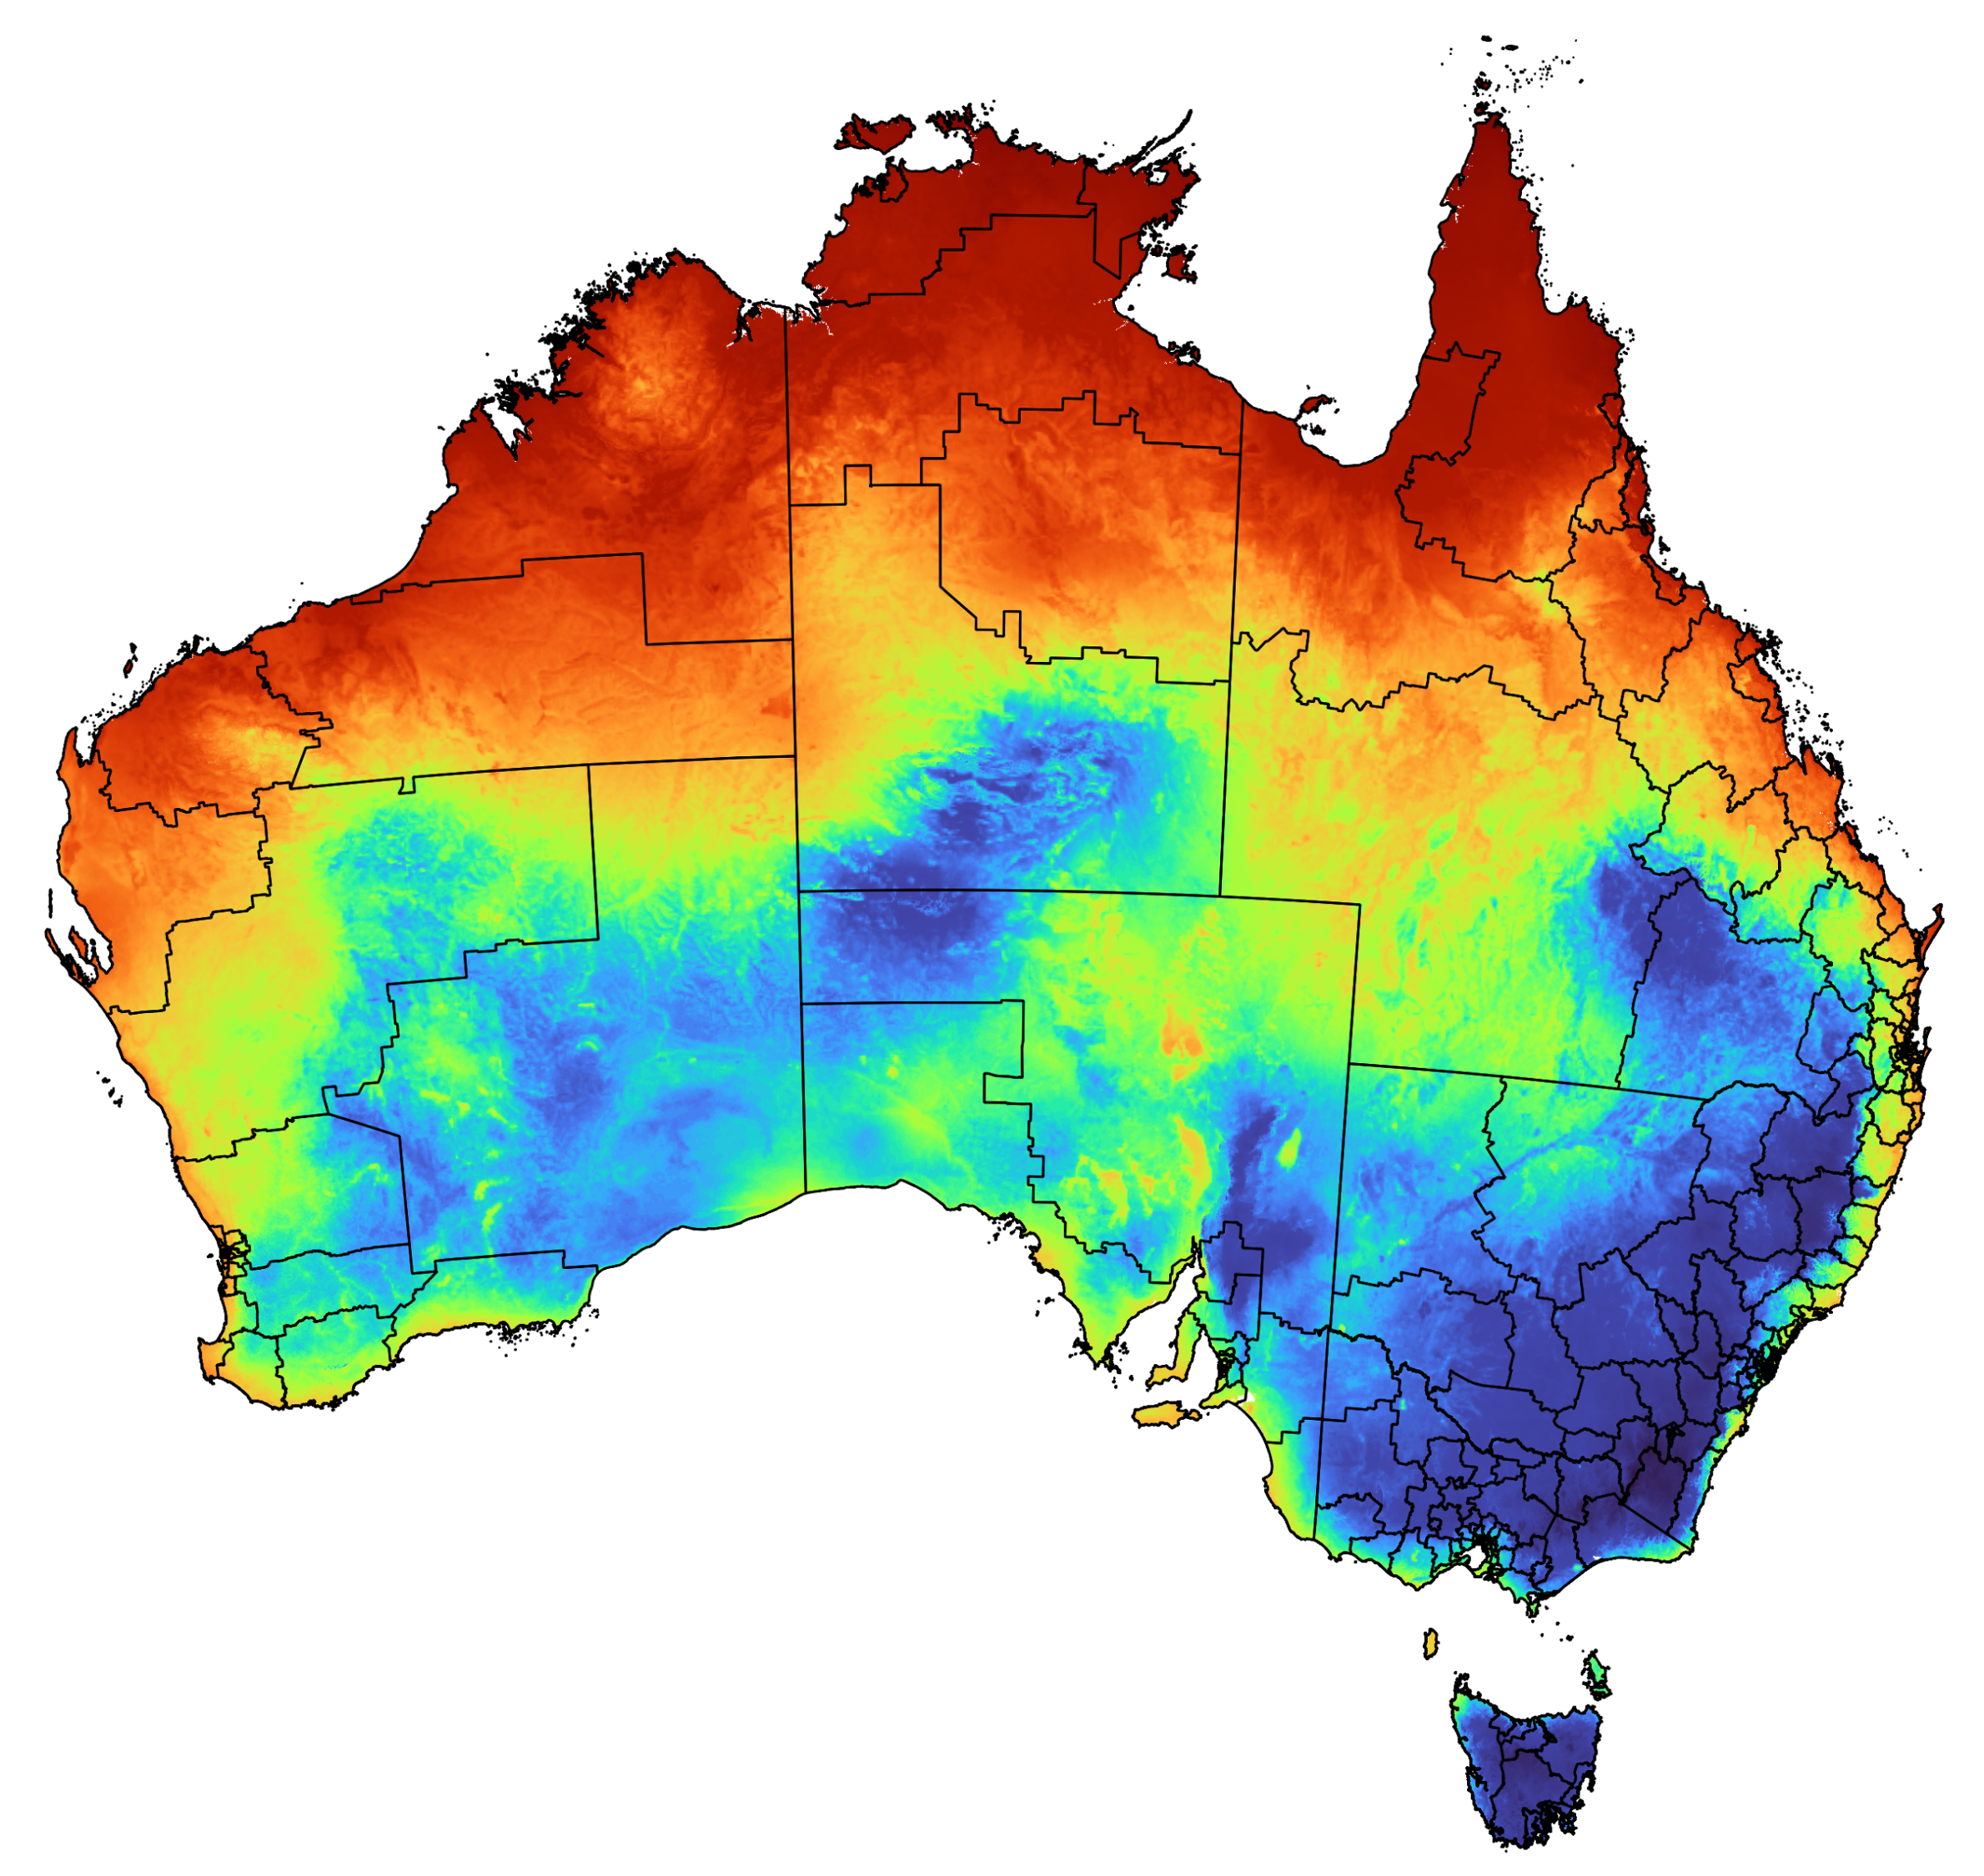
Child health versus climate/air pollution in Australia
Australia SA3-level analysis of relationship between child mortality/morbidity and climate conditions

Prof Corey J. A. Bradshaw
Global Ecology | Partuyarta Ngadluku Wardli Kuu, Flinders University, Adelaide, Australia
September 2023
e-mail
Scripts
SA3climateChildHealth.R: R code to reproduce the resampled boosted regression tree analysis for determining the relationships between child-health metrics, climate, and air pollution at the scale of Statistical Area Level 3 (SA3).
Data
- healthclim.csv
- fire20132022relIndex.csv
- NO2: NO2 pollution data (2010-2019)
- PM25: PM2.5 pollution data (2012-2021)
Required R libraries
dismogbmmiceboottruncnorm


