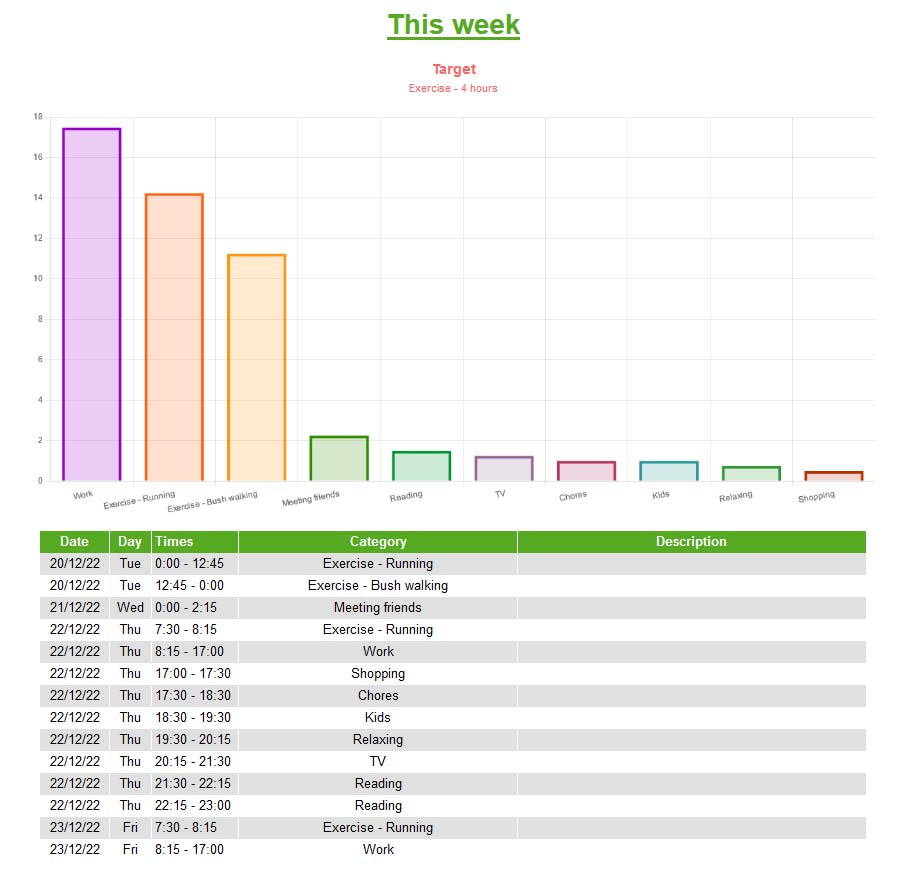
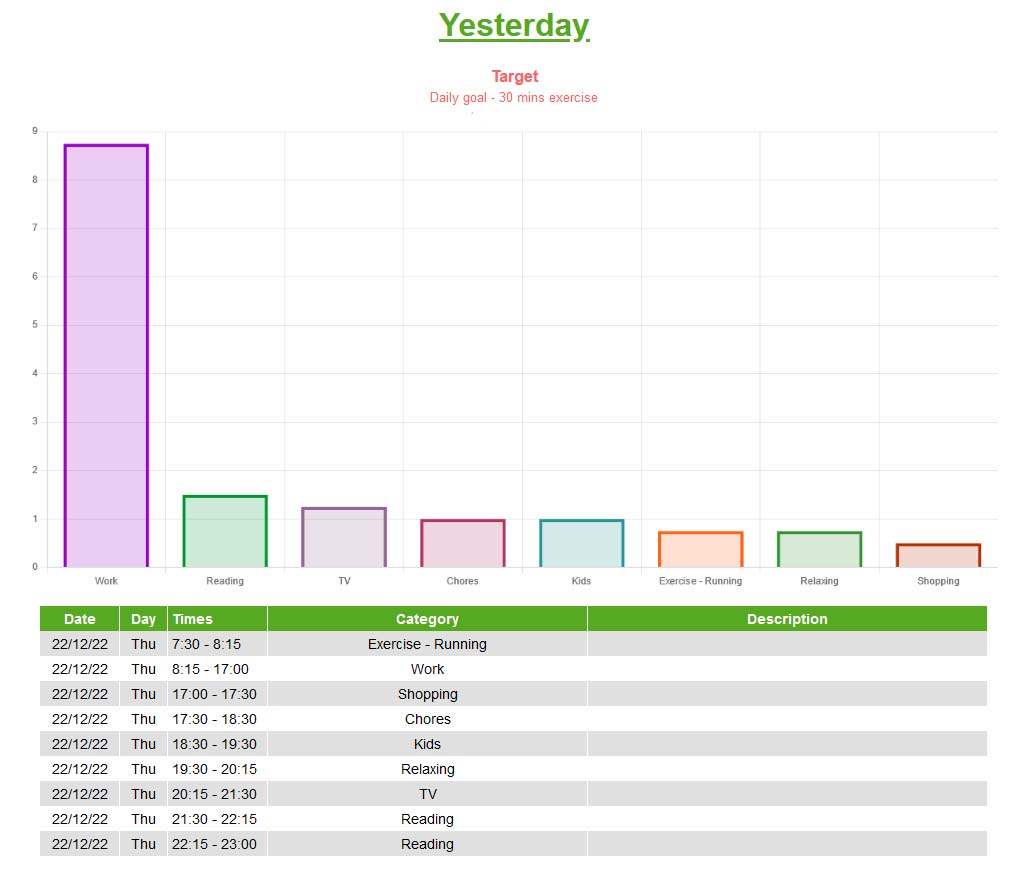
A timelogging app to help you see where you spend your time in various areas of your life. If you record every single thing you do in the day, for a month, you can see where you are wasting time and what you should be doing more of. You can set up any category. There are categories such as Work, Exercise, Socialize so you can see how long your are spending on each category.
Graphs let you see a clear picture of where you spend your time.
You can have as many sections as you want. Sections such as Yesterday, This Week, Last Week, This Month, Last Month, Last 90 days. Each section can have different settings. You set the start and end date eg start of the month and end of the month. You can set goals for each section.

Settings are all in /scripts/settings.js.
A list of time categories of where you spend your time can be put into the categories array.
You can have multiple sections to view the time spent in each category. The settings array takes an array of section objects.
Each section has various settings where it tallies up the number of hours spent on each category in your category list. The section takes a start date and end date, you give it a section name and some other options.
Each section object has the following properties:
| Property | Description |
|---|---|
enabled |
To turn on or off the section. It takes true or false. |
name |
Name of the section. This would be something like Today, Yesterday, This week, This month, Last month, Last 90 days etc. |
startDate |
This takes a date to start measure the time spent in each of your categories. It takes a Javascript date. It is suggested you use the Blue Moon date library. |
endDate |
This takes a date to end measure the time spent in each of your categories. It takes a Javascript date. It is suggested you use the Blue Moon date library. |
table |
It takes true or false. It displays a table of time entries of date, time, category, description in the given time period (using startDate and endDate provided above) for this section. |
categoryGraph |
It takes true or false. It displays a bar graph, a bar for each category and sorts by most time spent to least time spent. |
hideDefault |
It takes true or false. Currently not working. |
goal |
Currently, this takes text as a reminder of your goal for that time period eg you could do something like "Jogging - 20 hrs". This text goes below the title f each section so you can see how much time you spent on a category vs your goal for that time period. |
By default, data is stored in localStorage using the ls.js file. When you enter a time entry and click Add, this triggers the databaseUpdate(item, data) function. item is the json data for the time entry, data is all the data. You can change this function to link up to your prefered database.
