Similarities
Downloading dependencies:
Python3
The project uses Python 3.8. If you have problems running it with newer versions, try running it with Python 3.7. The following tutorial can help with installing Python: https://realpython.com/installing-python/
PsychoPy3
Install PsychoPy here: https://www.psychopy.org/download.html. This project uses PsychoPy v2021.2.
Installation and Set-up
git clone https://github.com/jvlab/similarities.git
Install required packages in a virtual environment
Create virtual env and download dependencies
cd ~/similarities
conda env create -f environment.yaml
venv_sim_3.8 should be listed when you run
conda env list
To enter the virtual environment, before running code
conda activate venv_sim_3.8
To exit the virtual environment after running scripts
conda deactivate
Run scripts from the similarities directory as modules, e.g.,
cd ~/similarities
conda activate venv_sim_3.8
python -m analysis.script_name
...
conda deactivate
Development setup
TODO (incomplete!) Describe how to install all development dependencies and how to run an automated test-suite of some kind. Potentially do this for multiple platforms.
nosetests testUsage
Trials in an Experiment
In a typical experiment, there are a series of ranking trials. The analysis requires an experiment to be repeated multiple times. Our standard procedure assumes 5 repeats. This way each trial ends up being performed 5 times.
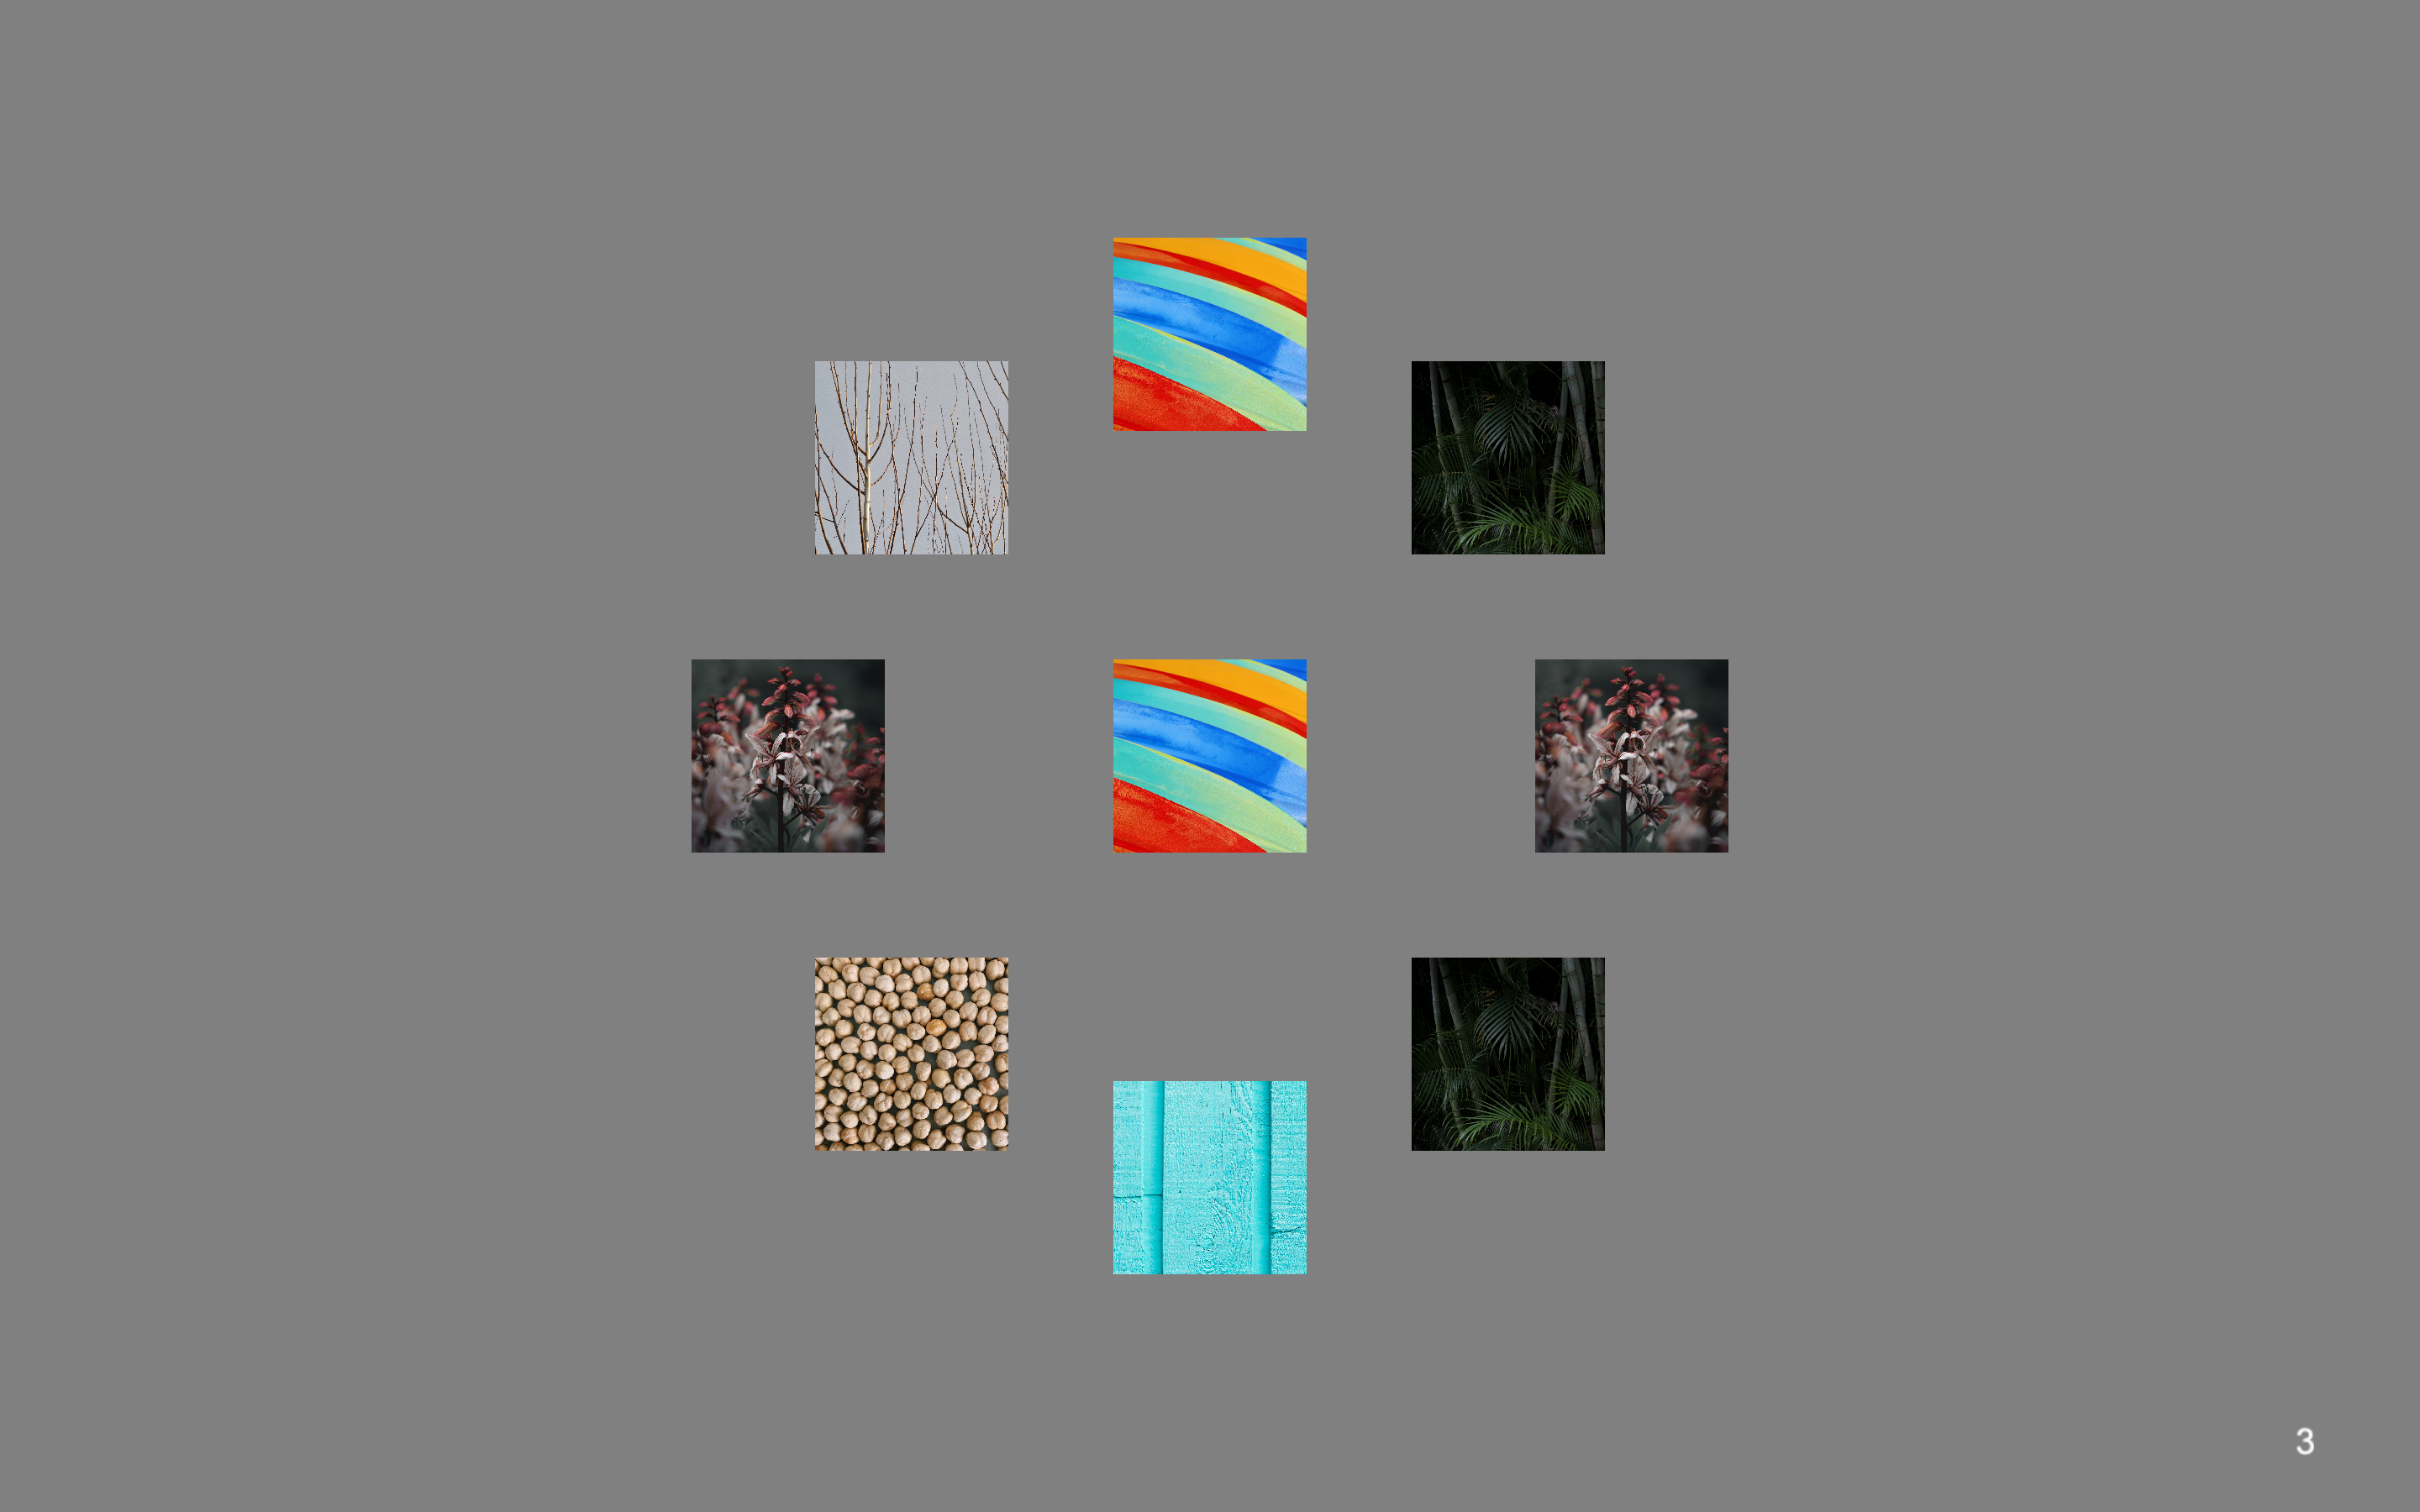
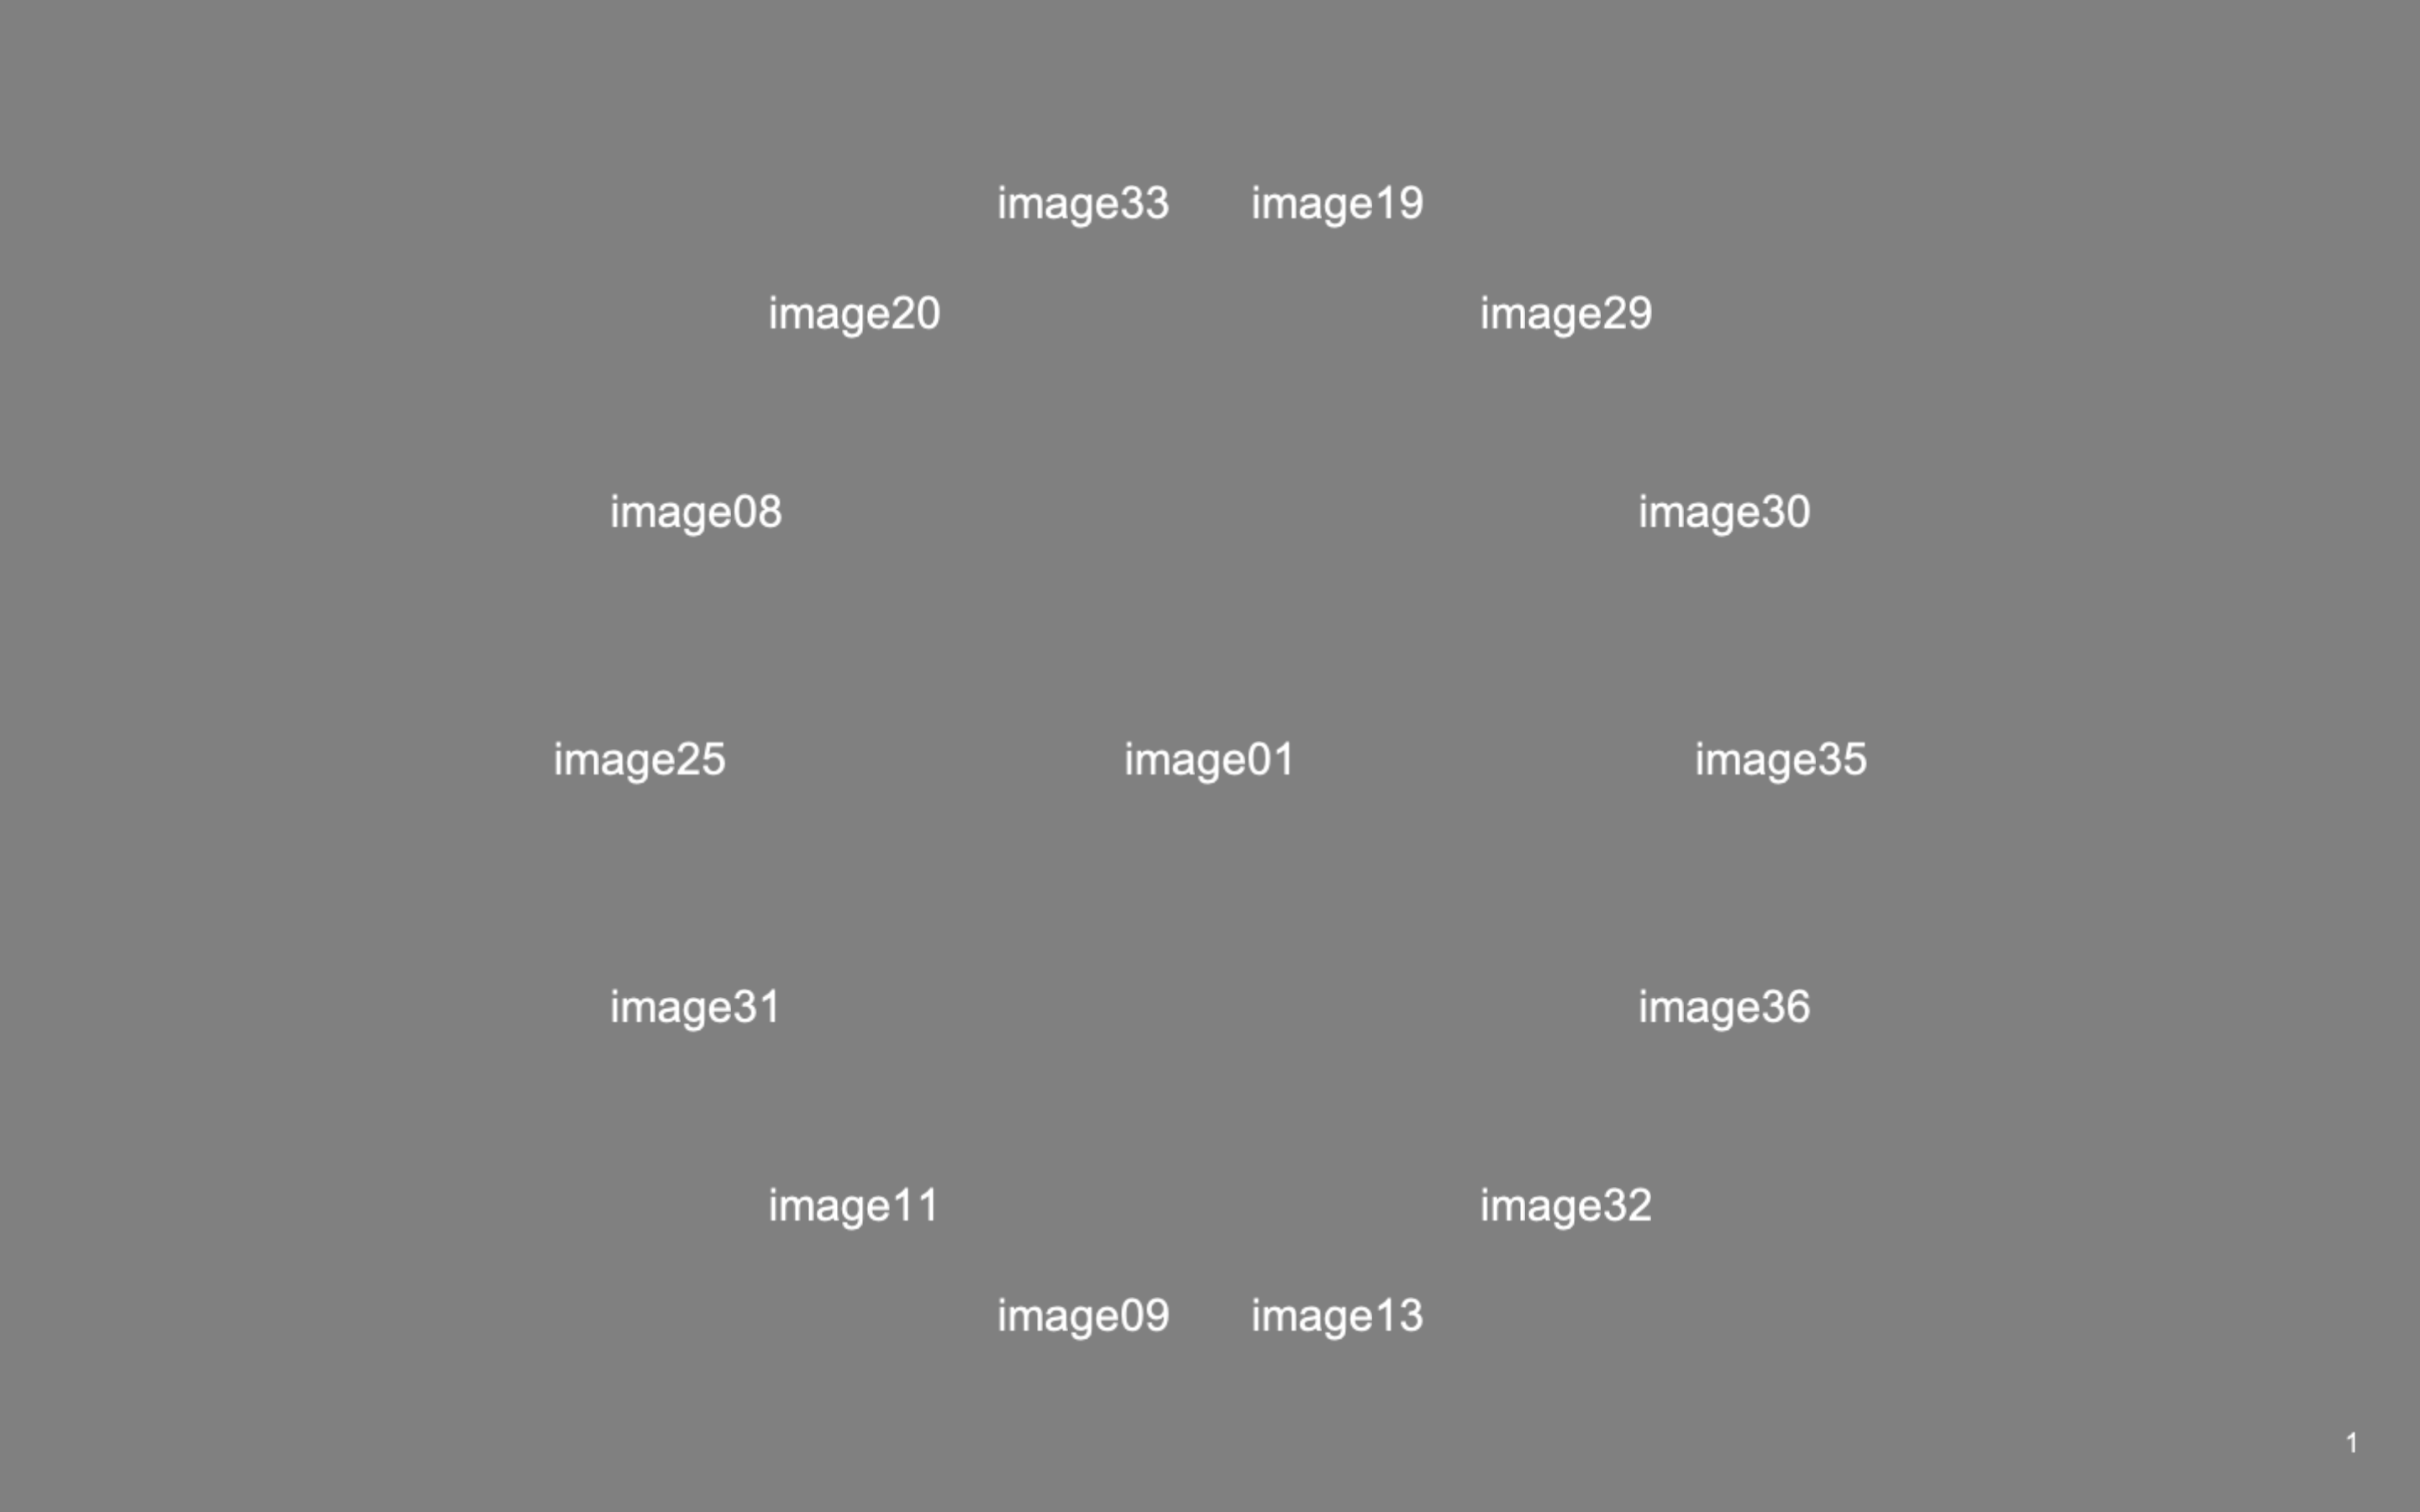
A sample trial comprises a stimulus in the center, known as the 'reference', and 8 surrounding stimuli. The number of surrounding stimuli can vary and is controlled by the num_stimuli_per_trial parameter.
In each trial, the goal of the subject is to rank stimuli around the reference in order of similarity to the reference. In other words, they must click the most similar item first, then the second-most similar and so on until they have clicked all the surrounding stimuli.
Given a list of stimuli, we can generate randomized configurations of trials, in which each stimulus appears as the central reference and is compared to every other stimulus at least once.
For details on valid designs and the constraints that have to be met, see the preprint [link to be provided] (Section: Discussion).
Sample Trials
A trial from the image experiment with num_stimuli_per_trial=8. The default value is 8.

A sample trial from the word experiment with num_stimuli_per_trial=14

Create Trials
Here, we explain how to use trial_configurations to get trials.
The script trial_configuration.py takes in the following parameters from
experiments/config.yaml:
num_stimuli: Size of the stimulus set (default=37)num_stimuli_per_trial: Number of stimuli appearing around a reference in each trial (default=8, see above)path_to_stimulus_list: Path to the text file containing names of all stimuli, one per line.
Open experiments/config.yaml and set the values of these parameters to the desired values.
Then, run the script from the analysis subdirectory in similarities:
$ cd ~/similarities
$ python3 -m analysis.trial_configuration

$ ls *.csv
trial_conditions.csv
The trial_conditions.csv generated contains the subsets of stimuli that will appear in each trial. Each trial's information is in a separate row.
Positions along the circle along which surrounding stimuli appear are given by columns stim1 to stim8 (if num_stimuli_per_trial=8), while the refcolumn indicates which stimulus appears in the center. Thestim1position is always to the right of the reference.stim2onwards run clockwise fromstim1.`
Randomize Trials
Next, we need to duplicate the conditions files for each repetition of the experiment. In the standard procedure, we break up the 222 trials generated into two sessions of 111 trials each. Thus, each repetition comprises two sessions.
For each time an experiment is to be conducted/repeated do the following to randomize the trial order and stimulus position within trials:
Add a row and column to randomize columns and rows by
- Open
trial_conditions.csvin Microsoft Excel. - Insert a new row under the header row (Row 1), run the random command (=RAND()) to populate cells in all columns except the
refcolumn. - Insert a new column after the last column, on the right side, and run the random command (=RAND()) to populate all cells in the column from rows 3 onward.
Randomize stimulus position across trials (shuffling columns within rows)
- Run the =RAND() function in all the cells of Row 2 to generate new random numbers.
- Excluding columns
refand the last random number column, select all rows from Row 2 onward. - In Excel, click Home, then Sort & Filter, then select Custom Sort.
- Click Options button in the bottom right corner of the pop-up, then under Orientation, select Sort left to right.
- In the table that pops up, under Row, make sure "Row 2" is selected and click OK.
- If column values under
stim1tostim8do not shuffle, perform the sorting again by clicking Sort & Filter in the toolbar, then selecting Custom Sort and clicking OK.
Randomize trial order (shuffling rows)
- Run the =RAND() function in all the cells of the last column to generate new random numbers.
- Select all rows starting from Row 3 onwards - include all columns.
- As before, in the toolbar, click Sort & Filter, then Custom Sort, then the Options button in the bottom right.
- Under Orientation, select Sort top to bottom.
- In the table that appears, under Column, make sure the last column (in our case, Column J) is selected.
- Click OK.
- As before, if rows do not shuffle, perform sorting again by clicking Sort & Filter in the toolbar, then selecting Custom Sort and clicking OK.
Save in two new files
- Create two new files.
- Copy the header row (Row 1) into both files.
- In the first file, copy and paste Rows 3-113, i.e., half of the trials.
- In the second file, copy and paste Rows 114-224.
- Save each file as
conditions.csvin the appropriate directory (see Recommended Directory Structure below).
NOTE: The above breakdown of trials into conditions files may be different if performing this operation for a non-standard version of the experiment. With 37 stimuli, and 8 stimuli around the reference in each trial, we have 222 trials. Each session comprises 111 trials.
Recommended Directory Structure
subject-data
The subject-data directory should have two subdirectories for raw and preprocessed data and be organized as follows:
subject-data/
    raw/
        Subject1/
            repeat_1/
                DD-MM-YYYY/
                    conditions.csv
                    responses.csv
                    DD-MM_YYYY.log
                DD-MM-YYYY/
                    conditions.csv
                    responses.csv
                    DD-MM_YYYY.log
            repeat_2
            repeat_3
            repeat_4
            repeat_5
        Subject2/
    ...

    preprocessed/
        Subject1_exp.json
        Subject2_exp.json
        ...
Scripts and Their Input Parameters
trial_configuration.py
This as explained above creates a conditions file, containing the configurations of experimental trials. There are no user inputs that need to be entered into the command line.
cd ~/similarities
python3 -m analysis.trial_configuration
preprocess.py
This converts the raw csv files containing similarity judgments from a subject's complete dataset, and combines them into a single json file. To run, navigate to the main directory. (All scripts should be run from this directory).
cd ~/similarities
python3 -m analysis.preprocess
Input parameters:
- Path to subject-data directory (string)
- Name of experiment (string): this is used to name the output file
- Subject IDs (strings separated by spaces if more than one)
describe_data.py
This generates some figures describing the choice probabilities obtained experimentally after they have been preprocessed.
cd ~/similarities
python3 -m analysis.describe_data
Input parameters:
- Subject IDs (strings separated by spaces if more than one)
- Path to subject-data/preprocessed directory (string)
model_fitting.py
This script takes in similarity judgments (reads in a json file) and finds the configuration of points in 1, 2, 3, 4 and 5 dimensional space that explain the judgments.
cd ~/similarities
python3 -m analysis.model_fitting
Input parameters:
- Path to json file containing subject's preprocessed data
- Experiment name
- Subject name or ID
- Number of iterations - how many times this should analysis be run (e.g. 1)
- Output directory
- Sigma (a noise parameter - default value = 0.18)
perceptual_space_visualization.py
This script applies PCA on the 5D coordinates return by the modeling. It then shows a scatterplot of the points projected on the first 2 principal components.
cd ~/similarities
python3 -m analysis.perceptual_spaces_visualization
Input parameters:
- Path to npy file (string)
- Subject name or ID (string)
Reproducing Figures
To reproduce figures from our accompanying manuscript, do the following:
Run describe_data from the similarities directory
Note that since only one subject's dataset is provided, the comparison heatmap (Figure 4) will not be made.
$ cd ~/similarities
$ python3 -m analysis.describe_data
This will result in the following output, in response to which you should enter "S7", the identifier of the dataset provided
Subjects separated by spaces:S7
The script will ask for a path to the preprocessed data directory. Enter it as follows:
Path to the subject-data/preprocessed directory
 e.g., './sample-materials/subject-data/preprocessed': ./sample-materials/subject-data/preprocessed
This will produce two charts (one after the other) that show data from Figures 3A and 4.
To produce Figure 6, run perceptual_space_visualization and enter the path to the npy file containing model-fitting results:
$ cd ~/similarities
$ python3 -m analysis.perceptual_space_visualizations
Enter the input parameters requested as follows, and press enter to create the figure.
Path to npy file containing 5D coordinates (e.g., ./sample-materials/subject-data/model-fitting/S7/S7_word_anchored_points_sigma_0.18_dim_5.npy): ./sample-materials/subject-data/model-fitting/S7/S7_word_anchored_points_sigma_0.18_dim_5.npy
Subject name or ID (e.g., S7): S7
Release History
- 0.1.0
- The first proper release
- CHANGE: Added scripts in analysis
- 0.0.1
- Work in progress
Metadata
Suniyya A. Waraich – saw4003@med.cornell.edu
Distributed under the MIT license. See LICENSE for more information.
https://github.com/suniyya/github-link
Contributing
- Fork it (https://github.com/yourname/yourproject/fork)
- Create your feature branch (
git checkout -b feature/fooBar) - Commit your changes (
git commit -am 'Add some fooBar') - Push to the branch (
git push origin feature/fooBar) - Create a new Pull Request